2015 THIRD-PARTY LOGISTICS STUDY
The State of Logistics Outsourcing
4
10
18
26
34
42
52
58
62
64
66
Executive Summary
Current State of the 3PL Market
Omni Channel
Strategic Workforce Management
CRM and Mobile Technologies
Mexico
Strategic Assessment
About the Study
About the Sponsors
Credits
Contacts
©2015 C. John Langley, Jr., Ph.D., and Capgemini. All Rights Reserved. No part of this document may be reproduced, displayed, modified or distributed by any process or means without prior written permission from Capgemini. Rightshore® is a trademark
www.3plstudy.com
Current State of the 3PL Market
In the 2015 19th Annual Third Party Logistics Study, survey results showed the continuing, positive
overall nature of shipper-3PL relationships. Both parties view themselves as being successful, and shippers are seeing positive results again this year: an average logistics cost reduction of 9% an average inventory cost reduction of 5% and an average ixed logistics cost reduction of 15%.
In addition to seeing cost reductions, shippers said they’ve seen average improvements in their order ill rate and order accuracy. The 2015 3PL Study showed that 73% of those who use logistics services and 77% of 3PL providers are satisied that they have received open, transparent and effective communication from their partners. A distinct majority—92%—of shippers report that their relationships with 3PLs generally have been successful. Among 3PLs, 98% say their relationships with shippers have been successful.
While there are more positive business environments in certain geographies, industry verticals and niche types of services, the global logistics industry is one that does have its challenges.
Similar to last year, several ongoing factors are impacting progress toward the advanced end of the maturity model for shipper-3PL relationships. The generally less-than-exciting levels of global economic activity are driving highly variable and sometimes sluggish or neutral demand for outsourced logistics services. Shippers report an average of 36% of their total logistics expenditures are related to outsourcing compared to an average of 44% reported last year.
Again with this year’s study, the most frequently outsourced activities tend to be those that are more transactional, operational and repetitive. Activities that are strategic, IT-intensive and customer facing tend to be outsourced to a lesser extent.
However, there is some indication that those activities, particularly the provision of capable IT services, can be a key element in the value proposition in shipper-3PL relationships. The results from this year’s study again conirm that the IT gap continues to narrow to some extent.
The New Landscape of
Omni-Channel Retailing
Today’s consumers are looking for always-on, always-open shopping opportunities, and retailers are investing in technology, supply chain resources and fulillment strategies that will provide a seamless experience across all retail sales channels. While retailers understand the importance of the omni-channel network, this year’s survey shows that omni-channel supply chains are still maturing. Nearly one-third of the respondents participating in the study said they are not prepared to handle omni-channel retailing and only 2% of respondents rated themselves as high performing in the omni-channel space.
5 EXECUTIVE SUMMARY
Since retailers are increasingly dependent on technology for real-time visibility into operations, they are gradually moving all of their platform-based solutions to the cloud. They are also using integrated technologies to improve the omni-channel network. Respondents are investing in warehouse management systems (58%), enterprise resource planning software (54%), transportation management systems (54%), supply chain visibility (43%), warehouse management system add-ons (33%) and RFID (21%). Respondents also said they are investing in technologies that allow them to personalize and customize the shopping experience, such as mobile apps (33%).
By obtaining and transmitting information more eficiently and in new ways, retailers are able to better meet customers’ needs and offer more fulillment options, further improving their customer service, which is a priority. About one-third of respondents—32%—listed customer service as the top reason they are investing in omni-channel fulillment; 23% cited service levels; 11% listed freight costs.
Strategic Workforce Management
Throughout the Supply Chain
Strategic workforce management will be particularly important for the 3PL industry as it is expected to face a shortage of talent. Nearly 50% of respondents said they are already having dificulty in inding or attracting talent, and the average hiring growth rate within the supply chain industry is expected to be higher than the average growth rate across other occupations. Estimates show that 60 million people will exit the industry by 2015, but there are only 40 million people to ill the gap.
Existing positions within the supply chain industry are changing rapidly. By 2015, three out of four jobs within the industry are expected to change. Furthermore, the dynamics of supply chain professionals are changing. In the future, only having hard skills in operations management will not be suficient. Instead, there will be a mix of both soft and hard skills involving leadership qualities and cross-functional competencies that will shape the industry.
Logistics providers face competition for employees. Not only do they compete with other 3PLs, they also compete with manufacturers, retailers and consulting irms. Many managers in leadership roles leave large 3PLs for better opportunities in other industries.
Without strategic workforce planning, companies may struggle to grow. The return on investment from strategic workforce management is substantial, contributing to a boost in morale, increased productivity, increased discretionary effort, lower turnover and higher customer satisfaction.
Customer Relationship Management
and Use of Mobile and Cloud
Technologies in 3PL Sales Processes
Third-party logistics providers are continuously looking for ways to improve their sales processes and proit margins, and many are turning to contemporary technologies to assist with this challenging assignment.The use of Customer Relationship Management (CRM) and mobile-cloud technologies can significantly enhance and streamline the productive activities of 3PL sales executives. Although there are more generic sales-related CRM technologies, 75% of shippers and 77% of providers agree the 3PL sector could beneit signiicantly from the availability of industry-tailored CRM capabilities compared with what is currently available.
There are a number of ways in which the use of CRM and mobile technologies can create value for the 3PLs and their customers. Overall, the principal beneits of using these technologies are they streamline global worklows and processes, provide executive-level visibility to commercial leaders, and identify ineficiencies and bottlenecks in commercial operations. There are a number of ways customers of these 3PLs can beneit directly from the types of information available, particularly real-time information regarding topics such as shipment visibility, etc.
The use of CRM and mobile technologies can also provide an advantage for 3PLs. This year’s survey revealed that 40% of shippers indicated that their bid processes place emphasis on 3PLs utilizing capable CRM technologies.
Although there are a number of opportunities related to the use of CRM and mobile technologies in the 3PL sales process, getting more experienced, productive sales executives to welcome these new technologies is sometimes easier said than done.
Mexico Rising as Manufacturing
and Logistics Hub
The manufacturing industry in Mexico is improving, which is creating opportunities for 3PLs as logistics services play a crucial role in rendering Mexico’s businesses cost competitive as compared with similar ventures globally. Mexico has more free-trade agreements than any other country, a strategic geographic location, and is renowned as a low-cost manufacturing and export destination.
Just under half of study respondents—40%— said they have already moved some of their operations to Mexico, citing reduced freight transport time and closer proximity to sources as the most important factors driving the change. Study respondents said their businesses are primarily moving operations to Mexico from the U.S. (55%), China (36%) and Canada (9%).
However, a lack of quality infrastructure and certain regulatory aspects continue to challenge Mexico.
Strategic Assessment
Evolution of the 3PL Business Model: New Competition
Customers are demanding more responsiveness from companies, and companies are investing in alternative solutions to meet these needs while expanding and differentiating their services. These investments are typically signiicant, and companies are looking for additional ways to leverage the money they are spending to increase revenue streams. In some cases, companies are offering these services to new customers or competitors and may create a solution that can be spun off or provided as a service to others in a similar or even the same industry.
7 EXECUTIVE SUMMARY
Supply Chain Risk Management
The risks associated with supply chains are evolving from a back-ofice concern to a prominent position on the boardroom agenda at an increasing number of organizations. Recognizing the importance of risk management is significantly enhancing the effective management of supply chains worldwide, and the development of processes, metrics and tools for supply chain risk management has become one of the highest priorities for supply chain executives at many organizations today.
Third-party logistics providers are showing a growing level of commitment to including risk management services among those they promote and provide clients. Given the current interest in risk management and the emphasis most 3PLs are placing on developing new products and services to create value for their customers, this appears to be a prime area for collaboration between 3PLs and their customers.
The Intensifying Truck Driver Shortage
New supply chain models and mobile devices are making just-in-time ordering and fulfillment all the more possible, but professional truck drivers remain one of the most critical links within the supply chain. As the economic rebound continues, freight demand is increasing as are concerns over who will deliver it. The impeding truck driver shortage in the United States has been an ongoing topic of conversation and academic concern for many in the supply chain for years, and the driver shortage is continuing to intensify.
If freight demand grows as it is projected to, the driver shortage could balloon to nearly 240,000 drivers by 2022. The impact the truck driver shortage will have on the supply chain is signiicant. Many manufacturers, distributors and other intermediaries operating private truck leets are outsourcing their trucking to 3PL providers as a solution, but this may be just kicking the can down the road. It is likely companies will also begin making upstream adjustments, such as shifting distribution patterns, relying on intermodal transportation and shipping larger quantities at one time. Regardless, professional drivers remain vitally important to provide the last-mile delivery of goods.
Working Corporate Social Responsibility Into the Supply Chain
Corporate social responsibility (CSR), which comprises all facets of how companies should do business in a sustainable manner, is growing in importance. A growing number of companies are concerned not just with natural resources, but also human rights, labor practices, environmental impact, business ethics and corporate governance. The new world of CSR utilizes a proactive approach and includes a stronger emphasis on issue resolution, risk reduction and nimble reaction to problems, accompanied by innovation (e.g., green materials, carbon footprint optimization), capacity building, stakeholder engagement (internal and external), crisis management and media relations.
About the Study Respondents…
User
Shippers
Shippers
Providers
3PL/4PL
Non-user
100 respondents
Industry representation
Title within company
Automotive
US$25 billion or more /
€20 billion or more
US$1 billion – less than US$25 billion / €750 million – less
than €20 billion
US$500 million – less than US$1 billion / €375 million – less than €750 million
US$1 billion – less than US$25 billion / €750 million –
less than €20 billion
Providers
US$25 billion or more / €20 billion or more
US$1 billion – less than US$25 billion / €750 million – less
than €20 billion
US$500 million – less than US$1 billion / €375 million – less than
€750 million
Less than US$500 million /
€375 million
sales for 2014
President/Chief Executive Officer
5%
Vice President/ Sr. Vice President
Director/ Managing Director/General Manager
Manager
Supervisor
Other (including consultant,
student, educator, researcher
and writer)
Other (including consultant,
student, educator, researcher
Sr. Vice PresidentDirector/Managing
2015 Third-Party Logistics Study
9 EXECUTIVE SUMMARY
•
Total logistics expenditures as a % of sales revenue
7%
•
% of total logistics expenditures directed to outsourcing
36%
•
% of transportation spend managed by third parties
51%
•
% of warehouse operations spend managed by third parties
36%
Current State….
Financial aspects of users’ logistics and 3PL expenditures
What tools a 3PL needs to be successful
(top 6 from user vs top 6 from provider)IT gap narrows
Benefits from use of 3PL services
Logistics cost reduction
9%
Inventory cost reduction
5%
Log
istics fixed-asset reduction
15%
Order fill rate from
60% to 66%
Order accuracy from
61% to 66%
Shippers
1. Transportation management (execution)
2. EDI
3. Transportation management (planning)
2. Transportation management (execution)
3. Customer order management
4. Transportation management (planning)
5. Visibility (order, shipment, inventory, etc.)
4. Warehouse/DC management
5. Visibility (order, shipment, inventory, etc.)
6. Web portals for booking, order tracking,
inventory, etc.
6. Web portals for booking, order tracking,
inventory, etc.
Provider
1. EDI
0% 02 89%
27% 33%
42% 40% 35%
42%
37% 42%
54% 54% 53% 55%
60% 85%
91% 90% 92% 92% 92% 88% 94% 93% 94%
98% 96%
03 04 05 06 07 08 09 10 11 12 13 14
Year 20%
40% 60% 80% 100% 120%
IT Capabilities Necessary Element of 3PL Expertise Shippers Satisfied with 3PL IT Capabilities $
2015 Third-Party Logistics Study
www
.3plstudy
Source: a) 2014 18th Annual 3PL Study and © 2013 Armstrong & Associates, Inc. The current status of the global 3PL industry
continues to be affected by a number of factors. Principal among these are the levels of economic activity in regions and countries of the world and the volatility or lack thereof. Also, the supply of asset-based capacities of various types, along with the underlying demand for services related to the use of those assets, has signiicant impacts on the pricing and availability of capacity to meet the needs of customers.
Although there are other factors of concern, there are a growing number of examples of modal substitution, typiied by shippers who have shifted freight movements from air to ocean. Aside from more positive business environments in certain geographies, industry verticals and niche types of services, the global logistics industry is one that is currently not without its challenges.
Results of this year’s Annual 3PL Study again document the evolving logistics marketplace in which 3PLs have continued to enhance their ability to drive innovation and create value for their customers and clients. At the same time, those same shipper customers have continued in many ways to become more proicient buyers and managers of 3PL services.
Although 3PL providers generally will provide a more positive evaluation of themselves than will their customers, the 2015 study again conirms that both 3PLs and customers view their relationships as successful.
The results and findings of the 2015 19th
Annual Third Party Logistics Study provide current perspectives on the nature of these relationships, why they are generally successful and some of the ways in which they could be improved. Aside from these generally positive perspectives, discussions at some of the research workshops this year suggested that management structures in many shipper organizations have not yet been transformed to relect how core the supply chain is to the business. One participant indicated that many legacy supply chains exhibit poor leadership and little inertia for change. While there were many compliments relating to 3PL providers, the discussions suggested that the providers could beneit from becoming more innovative and moving away from legacy operations and systems.
Again this year, the generally less-than-exciting levels of global economic activity and the associated impacts on the demand and supply of logistics and 3PL services have affected
the progress toward the advanced end of the maturity model for shipper-3PL relationships. The details discussed in this section provide further perspectives on where progress is being made and where it may be constrained.
While some of these indings are consistent with recent Annual 3PL Studies, readers are cautioned when comparing results from this year with those in past reports as a result of signiicant changes in this year’s respondent base. Please see the About the Study section of this report for more information on the research process and the study respondents.
3PL Usage Reflects Global Trends
Global markets continue to be impacted by volatility and low-growth in many economies throughout the world, thus driving highly variable and sometimes sluggish or neutral demand for outsourced logistics services.
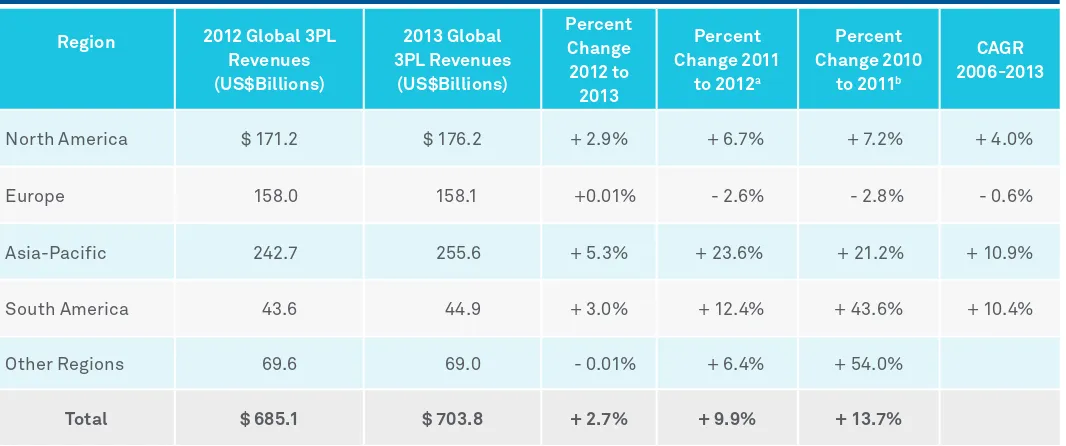
Figure 1 provides global 3PL revenues by region for 2012 and 2013 from Armstrong & Associates, along with a summary of percentage changes in these revenues reported for 2012-2013 and the two previous years, and it includes compounded annual growth rates (CAGR) by region for 2006 to 2013.
Figure 1: Global 3PL Revenues Rise Only Modestly for 2012-2013
11 Current State of the 3PL Market
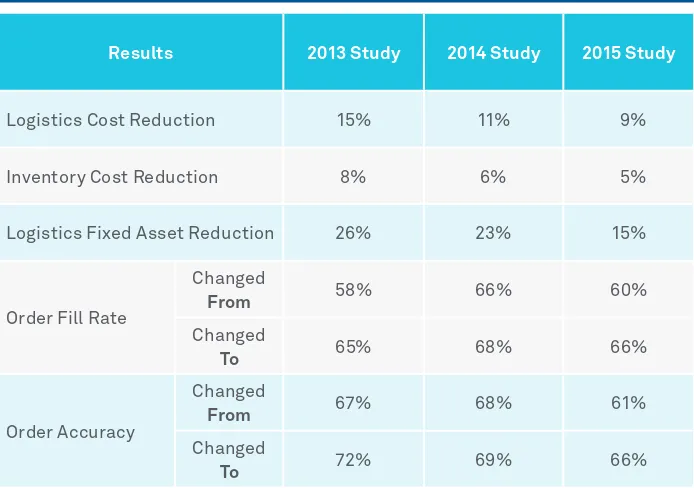
Figure 2: 3PL Services Deliver Measurable Benefits While the CAGR figures for Asia-Pacific
and South America are both slightly above 10%, results for North America are 4% and those for Europe are slightly in the negative. Looking at the percentage changes in global 3PL revenues by region from 2012 to 2013, and particularly in comparison with the percentage changes reported in the two previous years, it is clear that growth rates are moderating signiicantly over time. Overall, it appears that the “cooling off” of many global economies may be responsible for the somewhat slower or limited growth in 3PL revenues throughout the regions of the world.
Shipper Spending Patterns on
Logistics and 3PL Services
According to this year’s study results, shippers report an average of 36% of their total logistics expenditures are related to outsourcing. This compares with an average of 44% reported last year and 42% reported in the previous year. Total logistics expenditures include transportation, distribution, warehousing and value-added services. Considering Armstrong & Associates’ estimated and projected global 3PL revenues cited in Figure 1, these percentages support the notion that the slowing global economic conditions have had a negative impact on aggregate shipper spending on 3PL services as a percentage of total logistics expenditures.
Increased Outsourcing Continues to
Outpace Insourcing
Two consistent observations over the past several years of Annual 3PL Studies are that some customers will report having increased their use of outsourced logistics services and others will indicate a return to insourcing some or all of these same services. (Movements to either increased or decreased use of outsourcing may be measured in terms of funds expended on outsourced logistics services, percentage
of overall logistics spending represented by outsourcing or number of activities outsourced.)
• Outsourcing: 67% of shippers indicate
they are increasing their use of outsourced logistics services this year, which compares with 72% reported last year. In comparison, 86% of 3PL providers agreed that their customers showed an increase this year in their use of outsourced logistics services. These igures are consistent with the slower growth of overall revenues in the global logistics marketplace, as discussed above.
• Insourcing: Generally, returning to insourcing remains less prevalent, as 26% of shippers report they are returning to insourcing at least some of their logistics activities. In comparison, 37% of 3PL providers agree that some of their customers are returning to insourcing.
• Reducing or Consolidating 3PLs: The
ongoing trend toward strategic sourcing by many shippers is evident in the number who report that they are reducing or consolidating the number of 3PLs they use—an average of 53%. This is consistent with previous years’ indings and provides continuing evidence that more than half of shippers place a priority on tightening up their rosters of 3PLs.
One observation that has been consistent for the past several years is that the percentage of shippers reporting they increased their use of outsourced logistics services has outstripped by 3:1 the percentage of shippers indicating they have returned to insourcing many of their logistics activities.
Source: 2015 19th Annual Third-Party Logistics Study.
Results 2013 Study 2014 Study 2015 Study
Logistics Cost Reduction 15% 11% 9%
Inventory Cost Reduction 8% 6% 5%
Logistics Fixed Asset Reduction 26% 23% 15%
Shipper Experiences with 3PLs:
Measures of Success
Once again, a distinct majority (92%) of shippers report that their relationships with 3PLs generally have been successful. Interestingly, but predictably, an even higher percentage of 3PLs (98%) say their relationships with shippers have generally been successful.
Figure 2 summarizes the tangible beneits
shippers report from their use of 3PL services, including three example types of cost reduction, and also average improvements in order ill rate and order accuracy. The average logistics cost reduction reported by shippers was 9%, the average inventory cost reduction was 5%, and the average ixed logistics cost reduction was 15%. This is the second consecutive year in which each of these percentage igures was down modestly from those reported in the previous year’s study.
Again, this is not unexpected, because both shippers and 3PLs have been working earnestly to attain these eficiencies. It now appears that
the magnitude of annual savings of these types has begun to taper off somewhat. This idea is supported by the results of a discussion held during the London workshop around the assertion that many big customers already have taken signiicant cost out of their supply chains.
3PL Services Deliver Measurable
Benefits
Also highlighted in Figure 2 are the changes in order ill rate and order accuracy that shippers attribute to their use of 3PL services. These percentages have remained somewhat stable over the past several years’ studies, and they also validate continuing improvements that result from the use of 3PL services. This year, 70% of shipper respondents report their use of 3PLs has led to year-over-year incremental beneits, while 98% of 3PLs say their customers’ use of 3PL services has led to year-over-year beneits. The 70% igure is up from a reported 55% last year and 56% the year before.
Shifting Expectations in
Shipper-3PL Relationships
In the six years that this study has included both shippers and 3PL providers in the survey process, researchers have observed that in most instances 3PLs rate their capabilities higher than do shippers. Conversely 3PLs tend to have a lesser perception of problems in relationships, etc. Although there are likely a number of reasons for this disparity, the study is always seeking to better understand how well aligned shippers and providers are on matters of importance to the overall relationship.
One attribute that shows a degree of alignment is that of openness, transparency and effective communication in 3PL-customer relationships. The 2015 3PL Study showed that 73% of shippers and 77% of 3PLs are satisied that they have received open, transparent and effective communication from their partners.
An area in which a difference exists between shipper and 3PL provider customer ratings is that of agility and lexibility to accommodate current and future business needs and challenges. This year 99% of 3PLs feel their customers expect these qualities from them, while 75% of shipper respondents agree that their 3PLs are suficiently agile and lexible. This continuing gap suggests a further need for improvement.
An interesting comment made during the London workshop was that companies with the most responsive supply chains were either new companies, or ones that were vertically integrated and had recently redesigned or significantly transformed their existing supply chains. Also, a discussion thread in the workshop held in San Francisco focused on the extent to which “big box” stores and their supply chain practices were “changing the customer landscape.” Speciically, 3PLs serving these types of accounts need to be very diligent about understanding, complying with and meeting stated customer expectations, while also being suficiently agile and lexible to execute as lawlessly as possible.
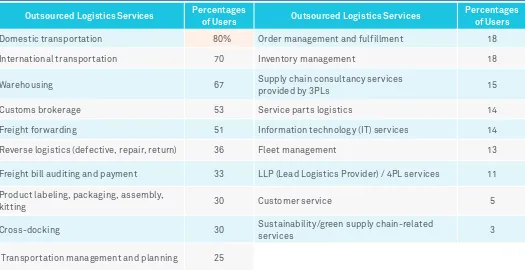
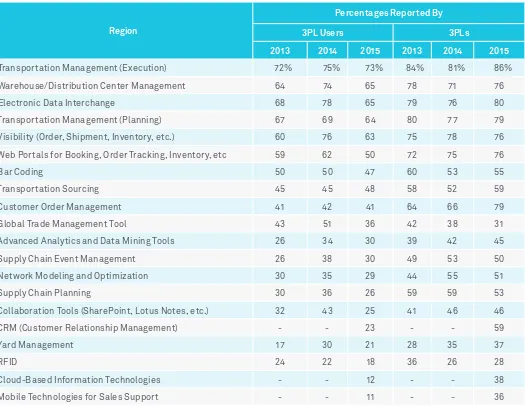
Figure 3: Shippers Continue to Outsource a Wide Variety of Logistics Services
For the past several years, this report has addressed issues relating to the use of “gainsharing” and “collaboration” in shipper-3PL relationships. We consider both of these concepts legitimate and useful elements of well-structured shipper-3PL relationships:
• “Gainsharing” between 3PLs and shippers:
This year, 41% of shippers report they have engaged in gainsharing arrangements with their 3PLs, while 58% of 3PL provider respondents indicate they have engaged in gainsharing with customers. As stated in last year’s report, our opinion is that while the use of gainsharing is a valuable element of many shipper-3PL relationships, there are other relationships where some variation of a more traditional “fee for service” model is preferred. Although this has not been formalized into a research question, our hypothesis is that the use or non-use of gainsharing would be related to whether customers prefer more tactical/operational relationships with their 3PLs or relationships that are more strategic in nature.
• Interest in collaborating with other companies, even competitors, to achieve logistics cost and service improvements: 39% of this year’s shippers agree that they are collaborating with other companies to achieve logistics cost and service improvements. This percentage is down from 48% reported last year, while the percentage of 3PL providers in agreement is a reported 72%. As with gainsharing, it is likely that this approach is more suitable in certain types of shipper-3PL relationships than in others. Also noted in the workshops held this year: There continues to be a reticence on the part of both shippers and providers to share relevant information that is central to the process of taking the greatest advantage of their relationships and the opportunity to collaborate effectively.
What Shippers Outsource and What
3PLs Offer
Figure 3shows the percentages of shippers outsourcing speciic logistics activities. While there are similarities with some of the results reported in recent years, this year’s data also includes a number of instances that suggest
Source: 2015 19th Annual Third-Party Logistics Study.
Outsourced Logistics Services Percentages
of Users Outsourced Logistics Services
Percentages of Users
Domestic transportation 80% Order management and fulfillment 18
International transportation 70 Inventory management 18
Warehousing 67 Supply chain consultancy services
provided by 3PLs 15
Customs brokerage 53 Service parts logistics 14
Freight forwarding 51 Information technology (IT) services 14
Reverse logistics (defective, repair, return) 36 Fleet management 13
Freight bill auditing and payment 33 LLP (Lead Logistics Provider) / 4PL services 11
Product labeling, packaging, assembly,
kitting 30 Customer service 5
Cross-docking 30 Sustainability/green supply chain-related
services 3
modest declines in the percentages of shippers indicating they outsource certain activities and processes. Also, one perspective that received attention in this year’s workshops was that there is continuing evidence that, in many instances, shippers will choose not to outsource operations where they feel they can serve their customers better.
Again with this year’s study, the most frequently outsourced activities tend to be those that are more transactional, operational and repetitive. These include domestic and international transportation (80% and 70%, respectively), warehousing (67%), customs brokerage (53%) and freight forwarding (51%). With the exception of domestic transportation, these percentages are several points lower than those reported in the previous study.
The less frequently outsourced activities indicated in Figure 3 continue to be those that are more strategic, customer facing and IT intensive. Examples include: order management and fulillment, inventory management, supply chain consultancy services, IT services, LLP/4PL services and customer service. Generally, these
percentages also are lower than those reported in the previous study.
Among the many topics of interest during workshops was that there appears to be an evolution of demand for and increasing acceptance of the concept of 4PL services (broadly defined). Although there are a growing number of companies (or divisions of companies) that are viewed as commercial providers of 4PL services, the types of services that would be offered by a 4PL are also the same types of services that should be evident in any well-run customer supply chain organization.
Although it is not fair to draw conclusions based on one year’s supply of new survey results, the analysis looks carefully at the reasons why shippers generally reported lesser percentages in terms of utilizing many of the logistics services and processes than they did in the previous year’s study. Among the reasons that may bear some relevance are: impacts of lagging global economies; decisions made by providers of logistics services that have impacts on pricing and availability of those services; responses to shippers feeling pressure to reduce
costs wherever and whenever possible; and changing purchasing patterns among shippers. Also, the composition of this year’s survey respondents may also have some impact on the results included in Figure 3.
3PL’s IT Capabilities: What are the
Front-Running Types of Information
Technologies?
to processes that are more strategic and customer facing.
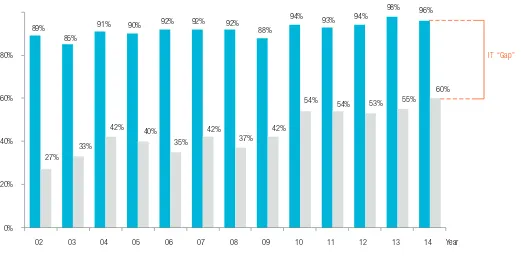
For 13 years this study has tracked measurable differences between shippers’ opinions as to whether they would agree that information technologies are a necessary element of 3PL expertise and whether they are satisied with their 3PLs’ IT capabilities. We have referred to this as the “IT Gap.” While Figure 5 reveals that over the long term this gap has narrowed signiicantly, recent years’ data suggests there may be continued convergence occurring between shipper ratings of the necessity of capable IT-based services from 3PLs and their
current satisfaction with those services. As indicated, 96% of this year’s user respondents agreed that IT capabilities are a necessary element of 3PL expertise and 60% agreed they were satisied with 3PL IT capabilities.
Although last year’s report suggested that the “(IT) gap appears to have largely stabilized,” this year’s study continues to look for reasons that may explain why this gap continues to narrow. As explained later in this report, a special topic within this year’s study is CRM (Customer Relationship Management) and the use of mobile and cloud technologies by 3PLs.
Key Takeaways
Key indings about the Current State of the Market for the 2015 19th Annual 3PL Study
include:
• The continuing uncertainty and volatility of global economic conditions has impacted global markets for 3PL services and related industry revenues. Armstrong & Associates reported aggregate global revenues for the 3PL sector grew by 13.7% from 2010 to 2011, 9.9% from 2011 to 2012 and only by 2.7% from 2012 to 2013.
• Shippers report an average of 36% of their total logistics expenditures are related to Figure 4: Shippers Still Focus Attention on Execution-Oriented 3PL IT Capabilities
Source: 2015 19th Annual Third-Party Logistics Study.
Region
Percentages Reported By
3PL Users 3PLs
2013 2014 2015 2013 2014 2015
Transportation Management (Execution) 72% 75% 73% 84% 81% 86%
Warehouse/Distribution Center Management 64 74 65 78 71 76
Electronic Data Interchange 68 78 65 79 76 80
Transportation Management (Planning) 67 69 64 80 77 79
Visibility (Order, Shipment, Inventory, etc.) 60 76 63 75 78 76
Web Portals for Booking, Order Tracking, Inventory, etc 59 62 50 72 75 76
Bar Coding 50 50 47 60 53 55
Transportation Sourcing 45 45 48 58 52 59
Customer Order Management 41 42 41 64 66 79
Global Trade Management Tool 43 51 36 42 38 31
Advanced Analytics and Data Mining Tools 26 34 30 39 42 45
Supply Chain Event Management 26 38 30 49 53 50
Network Modeling and Optimization 30 35 29 44 55 51
Supply Chain Planning 30 36 26 59 59 53
Collaboration Tools (SharePoint, Lotus Notes, etc.) 32 43 25 41 46 46
CRM (Customer Relationship Management) - - 23 - - 59
Yard Management 17 30 21 28 35 37
RFID 24 22 18 36 26 28
Cloud-Based Information Technologies - - 12 - - 38
17 Current State of the 3PL Market
Figure 5: The “IT Gap” Exhibits Continuing Convergence outsourcing compared with an average of
44% reported last year. These igures help to explain how the slowing global economic conditions have impacted aggregate shipper spending on 3PL services as a percentage of total logistics expenditures.
• This year’s Annual 3PL Study reports that 67% of the shippers surveyed are increasing their use of outsourced logistics services. Only 26% report a return to insourcing many of their logistics activities. This ratio of approximately 3:1 (67% increased outsourcing divided by the 26% that returned to insourcing) has been apparent for the past several years. Also, 53% of shipper respondents indicate they are reducing or consolidating the number of 3PLs they use.
• Shippers report an average logistics cost reduction of 9%, an average inventory cost reduction of 5% and an average ixed logistics cost reduction of 15%. These igures are down modestly from those reported in last year’s study, but conirm the reasons why 92% of
shippers report that their relationships with 3PLs generally have been successful.
• In the survey, 73% of shippers and 77% of 3PL providers indicate they are satisied with the openness, transparency and good communication in their relationships, and 75% of shipper respondents judge their 3PLs as suficiently agile and lexible to meet future business challenges.
• Involvement in “gainsharing” arrangements with their 3PLs was reported by 41% of shippers, and 39% indicated involvement in collaboration with other companies, even competitors, to achieve logistics cost and service improvements. Variances in these results over the years suggest that, rather than relecting levels of maturity, these approaches simply fit better with some shipper-3PL relationships than they do for others.
• Consistent with past studies, transactional, operational and repetitive activities tend to be the most frequently outsourced, while
those that are strategic, IT-intensive and customer facing tend to be outsourced to a lesser extent. Also, for many of the logistics activities and processes of interest to this study, this year’s percentage of shippers indicating they outsource those activities decreased by a few points.
• For the past 13 years, this study has been tracking the “IT Gap,” which is deined as the difference between the percentage of shippers indicating that IT capabilities are a necessary element of 3PL expertise (96% in the current study) and the percentage of the same shippers who agree that they are satisied with 3PL IT capabilities (60%). The results from this year’s study again conirm that the IT Gap continues to narrow to some extent, and so future research will place a priority on providing further explanations and rationale for any apparent convergence.
Today’s retail landscape is evolving rapidly, adjusting to changes in consumer demand as well as technological innovations. Now more than ever consumers expect an always-on, always-open shopping experience, and they are looking for seamless interaction across retail sales channels. To meet those expectations, retailers need to have a robust fulillment strategy and a highly detailed, integrated approach.
And there are more consumers than ever as changing economics are affecting the face of retailing. Within the United States, household net worth has been improving, increasing 13.4% in 2013 after a 9.5% rise in 2012. Globally, the middle class is growing and is on track to more than double in size to 4.9 billion by 2030 from 2 billion today.
The growth of the middle class means consumers have more discretionary income. To capture these new and growing spenders, retailers are gradually transitioning their offerings to match the expectations of what, when and where customers want to shop. To succeed in this changing landscape, retailers are enhancing the consumer-facing side of their operations, requiring a redesign of their supply chain and testing new fulfillment options to keep up with rapidly evolving consumer expectations.
The customer-facing operations of retailers are emphasizing consumer engagement and turning to tailored marketing and promotions, such as customized messages pushed to shoppers’ mobile devices based on their location and product suggestions inluenced by their previous shopping history. As a result, retailers are trying to be more dynamic
than their competition and creating a unique customer experience.
But respondents said they have found customers’ expectations differ based on their geography. What meets customers’ needs in one area may not in another, so the ability to differentiate offerings by geographic location can improve customer service while also requiring greater flexibility across global operations..
So while retailers’ sales and marketing departments are promoting the tailored, customized content, the fulillment and logistics divisions have to ensure a seamless experience for the customer. As consumers become more exposed to improved offerings from retailers, they begin to expect more in terms of when and how they can get their products delivered. And while several companies are blazing a trail with new fulillment models, others are trying to determine a customer expectation versus a customer requirement.
To succeed in this changing landscape, retailers are enhancing the consumer-facing side of their operations, redesigning their supply chain, testing new fulillment options and focusing on a specialized model with a speciic purpose in mind.
Changes to the Supply Chain
Enabling the growth of the omni-channel network is a priority for retailers, and they are testing a wide range of cross-channel fulfillment options. However, nearly one-third of the retailers participating in the study said they are not prepared to handle omni-channel retailing. Figure 6 shows that only 2% of respondents rated themselves as high performing in the omni-channel space, while 10% ranked themselves as eficient. The highest percentage—33%—said they had no capability and 26% said they are inconsistent.
For many companies, the issue is their existing infrastructure simply cannot support a true omni-channel. Previously, retailers created dedicated e-commerce distribution centers that were designed to pick, pack and ship partial shipments. The rest of their distribution centers were for full shipments, and, in the past, companies rarely shipped directly to consumers from the store.
Today, retailers are trying to better utilize space and creating more in-store integration with online channels, using bricks-and-mortar stores as fulillment centers for internet shopping sites and to facilitate Web order pickup in which the
Figure 6: Omni-Channel Supply Chains Remain Immature
Source: 2015 19th Annual Third-Party Logistics Study.
19 The New Landscape of Omni-Channel Retailing
How prepared do you think your organization is to handle omni-channel retailing?
29%
26% 10%
2%
33%
packages to shoppers nearby in exchange for a discount on their bill.
Amazon has made headlines by testing drones for faster delivery of goods. The drones can carry packages weighing about ive pounds to locations within a one-mile radius of an Amazon fulillment center. The online retailer has also installed delivery lockers in grocery, convenience and drugstore outlets at several locations in the U.S. and the United Kingdom. The lockers hold packages weighing less than 10 pounds and customers can pick up their deliveries at their convenience, eliminating the chance of missing a delivery or theft from their doorsteps. In the Los Angeles and New York metropolitan areas, Amazon is collaborating with the U.S. Postal Service to provide Sunday package delivery.
Yet with new opportunities come new challenges. Retailers have the opportunity to provide customers with more options than ever before, but they also have to ensure lawless execution. To support the rollout of the omni-channel consumer experience, retailers are investing in new technologies, allowing them to make decisions based on real-time information from stores.
Varied Fulfillment Options
While respondents are still developing their omni-channel supply chains, they are attempting to provide flexible fulfillment options and testing new approaches, including in-vehicle pickup, warehouse pickup and buy-online-and-pick-up-in-an-hour options.
Figure 7 shows that among respondents, 36% currently offer order-online-and-pickup-at-the-warehouse, 29% allow consumers order in store for home delivery, 22% allow mobile orders to be picked up at the warehouse and 20% offer warehouse pickup of orders placed in the store.
Nearly half of respondents, as shown in
Figure 8, said they are not testing new fulfillment strategies, but 16% are either utilizing or considering home delivery from local stores, 15% either do or plan to offer Sunday delivery, 12% are either using or investigating customer delivery in which an in-store shopper delivers goods, and 11% are using or interested in locker pickup. A smaller number—4%—are considering drone delivery and bike/messenger delivery.
Wal-Mart is among those looking to tap into shoppers who are already in the store to deliver products to customers who ordered online. In-store shoppers would inform the retailer of their destination and volunteer to deliver customer shops online then picks the package
up at the store. Ofice Depot, for example, has introduced an updated Web order, in-store pickup program called “Buy Online Pick Up in an Hour” whereby online orders at OficeDepot. com are ready for pickup in about 60 minutes. Ship-to-store options have the potential to reduce the retailer’s transportation costs and possibly spur additional in-store sales made when shoppers pickup an online purchase.
Yet in spite of the beneits, respondents said most companies don’t have the space to run a pick-and-pack operation from the store. They said to get to a true omni-channel, they would have to dismantle their current network, which would be costly.
Companies have to determine how much of their current infrastructure they are willing to take apart to build new delivery channels. Many are taking a “wait and see” approach to determine which customer requirements stick and which are a fad. Consumer goods companies are also questioning whether or not it makes sense for them to create their own fulillment solutions or if they should partner with another type of service provider who can handle the services for them. This may create additional opportunities for 3PLs going forward.
Figure 7: Respondents Offer a Variety of Cross-Channel Fulfillment Options
Source: 2015 19th Annual Third-Party Logistics Study.
Do you offer/enable cross-channel fulfillment?
0 20 40 60 80 100 120 140
# of Respondents Order Online – Pickup at warehouse
Order InStore – Deliver to home Mobile Order – Pickup at warehouse Order InStore – Pickup at warehouse Order Online – Pickup In store Mobile Order – Pickup In store Order Online – In-vehicle pickup
The Role of Information Within the
Supply Chain
With timely information, retailers are focusing on the retail shelf and working to speed deliveries to the store to keep product in supply. Now planning cycles can take place hourly or more frequently, and the total supply chain response time takes place in hours or days—a transition from the old supply chain model in which retailers focused on replenishing the distribution center with fulillment at the retail level taking days or weeks.
Technology in retail enables the retailers to analyze consumer data, track products and reduce operational cost while also serving as a tool for product promotions through various digital platforms. Retailers said they are trying to igure out how to create increased visibility and transparency to profitably manage inventory and delivery.
The visibility and accuracy of inventory data is crucial. Figure 9 shows that to better manage inventory and product delivery, respondents are investing in such technology, including warehouse management systems (58%), enterprise resource planning software (54%),
transportation management systems (54%), supply chain visibility (43%) and warehouse management system add-ons, which include labor management, analytics, slotting organization, etc. (33%).
About one-ifth of respondents—21%—have also invested in RFID technology, which can save shoppers time and also reduce inventory levels as a result of real-time information about the movement of goods. Products with RFID tags need not be scanned separately, resulting in shorter checkout lines and less time spent at the cash register. For retailers, RFID captures and stores information over time enabling them
to trace the product’s origin and differentiate products from their competitors.
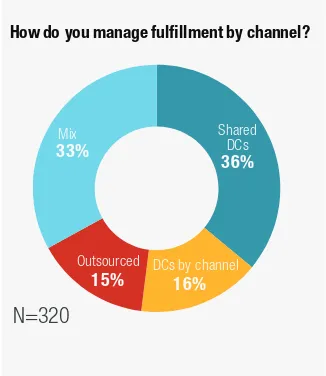
Respondents said the physical and digital information necessary to successfully manage omni-channel offerings has been met with varied success. Warehouses operate in an integrated fashion, yet many require manual movements of digital inventory and information across systems or tools. Figure 10
demonstrates that when it comes to managing fulillment by channel, 36% of respondents said they utilize shared distribution centers, 16% have distribution centers by channel, 15% outsource and 33% use a mix.
21 The New Landscape of Omni-Channel Retailing
Figure 8: Shippers are Testing and Using a Variety of Fulfillment Options
Source: 2015 19th Annual Third-Party Logistics Study.
Which of the following fulfillment strategies are you utilizing/piloting/considering?
149
Figure 9: Companies are Adapting with Integrated Technologies
Are you making/have you already made any of the following technology investments?
0
However, fulilling orders across multiple channels can create issues. Respondents were most concerned with order lexibility (last-minute changes to either the quantity, shipping address or shipping speed), system integration and inventory visibility, accuracy and control
(Figure 11).
As online shopping continues to grow, shippers are left trying to igure out how to merge information to consolidate shipments and increase eficiency. During the London workshop, a respondent shared the story of one DHL truck showing up at a business to deliver business-to-business orders while another arrived to deliver packages to employees from their personal orders. Technology that creates additional visibility is a likely solution.
The rise of new technologies is affecting retailers’ perspectives. Digital promotions, mobile promotions and digital wallets are impacting retailers the most. These technologies give retailers greater insight, and therefore the ability to customize solutions. For example, digital wallets combine the functionality of mobile payments with digital couponing, and digital storage of various cards and loyalty
membership programs into one solution, enabling retailers to acquire more information about their actual and potential customers compared to traditional payment methods.
Because retailers are increasingly dependent on technology for real-time visibility into operations to track products when they leave the manufacturing facility, throughout the supply chain and until they arrive at the inal point of sale, retailers are gradually moving all of their platform-based solutions to the cloud. This enables retailers to process large amounts of customer data faster, better match customers’ demands with a sales season and provide personalized solutions, not only in what customers buy and how they buy it, but also in how they receive it.
By obtaining and transmitting information more eficiently and in new ways, retailers and shippers are able to offer more fulillment options, giving customers the option of picking products up in the store or the warehouse or having them delivered to their store. These technologies, along with others, enable the concept of mass customization, which has been
of growing interest to both manufacturers and retailers.
Per sonalized Produc t s and
Experiences
Retailers are focusing more on consumer engagement in response to customers’ targeted, time-eficient, needs-based trips while also seeking to develop more proitable, complex solutions offering real value to shoppers.
Custom solutions are becoming prevalent in a wide variety of retail operations. For example, retailers are now offering home décor product selection and installation services ordered in a single touch. In apparel, shoe manufacturer New Balance allows customers to create custom shoes either online or in its lagship Manhattan store. Once the shopper designs his or her shoe, it is manufactured at a U.S. facility within six to 10 business days and shipped to the customer.
With mobile technologies, retailers can send a mobile coupon for a product that complements other items on the customer’s shopping list or inform customers about special offers based on Figure 11: Fulfilling Orders Across Multiple Channels Creates Certain Issues
Figure 10: Respondents Use a Mix of Solutions to Manage Fulfillment
How do you manage fulfillment by channel?
N=320
Outsourced DCs by channel Shared
DCs
What is your largest issue in fulfilling orders across multiple channels? (select top 3)
116
Issues in Omni Channel by # of Respondents
Picking & waving logic Long-term DC leases Expedited delivery Return management Pick/Pack ef f iciency Ef f iciency
Technology in retail enables the retailers to analyze consumer data analysis, track products and reduce operational
cost… while at the same time serving as a tool for product promotions through various digital platforms
Products attached with RFID tags need not be scanned separately
Savings in customer’s time due to shorter checkout lines and less time spent at the cash register
RFID captures and stores information over time enabling retailers to trace the origin of products and
differentiate products from their competitors
Convenient replacement for traditional ‘paper price’ tags and enabling retailer to change prices quickly
Elimination of customers’ complaints about incorrect product prices
Enables store staff to focus on other retailing activities
Enables the retailer to process large amounts of customer data in real time to provide
them with personalized solutions
Enables retailers to match customers’ demand with their sales season
Retailers gradually moving all their platform-based solution to the cloud
Enables retailers to collect sales data at the point of sale (POS) instead of the traditional cash register
Provides store assistants with the opportunity to spend more time with customers and also influence
their purchase decisions
Cheaper to equip assistants with mobile POS rather than to move or build more fixed POSs
Combines the functionality of mobile payments with digital couponing, digital storage of various
cards and loyalty membership programs into one solution
Enables retailers/merchants to acquire more information about their actual and potential
custom-ers (such as customer’s e-mail address) as compared to traditional payment methods
Intensive use of social media platforms such as Facebook, Twitter, Pinterest, etc. to promote the
company’s products and initiatives
Loyalty programs have gained acceptance amongst retailers allowing them to target customers
through relevant messages based on analyzed card data
Digital coupons are becoming increasingly popular with the customers offering them the flexibility to
store coupons on their smartphones and use while shopping
Retailers can send a mobile coupon for a product that complements other products on the customer’s
shopping list
In-store mobile promotions enable the retailers to inform customers about special offers or complements
depending upon the customer’s location in the store
Promotion of in-store locations through installation of interactive touchscreens that customers with
smartphones can connect to and search for particular products
RFID
Electronic Price
Tags
Mobile
Promotions
Cloud
Computing
Mobile Point
of Sale
Digital Wallets
Digital
Promotions
their location in the store. Mobile technologies also allow in-store promotions through interactive touch screens that customers with smartphones can connect to and search for particular products. Over one-third of respondents—33%—said they have invested in mobile apps.
Opportunities and Challenges
Customer service continues to be the driving force behind shippers’ omni-channel efforts. As seen in Figure 13, about one-third of respondents—32%—listed customer service as the top reason they are investing inomni-channel fulillment; 23% cited service levels; 11% listed freight costs.
While technology is making it easier for retailers to allow consumers to buy when and where they want and choose how the order is fulilled, the number of order channels multiplied by the number of delivery options creates a complex operating environment for shippers and logistics providers.
Moreover, shoppers expect ease in returns, and data shows that the most proitable online customers purposely order multiple items and
return 60% to 80% of what they order. This creates additional challenges surrounding logistics and inventory as distribution centers may restock an item then get a lood of returns resulting in overstocks. An even greater challenge can come when online shoppers return an item to a store, which then has to be returned to a distribution center. Respondents admitted that returns are often an afterthought, and this is an area where retailers and shippers will need to focus on in the future.
23 The New Landscape of Omni-Channel Retailing
Omni-Channel’s Potential Dividends
Many retailers are already making investments within the omni-channel space, but the question remains: Are customers willing to pay or will this become a cost of doing business? Is there a point when it becomes too expensive, too risky and of little value for retailers to build their own capability? For retailers and shippers, there has to be some type of revenue to justify the service. It may be that omni-channel fulillment becomes the inal straw that forces companies to merge operations versus maintaining competing supply chains, especially for last-mile fulillment.• The visibility and accuracy of inventory data is crucial, yet the physical and digital information necessary to successfully manage omni-channel offerings are met with varied success. Warehouses operate in an integrated fashion, yet many require manual movements of digital inventory and information across systems or tools. When it comes to managing fulillment by channel, 36% of respondents said they utilize shared distribution centers, 17% have distribution centers by channel, 15% outsource and 33% use a mix.
• The survey data shows that omni-channel supply chains are still maturing and retailers are attempting to provide lexible fulillment to customers. Nearly half of respondents said they are not testing new fulillment strategies, but 16% are either utilizing or considering home delivery from local stores, 15% do or plan to offer Sunday delivery, 12% are either using or investigating customer delivery in which an in-store shopper delivers goods, and 11% are using or interested in locker pickup. A smaller number—4%—are considering drone delivery and are either utilizing or testing bike/messenger delivery.
• Companies see the advantage of integrated technologies and are adapting as necessary. Respondents are investing in such technology, including warehouse management systems (58%), enterprise resource planning software (54%), transportation management systems (54%), supply chain visibility (43%) and warehouse management system add-ons (33%).
Omni-Channel Key Takeaways
• Retailers are working to provide consumerswith an always-on, always-open shopping opportunity. Shoppers are looking for a seamless experience across their retail sales channels. Thus retailers need to have a robust fulillment strategy and a detailed, integrated approach to meet consumers’ needs.
• Customer service continues to be the driving force behind omni-channel efforts. About one-third of respondents—32%—listed customer service as the top reason they are investing in omni-channel fulillment; 23% cited service levels; 11% listed freight costs.
• Companies are investing in technology that gives them greater customer insights and enhances shoppers’ experiences, with 33% of respondents saying they’ve invested in mobile apps and 21% saying they’ve invested in RFID.
Figure 13: Priorities in Omni-Channel Fulfillment
Source: 2015 19th Annual Third-Party Logistics Study.
What is your priority in omni- channel fulfillment?
32%
Priority in Omni-Channel by % of Respondents
25 The New Landscape of Omni-Channel Retailing
Omni Channel
–
Creating a Seamless Customer Experience
What is driving this trend
?
Immaturity of supply chains for omni-channel operations
Some info in the above chart from: The Consumer Driven Supply Chain: IBM
Retailers are venturing into new markets and store formats while integrating their in-store and digital offerings to cater to the demand of several consumer groups
How to operate?
Where to sell?
How to sell?
Focus towards consumer engagement and cost efficiencies is driving...
Customer service continues to be the driving force behind shippers’
omni-channel efforts
Personalized products
Focus on consumer engagement
Reduction in store size
Greater utilization of store space
11
10
7
Customer
service
Service
levels
Freight
costs
Order cycle
time
Fill rate
Shift from the traditional supply chain
model to a modern, more agile model
Total response time from order to retailer DC in weeks or days
Traditional model Modern model
Quality defect per million at the plant
Forecast accuracy in replenishing the
retail DC
New product design, manufacture and delivery
Total supply chain response time from demand estimation to shelf delivery in days or hours
Quality defects per million at the retail shelf
Zero stock outs on the shelf
Speed to deliver innovation to the shelf
No capability
Inconsistent
Competent
Efficient
performing
High
33
26
29
10
How prepared do you think your organization is to handle omni-channel retailing?
Largest issue in fulfilling orders
across channels
Order Flexibility
System Integration
Inventory Visibility
Inventory Accuracy
Inventory Control
Will shippers focus on developing their own innovative solutions or will they turn to 3PLs to help them determine
how to fulfill customer demands?
www
.3plstudy
.com
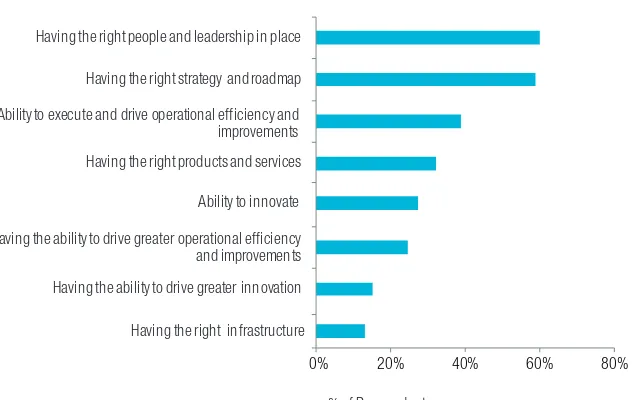
development, they struggle to grow. Figure 15 shows that organizations value operational execution, the ability to drive growth, and people management and development.
When a company aligns its talent strategy to its business strategy, it is more likely to achieve its strategic objectives, perform better in the market and retain high-performing individuals. However, a business strategy simply details where the company wants to go. Getting there takes people. To align the two, management can ask themselves the following:
• What are the top three to ive organizational goals in the next ive years?
• What speciic objectives will help to support those goals?
• What are the talent implications of each objective?
• What key roles/skills are required for each talent implication?
• What external business issues, such as trends, economic realities and industry context, are shaping the business strategy?
• Can the needs be qualiied?
Yet, aligning business strategy with the talent strategy does not mean the talent strategy simply imitates business strategy. For example, if the business strategy is to drive innovation, HR does not innovate. Instead, HR provides the talent that will drive innovation. The talent strategy is designed to make the business strategy successful.
Demand for Supply Chain Talent
Aligning talent to business objectives helps a business get the proper talent focused on the right initiatives to drive the organization’s strategy and accelerate business outcomes. This is especially crucial in the supply chain, where estimated demand for supply chain professionals is expected to exceed supply by six to one.Figure 16 reveals that 44% of respondents said they are already having dificulty in inding or attracting talent. The average hiring growth rate within the supply chain industry is expected to be higher than the average growth rate across other occupations. Estimates show 60 million people will exit the industry by 2015, but there are only 40 million people to ill the gap. Strategic workforce management—the system
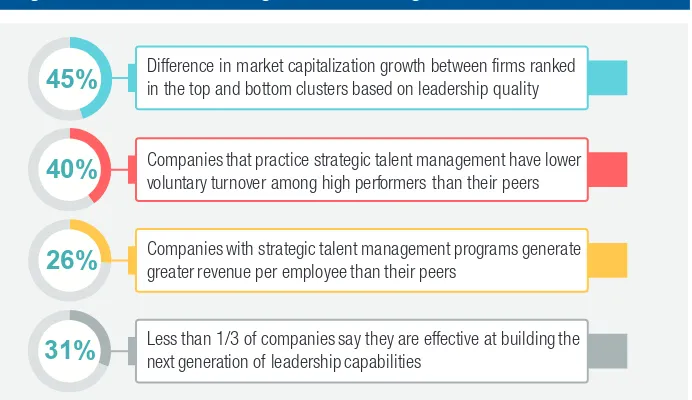
and processes by which leaders ensure they have the right talent in the right place and time—is relevant to everyone involved in the supply chain, be it an hourly employee or the company CEO. Figure 14 shows that companies that practice strategic talent management have 40% lower voluntary turnover among their high performers and generate 26% greater revenue per employee compared to their peers.
In most organizations, total human capital costs account for as much as 70% of operating expenses. To maximize the investment, key human resources leaders need to be close partners with the CEO to understand the strategy and direction of the company. About 60% of respondents, as shown in Figure 15, said having the right people and leadership in place is a primary driver of the organization’s success in the next ive years and roughly the same amount said success relies on having the right strategy and roadmap. Yet, less than one-third of companies said they are effective at building the next generation of leadership capabilities.
While the transactional nature of the logistics industry can limit the ability of individuals to think about strategic workforce planning, companies said that without people
Figure 14: The Benefits of Strategic Workforce Management
27 Strategic Workforce Management Throughout the Supply Chain