Tatu Jämsén
New energy analysis process for the design of building retrofits
Master’s Thesis Aalto University School of Engineering
Department of Energy Technology
Thesis submitted as a partial fulfilment of the requirements for the degree of Master of Science in Technology
Espoo, Finland 04.10.2016
Supervisor: Professor Risto Kosonen Advisor: Tuomas Laine, M.Sc. (Tech)
Diplomityön tiivistelmä
Tekijä Tatu Jämsén
Työn nimi Uusi energia-analyysiprosessi rakennusten korjaushankkeisiin Koulutusohjelma Energia- ja LVI-tekniikan koulutusohjelma
Pää-/sivuaine LVI-tekniikka/energiatekniikka Koodi Ene-58
Työn valvoja Professori Risto Kosonen
Työn ohjaaja(t) Diplomi-insinööri Tuomas Laine
Päivämäärä 04.10.2016 Sivumäärä 116 + 6 Kieli Englanti
Tiivistelmä
Rakennusten energia-analyysien ja simulointien merkitys on kasvanut merkittävästi viime vuosien aikana johtuen yhä monimutkaisemmista rakennuksista ja vaativammista rakentamismääräyksistä. Myös energiatehokas korjausrakentaminen on ajankohtainen tutkimusaihe, koska nykyisessä rakennuskannassa on huomattavaa säästöpotentiaalia sekä energiassa että kustannuksissa. Nykyinen rakennusten suunnittelukulttuuri ei kuitenkaan hyödynnä energia-analyysien täyttä potentiaalia. Tässä työssä kehitettiin ja testattiin uutta energia-analyysiprosessia rakennusten korjaushankkeisiin. Uuden prosessin tarkoitus on tukea korjaushankkeiden suunnittelua ja interaktiivista päätöksentekoa nykyistä tehokkaammin, sekä ohjata korjaushankkeisiin liittyvää tiedonkeruuta.
Kehitetty prosessi hyödyntää useita menetelmiä, mukaan lukien rakennusten tietomal-linnuksen, dynaamiset energiasimuloinnit, sekä herkkyys- ja epävarmuusanalyysit. Tietomallinnuksen käyttö mahdollistaa helpomman tiedon varastoinnin ja saatavuuden koko prosessin aikana ja mahdollistaa tarkkojen dynaamisten energiasimulointi-ohjelmien käytön. Herkkyysanalyysiä käytetään tiedonkeruun tukemiseen sekä apuna optimaalisen suunnitteluratkaisun löytämiseen. Epävarmuusanalyysin avulla pystytään tekemään paremmin perusteltuja päätöksiä. Prosessi on jaettu kahteen erilliseen vaiheeseen, joille on asetettu erilaiset vaatimukset lähtötietojen ja tietomallin tarkkuudelle. Molemmissa vaiheissa suoritetaan suuri määrä parametrisoituja simulointeja, mikä mahdollistaa herkkyys- ja epävarmuusanalyysien käytön. Kehitetty prosessi pohjautuu osittain aikaisempaan tutkimukseen. Tässä työssä on määritelty prosessin kulku, sekä uusina elementteinä lisätty epävarmuusanalyysin hyödyntäminen ja herkkyysanalyysin tulosten painotettu visualisointi.
Työ sisälsi myös kehitetyn prosessin ja sen ominaisuuksien testaamisen pilottikohteessa, minkä perusteella prosessin toimivuutta arvioitiin. Pilotoinnissa käytettiin RIUSKA-ohjelmistoa, koska sillä pystytään helposti simuloimaan suuria määriä parametrisoituja energiasimulointeja. Pilotoinnista saadut tulokset osoittivat, että kehitetyn prosessin avulla energiasimulointien tuloksia voidaan tehokkaasti hyödyntää suunnittelun ja päätöksenteon tukena jo projektin ensimmäisistä vaiheista lähtien. Epävarmuus-analyysillä oli merkittävä vaikutus lopullisen suunnitteluratkaisun valinnassa, ja se todettiin tärkeäksi osaksi prosessia. Vaikka prosessi vaatii vielä jatkokehitystä ja laajempaa pilotointia, voisi tämän kaltaisen energia-analyysiprosessin sisällyttäminen korjaushankkeiden suunnitteluun olla tärkeä askel kohti tehokkaampaa tapaa hyödyntää energiasimulointeja.
Avainsanat Energia-analyysi, energiasimulointi, rakennusten tietomallinnus, herkkyysanalyysi, epävarmuusanalyysi, visualisointi, parametrisointi
Author Tatu Jämsén
Title of thesis New energy analysis process for the design of building retrofits Degree programme Energy and HVAC-Technology
Major/minor HVAC/Energy technology Code Ene-58
Thesis supervisor Professor Risto Kosonen Thesis advisor Tuomas Laine, M.Sc. (Tech)
Date 04.10.2016 Number of pages 116 +6 Language English
Abstract
Building energy simulation and analysis have gained considerable attention in recent years, due to increasingly complex building design and ever more demanding building regulations. In addition, extensive efforts have focused on energy efficient retrofitting of existing buildings, because of the high energy- and cost-saving potential of the existing building stock. However, the current building design culture has not yet utilized the full potential of energy analysis. Although many advanced methods already exist for supporting energy analysis, no clear process has yet been established for efficiently using these methods in existing building stock. Therefore, this thesis developed and tested a new process for energy analysis in neighborhood-scale retrofit projects. The proposed process aims to support interactive multi-criteria decision making and to guide designers in the challenging data collection task faced during retrofit projects.
The new process utilizes several advanced methods, namely building information modeling (BIM), dynamic energy simulations, as well as sensitivity and uncertainty analyses. Utilizing BIM allows easier storage and retrieval of information throughout the process and allows the usage of more accurate dynamic energy simulation software. The sensitivity analysis is used to support the data collection task and to guide the search for the optimal retrofit solution. The uncertainty analysis enables more justified decisions to be made. The process is divided into two operational modes, the basic and the advanced modes, with different requirements for their input data. A large number of parametrized simulations is performed in both modes, as required by the sensitivity and uncertainty analyses. The developed process is partly based on previous work, which was continued in this thesis by determining the process flow in both operational modes, as well as by including the uncertainty analysis and the weighted visualization method for sensitivity analysis in the process.
The process was tested using a real pilot neighborhood, which made it possible to evaluate the functionality of the process. The energy and comfort simulation software RIUSKA was used in the piloting, because of its automated feature for parametrized simulation. The results demonstrated that the new process shows promise, although it still requires further testing and development. The uncertainty analysis was found to be an important part of the process. Implementing such an energy analysis process in the design of building retrofits could offer an important step towards a more efficient approach for utilizing energy simulations. Using this process could enable energy simulations to be used for guiding the design process already in the first phases of the project in order to effectively support decision making throughout the entire project.
Keywords Energy analysis, energy simulation, building information modeling,
Preface
This thesis has been written for Granlund Oy as a part of its research and development activity. The work was financed by Granlund and the NewTREND EU Project. This thesis was supervised by Professor Risto Kosonen from Aalto University. The advisor for this thesis was Tuomas Laine, director of Granlund’s innovation and development department.
I would like to thank Granlund Oy and the NewTREND project for the financing of this thesis and making it possible to write my thesis on this interesting topic. I would like to express my gratitude to Risto Kosonen for his flexible guidance and valuable comments. I would also like to thank Tuomas Laine for his essential guidance and support, which was especially important at the beginning of this work.
I would like to give special thanks to Davor Stjelja, who has given constructive feedback, technical support and other help throughout this work. I also want to thank Antti Karola, Ken Dooley and all others at Granlund who provided me with valuable advice and support during this work.
Lastly, I would like to thank my family for their support throughout my studies. Especially, I would like to thank Roosa for being my support during this thesis, even though my confidence in myself wavered at times.
Espoo 04.10.2016
Contents
Tiivistelmä Abstract Preface Contents ... i Abbreviations ... iii 1 Introduction ... 1 1.1 Background ... 1 1.2 NewTREND project ... 3 1.3 Objectives ... 3 1.4 Structure ... 42 Advanced methods for energy analysis... 5
2.1 Building information modeling ... 5
2.1.1 Definition and characteristics ... 5
2.1.2 BIM utilization in energy analysis ... 6
2.1.3 BIM in retrofit projects ... 10
2.1.4 Level of detail and level of development ... 12
2.2 Dynamic energy simulation ... 16
2.2.1 Role in energy analyses ... 17
2.2.2 Input parameters for energy simulation ... 19
2.2.3 RIUSKA ... 21
2.3 Sensitivity and uncertainty analyses ... 23
2.3.1 Definitions and implementation steps ... 23
2.3.2 Determining input variations... 24
2.3.3 Utilization in building energy analyses and design... 25
2.3.4 Methods ... 26
2.3.5 Visualization ... 27
3 New energy analysis process ... 30
3.1 Previous work and developments made in this work ... 30
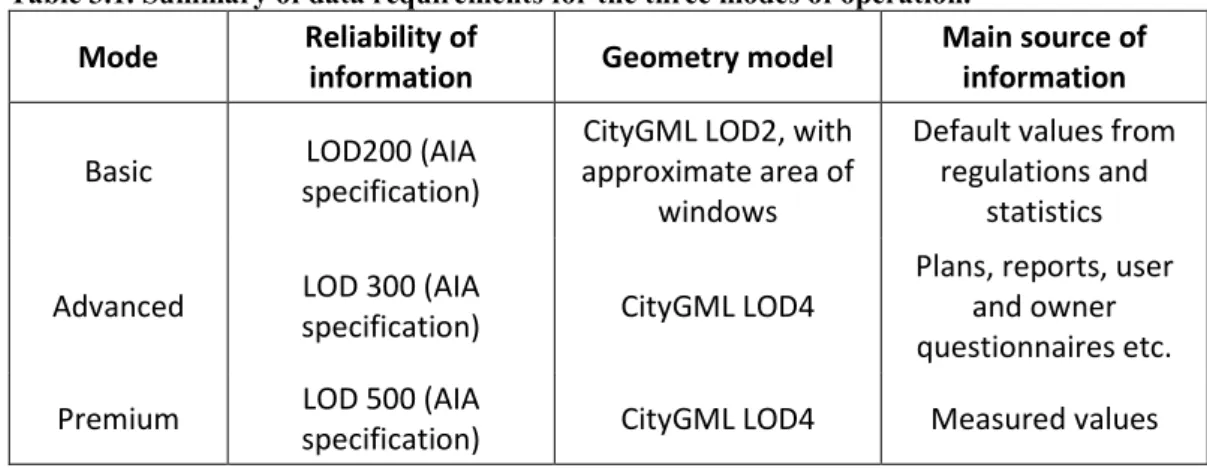
3.2 The modes of operation ... 32
3.2.1 Basic mode ... 33
3.2.2 Advanced mode ... 34
3.2.3 Premium mode ... 34
3.3 The Key Point Analysis tool ... 35
3.3.1 Simulation synthesis ... 35
3.3.2 KPI analysis ... 37
3.4 Sensitivity analysis ... 39
3.4.1 Choosing of the method ... 39
3.4.2 Sensitivity analysis for supporting data collection ... 40
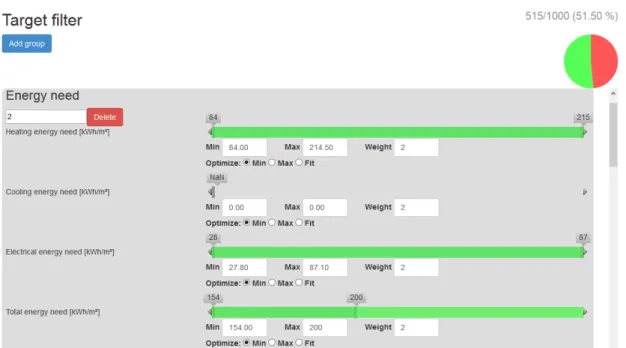
3.4.3 New weighted visualization method ... 40
3.5 Uncertainty analysis ... 42
3.5.1 Implementation in the KPA tool ... 42
3.5.2 Utilization in the process ... 43
3.6 Process flow and description ... 44
3.6.1 Basic mode ... 44
3.6.2 Advanced mode ... 47
4 Piloting of the new process and the advanced methods ... 50
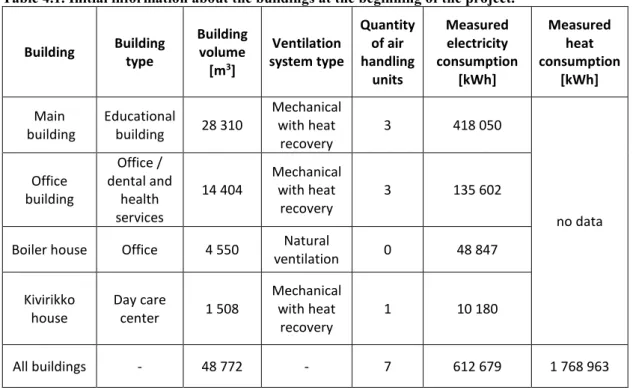
4.1 Description of the pilot project neighborhood... 50
4.2.1 Initial information ... 53
4.2.2 BIM models for energy simulation ... 54
4.2.3 Assessing the energy saving potential of all the buildings ... 56
4.2.4 Defining the current state of the main building ... 61
4.2.5 Feasibility check... 72
4.3 Advanced mode ... 72
4.3.1 BIM model for energy simulation ... 73
4.3.2 Defining the current state more accurately ... 74
4.3.3 Finding the optimal retrofit solution ... 82
5 Discussion ... 98
5.1 Energy modeling of existing buildings ... 98
5.2 BIM utilization ... 98
5.3 The large number of parametrized simulations ... 99
5.4 The modes of operation ... 100
5.5 Sensitivity and uncertainty analyses ... 102
5.6 Key performance indicators and cost data... 105
5.7 Further development needs ... 106
6 Summary and conclusions ... 108
References ... 111 Appendixes
Abbreviations
AHU Air Handling Unit
AIA American Institute of Architects
BES Building Energy Simulation
BIM Building Information Modeling
CAD Computer-Aided Design
COBIM Common Building Information Modeling Requirements
CSV Comma-separated Values
DCV Demand Controlled Ventilation
DHW Domestic Hot Water
ECDF Empirical Cumulative Distribution Function
FM Facility Management
HRU Heat Recovery Unit
HVAC Heating Ventilation and Air Conditioning
IC Influence Coefficient
IFC Industry Foundation Classes
IQR Interquartile Range
KPA Key Point Analysis
KPI Key Performance Indicator
LCC Life Cycle Cost
LCCA Life Cycle Cost Analysis
LOD Level of Detail or Level of Development MEP Mechanical, Electrical, and Plumbing services
NPV Net Present Value
O&M Operations and Maintenance
PCC Partial Correlation Coefficient
PCP Parallel Coordinate Plot
PDF Probability Density Function
PRCC Partial Rank Correlation Coefficient
SA Sensitivity Analysis
SFP Specific Fan Power
SRC Standardized Regression Coefficient SRRC Standardized Rank Regression Coefficient
UA Uncertainty Analysis
VAV Variable Air Volume
XML Extensive Markup Language
1 Introduction
1.1 Background
In recent years, it has become increasingly evident that the existing building stock in Europe consumes an excessive amount of energy, thus making the energy efficient retrofitting of buildings an important research topic. In fact, the existing building stock is responsible for 40% of total energy consumption as well as 36% of total CO2 emissions in the European Union [1]. Moreover, it has been estimated that the buildings that exist today will account for approximately 70% of Europe’s building stock by 2050 [2]. Old buildings tend to consume significantly more energy than those recently built. These issues have led the EU to set two directives, the 2010 Energy Performance of Buildings Directive and the 2012 Energy Efficiency Directive, for reducing the energy consumption of new and existing buildings, respectively [1]. One result of these directives is that they have compelled EU countries to set their own national energy performance requirements for both new buildings and the retrofitting of existing buildings.
In Finland, the Ministry of Environment [3] set new energy regulations for constructing new buildings in 2012. These new regulations encourage the use of renewables and comprehensive management of energy consumption, as well as tighten the required energy efficiency requirements by approximately 20%. Furthermore, the most substantial development was that Finnish building regulations now require that the total energy consumption be calculated using specified weighting factors for different energy carriers. For example, electricity has a weighing factor of 1,7 and district heating a factor of 0,7. All individual sources of energy consumption used in a building are added together, also including the energy use for ventilation, hot water and lighting. In Finland, the total energy consumption calculated in this manner is referred to as the “E-value”, which is used as a basis for obligatory energy certificates. The use of the E-value increases the flexibility of building design, as the energy requirements can be achieved in numerous different ways. [3] In 2013, regulations for energy efficient renovation of existing buildings were also set in Finland [4]. These regulations stipulate that designers use one of three approaches to reduce energy consumption: (1) improve the thermal properties of the building elements to meet specified requirements; (2) lower the standard energy consumption per surface area to the level defined for each building type; or (3) decrease the E-value to a building-specific level. Furthermore, if technical systems, such as heating and ventilation systems, are being retrofitted, they need to meet certain requirements. [4] Again, these options offer designers the flexibility needed for case-specific retrofit projects.
The high energy-saving potential of buildings has also stimulated the development of many advanced technologies for reducing the energy demand of buildings, including improved insulation materials, efficient heat recovery systems and renewable energy generation [5]. However, despite the availability of needed technologies and the directives set by the European Union, the average renovation rate in the EU still remains at only about 1% per year [6]. This modest renovation rate could be explained by the many problems faced in these projects. Naaranoja and Uden [7] analyzed the problems faced in renovation projects in Finland and identified several common problems, including the lack of decision-making process, the lack of risk assessment and failure to learn from successful projects. One significant problem is that the current design and construction process is still rather unstructured, often leading to insufficient collaboration between different actors. Another challenge is that the information about the current
condition of the building is often unavailable, outdated, uncertain or dispersed between numerous sources. Moreover, challenges concerning building design, in general, include complexity of modern buildings [8] and inefficient use of energy analysis [9]. Efficiently utilizing advanced methods, such as dynamic energy simulations, building information modeling (BIM), as well as sensitivity and uncertainty analysis, could address these challenges.
Building design is a complicated combination of multiple engineering disciplines: (1) architectural, (2) heating, ventilation and air-conditioning (HVAC), (3) structural, (4) electrical and (5) automation. In building design, it has always been a challenge to achieve high indoor air quality, while maintaining costs at an acceptable level. Now, tight energy targets are added into the mix, making the building design even more demanding. Moreover, the amount of available materials and technical system options is constantly increasing. This is, of course, a favorable development, but it also means that the number of possible design combinations have increased dramatically, causing the decision making process in the building design to become even more challenging. In addition, modern buildings consist of multiple subsystems that have non-trivial effects on other systems, which makes it difficult to estimate the effects of different design solutions on the total building energy performance. [8, 10] This complexity could be overcome by using dynamic simulations to more accurately analyze the energy consumption of buildings.
Energy analysis of buildings is a tool used for analyzing the energy flows in and out of a building. In addition to energy aspects, indoor environment calculations are also often defined to be included in energy analysis, as they are closely linked together. [11] Recently, energy analysis of buildings has gained increased attention due to ever more demanding building regulations. As the design of buildings is becoming increasingly challenging, energy analysis has been established as a crucial tool in guiding the design process towards more energy efficient solutions. [10, 12] Despite the importance of energy analysis, it is still often done using rather inaccurate statistical estimates or static calculations [11, 12]. Another issue concerning current practices in energy analysis is that it is traditionally often used only in the final stages of the project to confirm that the design complies with regulations and to set targets for the energy consumption [9, 13]. Thus, energy analysis has unused potential in supporting the design process during the earlier phases as well.
The use of building information modeling (BIM) has become more commonly used in the design and construction process of new buildings. Simply put, BIM means creating three-dimensional, object-oriented models of the building, with further information added to each of their components. Utilizing BIM has many benefits, including improved visualization, easier collaboration between designers, easier retrieval of information and more effective design process. [14] Also, it allows much easier use of more accurate dynamic energy simulations for energy analysis, as the BIM model can be used as a data source for many energy simulation tools. [12] However, BIM has rarely been implemented in retrofitting projects. The main reason for this is the difficulties in collecting the required data to create a BIM model. [15]
Uncertainties play an important role in analyzing the energy consumption of buildings. Some input parameters of the simulation model, such as weather and operating schedules of air conditioning, often cannot be known accurately beforehand. These uncertainties should be taken into account in order to make justified design decisions. This can be done
by utilizing sensitivity and uncertainty analyses. [13] In retrofit projects, the information is often outdated, if found at all. Moreover, time causes the structures of existing buildings to deteriorate, making it challenging to determine the thermal properties of the envelope. [16] Therefore, uncertainties caused by a lack of information have an even greater influence on retrofit projects.
Although these advanced methods (i.e. dynamic simulations, BIM, sensitivity analysis and uncertainty analysis) have already been used in energy analyses to some extent, no clear process has yet been established for efficiently using these methods in existing building stock. Recently, Stjelja [17] introduced a new approach for energy analysis of existing buildings in his master’s thesis. His work presented a BIM-based process for energy analysis that could be utilized from the very beginning of a retrofitting project, while taking advantage of sensitivity analysis results. However, this process still requires further development and is in need of piloting on a wider scale. Moreover, it did not include uncertainty analysis, which would be important to make better justified decisions.
1.2 NewTREND project
This thesis forms part of the European Union’s NewTREND project, which aims to develop a new software-based methodology to make retrofitting of buildings more efficient and easy. In the long run, the aim of the NewTREND project is to improve the energy efficiency of the existing European building stock and renovation rate. To achieve this goal, an integrated design methodology for building energy retrofit will be developed that addresses all phases of the retrofitting process. The project also aims to encourage collaboration among all stakeholders, involve building inhabitants and establish energy performance as a key component of retrofitting.
1.3 Objectives
The objective of this thesis is to extend and improve the process introduced by Stjelja [17] for energy analysis in neighborhood scale retrofit projects. The process will be used to support interactive multi-criteria decision-making, while taking into account energy efficiency and comfort, as well as environmental and economic aspects. Several advanced methods are utilized in the process, namely BIM, dynamic energy simulations, as well as sensitivity and uncertainty analyses. The process will cover only the pre-construction phases of retrofit projects. The process proposed in this thesis will be used by the engineering office Granlund to develop a new service concept.
In addition to utilizing BIM in dynamic energy simulations, sensitivity and uncertainty analysis also act as essential tools in the process proposed in this thesis. Currently, sensitivity analysis is used mostly in the design phase to help designers identify the most influential inputs. In this work, an approach is described for using sensitivity analysis also in the preliminary stage of retrofit projects to support the challenging task of data collection. The process will be extended to include the use of an uncertainty analysis: methods for analyzing uncertainty and visualizing the results will be investigated. Furthermore, a new weighted visualization method for sensitivity analysis will be developed for the new process. These improved sensitivity and uncertainty analyses will be implemented in the Key Point Analysis tool (KPA) developed by Granlund.
The process and these methods are piloted in a real retrofitting project located in Seinäjoki, Finland. MagiCAD Room is used to create the BIM models because it allows creating an open form IFC-file that supports energy analysis. The NewTREND project
will be developed around a simulation software called Integrated Environmental Solutions Virtual Environment (IES VE). However, in terms of sensitivity and uncertainty analysis, the current version of IES VE is not the optimal choice. Both sensitivity and uncertainty analysis require a large number of simulations with varying inputs, which would have to be done manually with IES VE. Therefore, the energy simulation software RIUSKA, which has an automated feature for parametrized simulation, is used in this work instead.
1.4 Structure
The rest of this thesis is organized as follows. Chapter 2 reviews the literature covering the methods used in the process. Chapter 3 describes the development of the process. Chapter 4 presents the piloting of the new process. Chapter 5 discusses the different elements and aspects included in this process, as well as provides further development needs. Finally, Chapter 6 summarizes the work and presents the most important conclusions drawn from the piloting of the process.
2 Advanced methods for energy analysis
In this chapter, advanced methods for energy analysis will be reviewed in the form of a literature survey. The focus will be on how these methods can be used in energy analyses and what is required of each method in the new process.
Section 2.1 briefly presents the common characteristics of building information modeling (BIM), including its utilization in energy analyses and in retrofit projects. Section 2.2 describes the benefits and requirements of dynamic energy simulations, as well as presents the simulation software used in this thesis. Finally, section 2.3 describes the fundamentals of sensitivity and uncertainty analyses, as well as their utilization in building energy analyses.
2.1 Building information modeling
The design of buildings has evolved from using paper and pen to digital computer aided design (CAD) in the 1990s. Currently, another big step is being taken as the construction industry is moving from two-dimensional CAD design to intelligent three-dimensional modeling. Building Information Modeling (BIM) is a term that has been widely established in the industry for this advanced 3D design. [18]
This section briefly describes the common characteristics of BIM, and the important issues related to using it in the new process. First, in Section 2.1.1, definitions and benefits of BIM are presented. Section 2.1.2 presents how BIM can be utilized in energy analyses. Section 2.1.3 discusses the challenges and requirements of utilizing BIM in retrofit projects. Lastly, Section 2.1.4 reviews a few specifications of model accuracy and data richness.
2.1.1 Definition and characteristics
BIM is defined in ISO 29481-1:2010(en) [19] standard as: “shared digital representation of physical and functional characteristics of any built object (including buildings, bridges, roads, etc.) which forms a reliable basis for decisions.” Another definition by the US National Building Information Model Standard Project Committee [20] is that:” Building Information Modeling (BIM) is a digital representation of physical and functional characteristics of a facility. A BIM is a shared knowledge resource for information about a facility forming a reliable basis for decisions during its life-cycle; defined as existing from earliest conception to demolition.” More simply put, BIM is creating a 3D geometric model of a building and its components, containing relevant information that is needed in designing, constructing, operating and maintaining the building throughout its lifecycle. In addition to geometric information, objects may have functional, semantic or topologic information [15]. It is important to note that BIM is not just designing in three dimensions, as it also includes information about the building and its components.
In order to give a more precise understanding of what BIM means, the main characteristics of BIM can be described by the following four features [21]:
• Building components are modeled by intelligent objects that recognize what kind of objects they are (e.g. door or window) and can be given data attributes and rules.
• Consistent and non-redundant data, which means that if a change is made in one view, it will also occur in all other views.
• The data included in the building components describe their behavior and can be utilized for analyses and work processes, such as energy simulations.
• The data is coordinated, meaning that all views will be represented in a coordinated way.
The main objective of BIM-based design is to make the whole design and construction process more efficient and easier to control. In addition, it should improve the quality, safety and sustainability of the process. [11, 22] BIM-based design has numerous benefits, including improved visualization and data management, easier coordination between designers, easier retrieval of information and support for different kinds of analyses. In addition, one significant benefit of utilizing BIM is that it allows the design solutions and their functionality to be analyzed throughout the whole lifecycle of the building. BIM can be used in all the disciplines of building design (architectural, structural, HVAC, automation, electricity) to create an integrated model of the building, which makes integrating different disciplines significantly easier. [11, 15, 18] Another important benefit, especially in the framework of this thesis, is that BIM can be used as an information source for many energy simulation tools, thus making the data input faster, easier and less prone to errors [11].
2.1.2 BIM utilization in energy analysis
Energy analysis is an important tool to guide the design process towards energy efficient solutions while maintaining required indoor environment. The energy efficiency and indoor conditions of a building are influenced by architectural, structural and system solutions. Therefore, fluent cooperation between designers throughout the whole project is vital in achieving an optimal total design solution. By utilizing BIM, energy analyses can be more easily done already at the beginning of the project and provide support for collaboration between designers. In addition to estimating energy consumption and indoor conditions, energy analysis can also be used in the HVAC design for the sizing of equipment. [11]
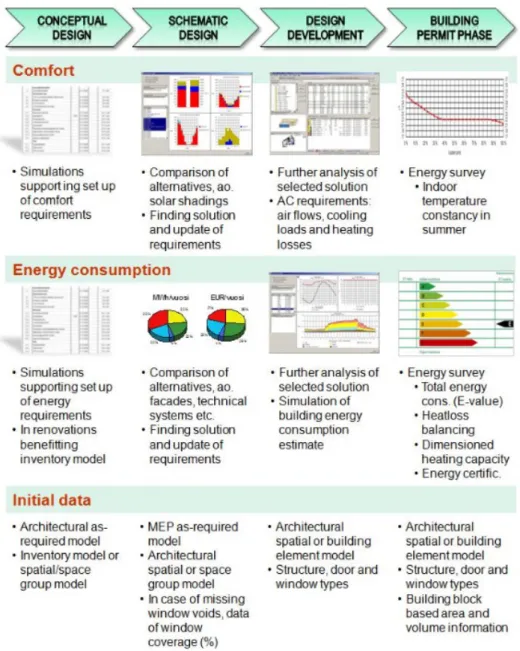
In 2012 was published a series called “Common BIM Requirements 2012” (COBIM), which was funded and written by multiple Finnish companies and organizations. Part 10 of the series [11] covers energy analyses. It describes potential utilization and the requirements of BIM based energy analyses during all construction project stages used in Finland, from conceptual design to operations and maintenance. This section reviews part 10 of COBIM briefly. More detailed information can be found in the paper itself. The potential utilization ways of BIM-based energy analysis are summarized in Figure 2.1 and Figure 2.2 along with required initial data at each stage. This kind of procedure enables beneficial use of energy analyses already in the early design stages by utilizing BIM in multiple ways. [11]
Design and construction projects in Finland are divided into eight phases, all of which can benefit from BIM-based energy analyses (Figure 2.1 and Figure 2.2). First, during the (1) conceptual design, energy analysis is used to support set up of energy and comfort requirements. During the (2) schematic design, energy analysis is used to compare alternate design solutions and finding the optimal solution. Also, energy and comfort requirements are updated if needed. The use of energy analysis continues in the (3) design
developmentphase with further analysis of the selected design solution. In addition, air
condition requirements are defined based on the simulations and an estimate is simulated for building’s energy consumption. In Finland, it is necessary to perform an energy survey during the (4) building permit phase. A BIM-based energy analysis is required to
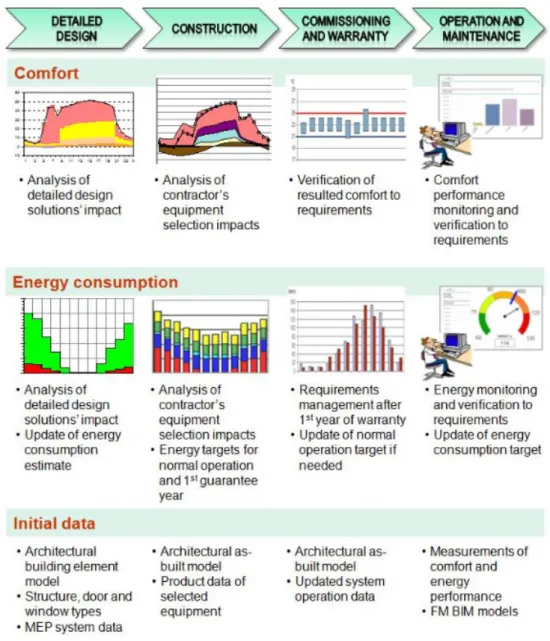
include at least primary energy consumption (E-value), energy certificate and room temperature constancy during summer time. In addition to these, it is also possible to use BIM-based energy analysis in calculating heat loss balancing and dimensioned heating capacity, which are needed in the subsequent parts of energy survey. After building permit is granted, the project moves forward to (5) detailed design. If the changes made in the design during this phase potentially have considerable effects on comfort or energy performance, then energy analysis needs to be updated as well. During the (6)
construction phase, there might be some further changes in the design, depending on the
choices made by the contractor. At the end of construction phase, the energy consumption target for the building is calculated, while taking possible changes into account. Once the construction is complete, begins a phase called (7) commissioning and warranty. As the building is in actual use, better understanding of the building energy performance is obtained. In the light of this better understanding, the energy consumption target is updated if needed. Also, achieving indoor environment comfort requirements are verified during this phase. Finally, during (8) operations and maintenance (O&M), the energy and comfort performance of the building is monitored. [11]
Figure 2.2. Potential ways to utilize energy analyses during all project stages, part 2/2. [11]
From Figure 2.1 and Figure 2.2 can also be seen that the data richness required from the BIM model increases as the project advances. Inventory model, which is used in retrofitting projects, is a model of the current state of the building or buildings. It is used in analyzing the building’s current energy performance and for comparing different design solutions [11]. Spatial model consists of walls and the spaces they define. In order to use the spatial model for energy simulations, it is in most cases required to model also windows in a simplified way. The total area of windows is more important than the shape or location. Later during the project, building element model is created by adding building elements into the spatial model. The accuracy and the amount of information added to the model increases as the project advances. However, as the model becomes more complex, there can often be compatibility difficulties with different analysis software, including energy analysis. These difficulties can be avoided by creating a simplified version of the model for these analysis purposes. [23] Once the construction is complete, architectural as-built model is created, which is a representation of the actual building. Finally, facility management (FM) models are created for operation and maintenance purposes. [11]
Even though BIM utilization has been possible for a rather long time, some serious challenges still exist. One of these problems is the interoperability issues in transferring data from the BIM model to an energy analysis program. Another issue is defining the required information content for energy analyses. Therefore, in COBIM part 10 there is also described requirements for energy analysis programs and for data transfer. For energy analysis programs, two requirements are presented. The first one is that the program can import Industry Foundation Classes (IFC) files of version 2x3 or newer. [11]. The IFC file format is the only open, ISO-certified, three-dimensional and object-oriented exchange format used by BIM [24]. The second requirement for energy analysis programs is that they are capable of dynamic calculations. The properties required from dynamic calculation tools are presented later in Section 2.2.1. In current Finnish building energy regulations [25], in addition to dynamic calculation, the energy calculation program also has to be validated by SFS EN, CIBSE or ASHRAE standards. In COBIM [11], it is recommended that the program has been accepted by the Nordic Energy validation as well.
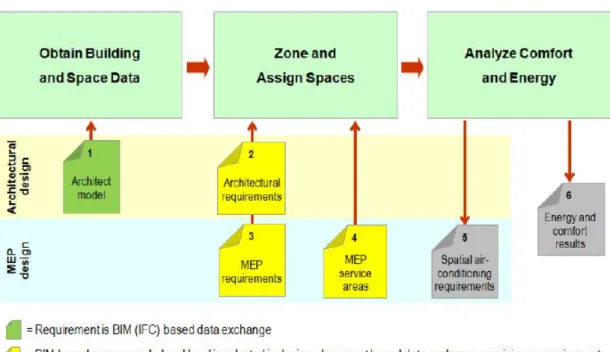
In Figure 2.3 is presented a simplified energy analysis process and the required exchange of information at each phase. The abbreviation MEP stands for mechanical, electrical and plumbing services. BIM-based data exchange is only required for architect’s model. It is recommended also for architectural and MEP requirements, as well as for MEP service areas, but document-based data transfer is sufficient for these purposes. For the outputs of the energy analysis, there are no requirements, but again BIM-based data exchange is recommended. [11]
The architectural BIM model is the most important initial data required in BIM-based energy analysis. The data exchange should be based on IFC file format. Additionally, the IFC file is required to include two different views defined in the IFC standard: coordination view and space boundary add-on view [11]. Coordination view combines architectural, mechanical and structural BIMs into one model, which improves collaboration and information exchange between designers of different disciplines [26]. Space boundary add-on view is important in thermal calculations. It includes processing of space boundaries and other requirements for spaces, zones and thermal properties of elements [27]. Space boundaries are divided into two levels. 1st level boundaries are not influenced by what is on the other side, whereas 2nd level boundaries are influenced by adjacent spaces [28]. More detailed information about the space boundaries can be found in IFC implementation guide [28].
Figure 2.3. Simplified energy analysis process and related information requirements in COBIM. [11]
2.1.3 BIM in retrofit projects
Building retrofit projects include the same phases as constructing new buildings. The largest and most significant decisions are made already in the early conceptual design phase, similar to new buildings. Conceptual design includes gathering initial information about the building, determining needed repairs and evaluating possible retrofit solutions. An important key characteristic for retrofit projects is that as more information about the building is acquired, the designs often have to be altered accordingly. [29] BIM utilization in retrofitting projects is still rare, mainly due to the challenges in data collection and in creating the BIM model [15]. Nevertheless, the use of BIM in retrofitting projects have been found beneficial, even though the usefulness of creating a BIM model has to be assessed case specifically [30].
The BIM model of the starting situation is known as the inventory model. COBIM part 2 [31] addresses the creation of the inventory model and sets many requirements, as well as provides extensive guidelines for this task. In this document, the inventory models are divided into three levels: level 1 spatial model, level 2 building element model and level 3 building element model. The higher the model level, the higher are the requirements set for its creation. The model is complemented to higher levels as the project advances. Level 1 spatial model is used as a source of data for project planning and surveys. Level 2 building element model is the basic level of the inventory model, and it is needed after the project planning phase in the making of schematic level project plans. Level 3 building element model differs from level 2 by its higher level of detail, and it is required only for geometrically complex objects. [31]
In his master’s thesis, Helander [32] assessed the alternatives of utilizing BIM to manage initial information in building retrofit projects. He concluded that there is a need for two separate inventory models: a building frame model to provide exact dimensions of the structures and a space model for managing the building information. These models should be created in three different phases of the project, which are presented in Figure 2.4. In
the first phase, a space model would be created based on existing drawings. In the second phase, the building frame model is created and the space model is complemented with additional information. In the third phase, the models are again complemented with additional information, if it has been obtained through measurements and surveys. Multiple phases should be used, so that the models can be of benefit already at the beginning of the project. However, during these phases, the need for a model should always be evaluated before creating these models. Also, the models should be created in a way that nothing needs to be done twice and only necessary elements are modeled. Since the models should be created and used as early in the project as possible, the early models cannot contain all the information that is needed. Thus, the most important thing is to document the assumptions and levels of accuracy that were used in the creation of the models. This way it is easier to cope with missing information and divide the responsibility between the stakeholders. [32]
Figure 2.4. The three phases when inventory models should be created in renovation projects. [32]
Helander also made conclusions about the benefits of utilizing BIM in retrofit projects. The first benefit is the improved control and management of data, which results in up-to-date and accurate information. The second benefit is that BIM utilization provides a quicker start to projects. The third, and also the most important benefit in the framework of this thesis, is that BIM utilization allows early energy simulations. This is a significant benefit, because the most important and effective decisions concerning the energy efficiency and sustainability of the building are usually made already in the initial project stages. [32]
Volk et al. [15] made a literature review of over 180 recent publications on BIM utilization in the existing building stock and evaluated the future research needs. The focus of this review, however, was only on maintenance and deconstruction stages, and not on actual retrofit design. In this article, it was concluded that despite the numerous potential functionalities of BIM in existing buildings, its implementation is yet scarce. Moreover, its utilization is mainly focused on recently build buildings that already have BIM rather than older buildings without BIM. The reason for this can be explained by the many challenges of using BIM in existing buildings. Volk et al. identified three major challenges and areas of research needs in their review, all of which are informational
issues. The first challenge is the difficulties in collecting the required data and in the creation of the BIM model. New automated techniques for collecting geometrical and thermal data for BIM creation are needed to overcome this challenge. [15] More detailed information about the data collection techniques and appliances can be found in Stjelja’s thesis [17]. The second challenge is the manual work needed to update and maintain the information in the BIM models during the operational years of the building. To cope with this issue, building monitoring should be integrated into the BIM models in order to keep BIM information automatically up-to-date. The third major challenge is the handling and modeling of uncertain data related to retrofitting projects. Despite these challenges, the future of utilizing BIM in the existing building stock seems promising. Volk et al. predict that the trends of increased digitalization and automation as well as the large size of the existing building stock and tightening sustainability requirements will stimulate the implementation of BIM in existing buildings. In addition, new emerging technologies, such as mobile BIM devices, semantic web technologies and cloud computing, should make its implementation easier. [15]
2.1.4 Level of detail and level of development
BIM can be used throughout the whole lifecycle of a building - from conceptual design to operation and maintenance. During this lifecycle, the model is used for different functionalities, which affects the information richness and accuracy that is required from the model. To standardize the level of information, the American Institute of Architects (AIA) developed a specification called ‘level of development’ (LOD). The purpose of the specification is to help practitioners specify and communicate more clearly about the content and reliability of building information models throughout the construction process. This specification divides the development stage of the model elements into six levels. They are presented in Table 2.1 along with their definitions and interpretations. When designing new buildings, LOD increases as the project advances. [33] In retrofitting projects, the LOD depends on the functionalities needed [15]. In order to further explain the LOD framework and standardize its use, BIMForum has published a specification introduction [34] with more detailed description. It emphasizes that LODs are not defined by design phases, even though LODs can be used to define certain milestones in a project. Also, this specification states that there exists no such thing as an “LOD### model”, because usually at different design phases the model has elements of different LOD. However, certain LODs are often a part of the contract documents in projects where BIM is utilized [35]. The required LODs vary in different projects, but Figure 2.5 gives a suggestive idea how the LOD increases as the project advances.
Table 2.1. Level of Development definitions [33] and BIMForum interpretations [34]. LOD ### Definition * BIMForum interpretation
LOD 100
The Model Element may be graphically represented in the Model with a symbol or other generic representation, but does not satisfy the requirements for LOD 200. Information related to the Model Element (i.e. cost per square foot, tonnage of HVAC, etc.) can be derived from other Model Elements.
LOD 100 elements are not geometric representations. Examples are information attached to other model elements or symbols showing the existence of a component but not its shape, size, or precise location. Any information derived from LOD 100 elements must be considered approximate.
LOD 200
The Model Element is graphically represented within the Model as a generic system, object, or assembly with approximate quantities, size, shape, location, and orientation. Non-graphic information may also be attached to the Model Element.
At this LOD elements are generic placeholders. They may be recognizable as the components they represent, or they may be volumes for space reservation. Any information derived from LOD 200 elements must be considered approximate.
LOD 300
The Model Element is graphically represented within the Model as a specific system, object or assembly in terms of quantity, size, shape, location, and orientation. Non-graphic information may also be attached to the Model Element.
The quantity, size, shape, location, and orientation of the element as designed can be measured directly from
the modelwithout referring to non-modeled information such as notes or dimension call-outs.
LOD 350
The Model Element is graphically represented within the Model as a specific system, object, or assembly in terms of quantity, size, shape, location, orientation, and interfaces with other building systems. Non-graphic information may also be attached to the Model Element.
Parts necessary for coordination of the element with nearby or attached elements are modeled. These parts
will include such items as supports and connections. The quantity, size, shape, location, and orientation of the element as designed can be measured directly from the model without referring to non-modeled information such as notes or dimension call-outs.
LOD 400
The Model Element is graphically represented within the Model as a specific system, object or assembly in terms of size, shape, location, quantity, and orientation with detailing, fabrication, assembly, and installation
information. Non-graphic information may also be attached to the Model Element
An LOD 400 element is modeled at sufficient detail and accuracy for fabrication of the represented
component. The quantity, size, shape, location, and orientation of the element as designed can be measured directly from the model without referring to non-modeled information such as notes or dimension call-outs.
LOD 500
The Model Element is a field verified
representation in terms of size, shape, location, quantity, and orientation. Non-graphic information
may also be attached to the Model Elements
N/A
* Definition from the AIA's most recent BIM protocol document G202–2013, Building Information Modeling Protocol Form.
There has been confusion about what LOD levels mean, partly because the same abbreviation is used for slightly different specification called ‘Level of Detail’. They can be seen quite often used incorrectly as synonyms, even in scientific papers. Level of detail is a measure of the quantity of detail that is included in the model element, whereas level of development is a measure of how definitive and thought through the attached information is [34]. In other words, level of detail only describes the quantity of information, and level of development is a degree of how reliable the attached information. To make things even more complicated, also terms ‘level of information’ and ‘level of definition” are used.
McPhee wrote a blog article [36] about LOD, in which is clarified the difference between level of development and level of detail by using a chair as a simple example. In this article, it is emphasized that level of development is an indicator of how seriously the
information can be taken, but not automatically a measure of the quantity of information. Neither is it a measure of the accuracy of graphical presentation, as it is sometimes mistaken. The purpose of level of development is to tell other project members what information represented by a BIM element can be reliably used. On the other hand, level of detail is a measure of the amount of information added to an element, with the assumption that all provided information is reliable. This difference can more easily be understood from Figure 2.6 and Figure 2.7, in which level of development and level of detail is illustrated using a chair as an example. It is important to note, that in both figures only the data in red font is reliable. When using level of development, the graphical presentation at LOD 100 can be as detailed as in LOD 500. The difference is, that in LOD 100 it is only known for certain that the element is a chair, but in LOD 500 all the added information can be relied upon with certainty. This means, that a certain chair from a manufacturer could be used at LOD 100, but this particular chair would not necessarily be the one that is actually going to be used, as illustrated in Figure 2.6. In terms of level of detail, the graphical presentation evolves as the level of detail increases, as shown in Figure 2.7. First, only a 2D symbol of a chair is used. As more information is fixed, the graphical presentation is defined accordingly. [36]
Even though it is important to realize the difference between level of development and level of detail, it cannot be argued that they are closely related to each other. A certain level of development cannot be achieved without a certain amount of information (level of detail). In order to avoid further confusion, McPhee suggests that the abbreviation LOD should be used for level of development and some other term for level of detail. For example, AEC (UK) BIM Protocol [37] uses a term “grade”.
Figure 2.6. Illustration of level of development using a chair as an example. Note that only data in red font is useable. [36]
Figure 2.7. Illustration of level of detail using a chair as an example. [36]
One of the many definitions for level of detail is given by CityGML, which is an open data model based on Extensible Markup Language (XML) format and is used for storing and exchanging virtual 3D city models. CityGML characterizes the level of detail with five consecutive levels, LOD0 being the coarsest and LOD4 the most accurate (Figure 2.8). On a city level, LOD0 is only a landscape which can be supplemented with an aerial image or a map. LOD1 represents buildings only with simple blocks, while LOD2 includes roof and surface elements. LOD 3 resemble architectural models with detailed exterior wall and roof structures, windows and balconies. The most accurate level, LOD4, includes also interior structures and furniture. Additionally, these LODs are characterized by varying accuracies and minimum dimensions of objects. The absolute 3D point accuracy for LOD1 is 5 meters. In the subsequent LODs the required accuracies are: 2 meters in LOD2, 0.5 meters in LOD3 and 0.2 meters in LOD4. [38]
The levels of detail from LOD1 to LOD4 for one individual building model are illustrated in Figure 2.9. LOD1 building model is just a simple block representing the building footprint. In LOD2 model, a pitched roof is added on top of the block. LOD3 building model includes also exterior doors, windows and a chimney. In LOD4 model, the building is completed with rooms formed by interior walls, as well as stairs and possibly furniture. [38]
Figure 2.9. CityGML LOD1 – LOD4 for individual building model. [38]
2.2 Dynamic energy simulation
The previous section described BIM and its utilization in energy analyses and retrofit projects. One significant benefit of using BIM in energy analysis is that it allows easier use of accurate dynamic energy simulations, as the BIM model can be used as a data source for many energy simulation tools. In this section, dynamic building energy simulation (BES) is discussed in more detail.
BES forms an essential component of most energy analyses. It is used for simulating the energy flows inside a building and between its environment under given circumstances and functional requirements. Also, the term “building energy modeling” is used for predicting building performance with the help of simulations. Usually, BES focuses on the energy performance and thermal comfort of buildings. [10] Energy simulations allow designers to predict building performance under certain criteria and make it possible to compare different design solutions more accurately [39]. While this is useful for designing new buildings, it is also useful in retrofit projects. Currently, hundreds of different software programs are available for energy simulation and analysis. They can be categorized in multiple ways, but one common way is to divide them into dynamic and steady-state simulation models. Steady-state models are simple to use and require little computational capacity. However, they do not take dynamic (time dependent) changes into account, such as fluctuating weather conditions, thus making them less accurate. Since dynamic calculation is required in COBIM [11] and in Finnish energy regulations [25], this section focuses on dynamic energy simulations. Section 2.2.1 justifies the need for dynamic energy simulation in energy analyses and describes their utilization in general. Section 2.2.2 gives an overview of the input data requirements for dynamic energy simulations. Finally, the simulation software RIUSKA, which is used in the piloting part of this work, is described in Section 2.2.3.
2.2.1 Role in energy analyses
A building is a complicated system in terms of energy, as it is characterized by a large number of parameters, including the thermal properties of the envelope components, weather, operating schedules, as well as ventilation and air infiltration rates. It has always been a challenge to achieve high indoor air quality, while maintaining costs at an acceptable level. With the advent of tight building regulations, a certain energy efficiency is also required, which makes achieving all these targets even more demanding. Moreover, the amount of available materials and systems is constantly increasing, which has led to an increasing variety of possible design combinations. In addition to the large number of parameters, building energy systems consist of multiple subsystems, such as heating and cooling, ventilation, lighting and other electrical appliances. Adjusting one system can have non-trivial effects on other systems. In short, the energy systems of buildings and their requirements have become so complex that it is almost impossible to find an acceptable design solution based only on expert knowledge and educated guesses. Therefore, building energy simulations are needed and are becoming an increasingly important part of the design process for buildings. [8, 10]
Even though steady-state models are fast and relatively easy to use, they can be rather inaccurate due to several issues. The main issue is that buildings always have some amount of thermal mass allowing energy to be stored and released in the structures, which cannot be taken into account with steady-state models. Moreover, the outdoor and indoor environment clearly vary with time. In addition to variations in weather, also the activity inside the building varies with time, and thus for example internal gains and heating/cooling demand are constantly changing. Using dynamic simulation, these phenomena can be taken into account in order to obtain more reliable results. However, dynamic simulation tools have a drawback of making the simulation model much more complex. This causes them to require more time in creating the simulation model and more computing power. In addition, they require a more experienced user, since the user is usually the greatest possible source of error when using dynamic simulation tools. Moreover, they require more detailed input information, which can be difficult to obtain, especially in retrofit projects. [40] The following five properties are required of dynamic simulation tools: (1) energy stored in structures is taken into account, (2) calculations have to cover a whole year, (3) the maximal time step used is one hour, (4) weather data corresponding to building’s location is used and (5) internal loads and their time profiles are taken into account [11].
There are three main modeling approaches available for building energy modeling, which are the white box model, the black box model and the grey box model. White box models, also known as forward models, are purely based on physics and equations. Black box models are purely empirical, and grey box models something in the between. The white box modeling approach utilizes detailed physics based energy and mass transfer equations to model the building behavior. Thanks to these detailed equations, they are capable of dynamic simulation and can produce accurate results. However, this kind of models are time consuming to develop and solve. Nevertheless, a wide array of mature white box building energy simulation software have been developed and widely used, such as EnergyPlus and TRNSYS. [41, 42]
The white box modeling approach from the energy analyst’s point of view is presented in Figure 2.10. The procedure described in this figure, however, is not universal, but has been followed in many research articles. [41] In addition, the general data flow and a simplified procedure utilized in white box modeling is presented in Figure 2.11. First, the
needed input parameters about the building and its systems have to be obtained and inputted in the simulation software. Using these input parameters, the simulation engine simulates the building operation with the physics based equations it has been programmed with. As a result, the simulation engine produces energy performance indicators as outputs, such as heating and electric energy consumptions. [42]
Figure 2.10. The forward approach of building energy modeling divided into six steps. [41]
Figure 2.11. The general data flow and simplified simulation procedure used in the white box modeling approach. [42]
2.2.2 Input parameters for energy simulation
The required input parameters for building energy simulations depend upon many things, such as which simulation tool is used and what is the purpose of the simulation. In his master’s thesis, Idman [13] reviewed several case studies about the ecosystems of building energy simulations, and made conclusions about the general grouping and significance of the input parameters. This section is partly based on Idman’s thesis and partly on the writer’s previous experience as well as the experience gained from the making this thesis.
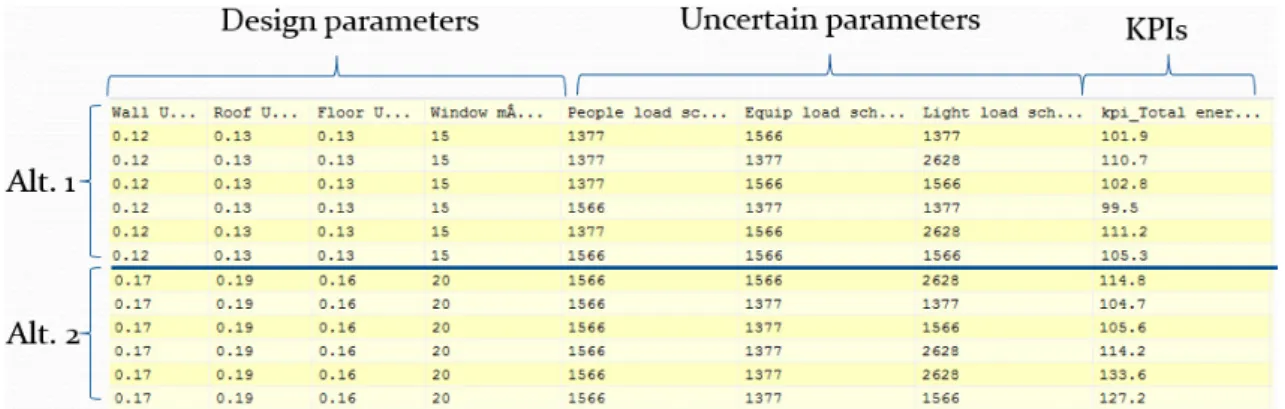
The numerous input parameters needed for simulating energy use of buildings can be divided into design parameters and scenario parameters. Design parameters are variables that can be determined by the designer, while scenario parameters cannot be influenced by the designer. The parameters can be further divided into subgroups, such as geometry related parameters and structural parameters. This is not a universal course of action, as some sources handle the parameters as a single group. [13] In addition, the significance and the nature of these parameters can be different for varying building types.
In general, the energy performance of a building depends mostly upon parameters within six groups: (1) geometry of the building, (2) properties of the envelope elements, (3) properties of the HVAC systems, (4) internal loads, (5) building schedules, as well as (6) the surrounding environment. If calculation of costs is included in the analysis, then the seventh group is (7) economic parameters. Again, this is not a universal way of grouping the parameters, but this kind of division was chosen as the most appropriate for this work. These groups and some of the most important input parameters are presented in Table 2.2.
The first group, geometry of the building, defines the thermal zones and spaces in the building. The location and properties of the space elements have to be defined, because all other data is related directly to these elements. The building is usually divided into rooms, which have varying internal loads and requirements. Also, the orientation angle of the building is included in this group. [13] If BIM is used in the simulations, then all the geometry related information is obtained from the BIM model. By defining the use purpose, requirements and occupancy information for each space allows the energy efficiency and comfort to be analyzed more precisely in the whole building [13].
The second group, properties of the envelope elements, includes the needed parameters to determine the properties of the structural elements and windows. For windows, the most important parameters are U-value, g-value, size and orientation. U-value is a measure of the overall thermal resistance of a building element. The higher the U-value is the more heat is conducted through the element. On the other hand, g-value is a measure of how much solar energy is transmitted through the glass. It is given as a percentage, meaning that a window with a g-value of 100% transmits all the solar energy radiated on it and a window with a g-value of 0% does not let any solar energy past it. Glazing has high impacts on many aspects of building performance, such as heat losses, lighting, comfort and overheating [13]. The structural elements include exterior and interior walls, as well as base floors, intermediate floors and roofs. The most important parameters to characterize these elements are their U-values and heat capacities. The U-values of these structures affect the heat losses through the envelope, while the heat capacities affect the amount of heat stored in the structures. In addition, the air infiltration rate of the building is included in this group.
The third group, HVAC systems, can contain a very large number of parameters. These parameters are mostly related to ventilation, heating and cooling of the building, such as set point temperatures, control curves, electricity demands and efficiencies. These parameters depend upon the types of HVAC systems chosen for the building. For the ventilation of the building, also room specific air flows need to be determined. HVAC systems have a high impact on the comfort level, as well as on the energy consumption. The fourth input parameter group, internal loads, include heat loads from lighting, equipment and people. These internal loads are usually inputted as wats per square meter [W/m2] and their values depend upon the use purpose of the space. The heat load from lighting can be affected with the design. On the other hand, the heat loads from equipment and especially from people are in most cases uncertain, since it is difficult to estimate how many people will use the building and what kind of electric appliances will be used. Thus, these parameters can be treated as scenario parameters in the energy analysis. The fifth group, building schedules, is closely related to the fourth group. This group determines the schedules during which the building is used, and the utilization rates during those hours. Utilization rate is a measure of how much people is using the building, thus affecting the usage of lighting and equipment. Therefore, the internal loads are dependent upon the schedules and utilization rate of the building. In addition, the control of the HVAC systems is affected by the schedules. For example, ventilation is usually turned off when the building is not used. In most energy simulation software, the schedules have to be determined separately for internal loads and HVAC systems. Additionally, schedules for other features, such as shading rate of window blinds, can be determined. It should be noted that the internal load schedules and utilization rates are in many cases uncertain, and thus they can be considered as scenario parameters. The schedules of the HVAC systems, on the other hand, can be affected with the design. The sixth group, the surrounding environment, determines the setting in which the building is located. One significant phenomenon affecting the energy consumption of buildings is the weather. Information about the weather is usually inputted in the simulation software as a single file, that contains hourly data for outdoor temperature, relative humidity, wind speed and direction, as well as for solar radiation. In energy simulations, weather is not usually considered as a variable, but instead it is assumed to remain constant while other input parameters are varied. Usually, test reference year (TRY) weather files are used in the simulations. These are weather files created by meteorological institutes that define typical weather conditions in different geographical locations. Since the designer cannot in any way affect the weather, all the weather related parameters are clearly scenario parameters. In addition to weather, also the shading caused by the surrounding buildings and vegetation can have significant effects on the heating and cooling demands of buildings.
The seventh group, economic parameters, is also consisted of uncertain scenario parameters. The most important parameters are interest rate, inflation rate and escalations. Energy price escalation describes the relative change in energy prices with respect to common inflation. These parameters do not affect the energy performance of buildings in any way, but they can have a significant effect on their life cycle costs.
Table 2.2. Input parameters of building energy simulations divided into groups. Group name Example input parameters Parameter nature Model
geometry
Heated net room area [m2]
Design parameter Volume [m3]
Exterior wall area [m2]
Roof area [m2]
Orientation angle [°]
Envelope & glazing
Exterior wall U-value [W/m2K]
Design parameter Roof U-value [W/m2K]
Ground slab U-value [W/m2K]
Window U-value [W/m2K] Window g-value [%] Infiltration rate n50 [1/h] HVAC systems Ventilation rate [dm3/(sm2)] Design parameter HRU efficiency [%]
Specific fan power of AHUs [W/(ls)] Cooling set point [°C]
Heating set point [°C]
Heating distribution system efficiency [%] Domestic hot water heat demand [kWh/(m2a)]
Loads
People heat load [W/m2] Scenario parameter (but can
partly be affected with design)
Equipment heat load [W/m2]
Lighting heat load [W/m2] Design parameter
Schedules
Schedules and utilization rates of internal loads
Scenario parameter (but can partly be affected with design)
Operational schedule of ventilation system Design parameter
Surrounding
environment Weather file Scenario parameter
Economic Interest rate [%] Scenario parameter
Energy price escalation rate [%]
2.2.3 RIUSKA
The energy and comfort simulation software RIUSKA is based on the internationally acclaimed DOE 2.1E simulation program. It has been developed by Granlund in collaboration with the developer of the DOE program, which is Lawrence Berkeley National Laboratory. [43] RIUSKA has passed the Nordic Energy validation, which is recommended in the COBIM [11].
RIUSKA utilizes BIM in the calculations and supports the IFC format for both importing and exporting the model. It is a very versatile software, since it can be used for many different purposes. Like most energy simulation software, it can be used to ensure compliance with the regulations and the project objectives, calculate estimated consumptions and to simulate indoor temperatures both in the summer and winter. In addition, it can be used for the sizing of technical systems, such as cooling [43], which is currently one of the most common purpose of using RIUSKA at Granlund.
Nevertheless, what makes RIUSKA special, is its parametrized simulation feature. This feature allows the user to choose value ranges for the input parameters, based on which a large number of cases are calculated in one simulation round. The pop-up window of the parametrized simulation is presented in Figure 2.12, in which are listed the parameters that can be parametrized. For some parameters, such as all the envelope components, the range of values is determined choosing different types. RIUSKA has a default database for all the envelope components as well as for the schedules, which can all freely be modified. New construction types and schedules are easy to create as well. For other parameters, such as the internal loads, the parametrization is done by inputting minimum and maximum values for the range, and then defining the length of the step. It is also possible to parametrize other inputs outside this list by using different simulation cases. This means creating different simulation cases in RIUSKA, and then choosing them in the pop-up window (Figure 2.14) to be included in the parametrization. Once the parametrization of inputs has been determined, RIUSKA can either simulate all the possible combinations or a random sample of any size from this group. The amount of simultaneous simulations can also be chosen by the user, up to 16 simulations at the same time. The simulation results are saved to a CSV-file, which is automatically uploaded to the visualization website called the Key Point Analysis (KPA) tool. This visualization tool is described later in Section 3.3. This parametrized simulation feature allows easy and efficient comparison of different design solutions, as well as analyzing the energy performance of the building in different loading and weather conditions. This feature is also very beneficial for the utilization of sensitivity and uncertainty analyses, since they both require a large number of parametrized simulations.
![Figure 2.10. The forward approach of building energy modeling divided into six steps. [41]](https://thumb-ap.123doks.com/thumbv2/123dok/2232599.2720622/25.892.172.589.235.603/figure-forward-approach-building-energy-modeling-divided-steps.webp)
![Figure 2.14. An example bar chart for visualizing sensitivity analysis results. [47]](https://thumb-ap.123doks.com/thumbv2/123dok/2232599.2720622/35.892.183.716.118.441/figure-example-bar-chart-visualizing-sensitivity-analysis-results.webp)