Lampiran 1 Data Perusahaan
Tabel 8 DATA PERUSAHAAN
Delta NBE Delta Laba
N O
Perusa
haan 2.000 2.001 2.002 2.003 2.004 2.000 2.001 2.002 2.003 2.004 1 ACAP 3,5852 0,1134 -0,0217 0,0368 -0,0638 0,4252 0,3414 -0,2562 0,2070 0,4592 2 ADES 10,724 -0,1216 0,0930 0,0388 -0,8063 378,47 -1,1026 1,7219 -0,5240 -43,152 3 AISA -12,193 -0,3750 0,7925 4,0437 0,0009 -5,5327 1,4057 0,7851 -1,1319 1,0093 4 AKRA -1,5199 0,7677 3,4137 0,1313 1,1105 -7,4064 3,4245 -0,9583 0,1337 1,2390
5 ALMI -0,1524 0,1025 -0,0403 -0,1441 0,1863 -0,9703 10,570 -1,4327 -1,5054 0,0055 6 APLI 0,3524 0,0324 -0,0742 0,0019 -0,0506 -0,4847 -0,1007 -3,3642 1,0233 -28,099 7 ASGR 0,2256 0,1729 0,3077 0,0423 -0,0044 1,9221 0,5835 1,6895 -0,7015 0,7434 8 ASII -0,4308 1,2418 1,5317 1,0783 0,4601 -1,1605 4,5379 3,3062 0,2159 0,1411
9 AUTO -0,0543 0,5833 0,1725 0,2734 0,1763 -0,5054 1,4045 0,0067 -0,1981 0,0812 1
0 BATA 0,1893 0,1388 0,0523 0,0622 0,1023 0,2565 0,0023 -0,2380 -0,2570 -0,0242 1
1 BIMA 0,6051 209,23 -1,0200 -0,3133 -0,1814 -3,0541 0,0566 -1,4832 0,5007 0,2396 1
2 BRPT -0,7256 -20,641 1,2712 -1,2068 -0,3674 -8,9100 -0,4730 1,1620 -0,0609 -1,6746 1
3 CEKA 0,0520 0,0765 0,0168 -0,0582 -0,1054 -1,3755 0,4038 3,0304 -0,6744 -8,3069 1
4 CTBN -0,0783 0,0141 0,0280 0,0115 -0,0503 -0,8666 4,1268 -0,2161 0,1396 -0,0411 1
5 DAVO -1,7992 9,0792 -0,0683 0,1845 0,1675 -94,878 1,0415 2,5974 3,1604 0,0754 1
6 DNKS 0,3125 0,2548 0,3771 0,4452 0,4546 -0,0785 0,2413 0,5785 0,3474 0,5388 1
7 DPNS 0,1426 0,0297 -0,0045 -0,0203 0,1098 0,3289 -0,3794 -0,7544 -1,4406 6,5360 1
8 DYNA 2,6605 0,0702 0,2689 0,3323 0,1002 0,0163 0,1260 0,4138 0,1683 -0,1303 1
9 EKAD 0,0518 0,0304 0,0700 0,0291 0,0752 -0,5083 -0,0195 0,0453 -0,3049 0,0298 2
0 ERTX 0,0133 0,0619 0,0454 -0,6261 -0,9520 -0,6268 0,2354 -0,3477 -11,973 0,4646 2
1 ESTI 0,2995 0,0823 -0,0070 -0,0749 -0,0404 -0,9599 6,3333 -0,9504 -20,897 0,5019 2
2 GDYR 0,0351 0,0304 0,0422 -0,0243 0,0876 -0,5777 -0,6850 0,4033 -0,0012 0,5205 2
3 GRIV 1,1887 -0,3314 0,7974 0,0493 0,0257 0,0148 -73,167 3,4636 -0,9844 -0,4994 2
4 HDTX 0,6478 0,1537 0,8041 -0,1046 0,0214 -1,5653 0,8247 3,4760 -3,1532 0,9245 2
5 HEXA -0,6639 0,4987 -0,4191 1,5059 0,1382 -0,5947 0,4035 -0,0981 0,0906 1,1503 2
6 HMSP 2,4832 0,1594 0,1736 0,1536 -0,1372 -0,2823 -0,0577 0,7491 -0,1581 0,4158 2
7 IGAR 0,1057 -1,3234 0,7718 -11,690 1,4907 -0,2709 -0,6183 1,3059 -0,1301 0,6070 2
8 IKAI 0,0275 -0,2865 1,8710 -0,2972 0,0176 1,0162 -11,214 1,8524 -2,3523 0,8678 2
9 IMAS -1,5725 2,9474 -0,6886 0,2204 0,0030 -4,0696 0,8302 19,882 -0,9529 -1,6668 3
3
2 INTA -0,0170 0,1362 0,1257 0,0207 0,0444 -0,8732 1,7152 0,0325 -0,8430 1,2044 3
3 INTP -0,2355 1,4621 0,3783 0,1904 0,0711 -2,6812 0,9279 17,226 -0,4579 -0,7911 3
4 JECC -0,2911 0,0240 0,0705 0,0070 -0,0075 -8,0585 1,0419 3,8861 -0,6660 -0,4387 3
5 JPRS -0,1744 0,2379 0,3065 -0,2375 1,5246 -8,2342 2,1261 0,5767 -0,2332 4,1963 3
6 KLBF -0,1665 0,1713 -60,973 1,0773 0,4455 -1,1356 2,1518 7,1718 0,3969 -0,0015 3
7 KONI -0,1118 0,0041 -0,1911 -0,0243 -0,1222 -18,051 1,0325 -47,825 0,8445 -1,9165 3
8 LION 0,1482 0,0233 0,1100 -0,0616 0,3493 0,6044 -0,0444 -0,7345 2,9378 0,9207 3
9 LMPI 1,5489 1,0941 -0,2546 -0,7600 -0,6618 -0,1569 0,7953 -8,5320 0,3982 -0,2646 4
0 LMSH -0,0906 0,1089 0,1515 0,1306 0,3745 -1,9352 2,0931 0,5428 0,1553 2,2209 4
1 MDRN -0,2315 0,0077 0,1155 0,0498 -0,3018 -5,8357 1,0269 14,019 -0,5187 -6,0858 4
2 MLIA -26,377 -0,4828 0,2271 -0,1793 -0,5113 -1,2016 0,5355 1,6985 -1,5484 -2,7763 4
3 MLPL 0,6823 0,0367 0,0188 0,0243 0,8414 14,336 0,2472 -0,8728 -0,4368 1,0445 4
4 MRAT 10,219 0,1966 0,1534 -0,5903 -0,8012 0,4925 0,1564 -0,4376 -0,4681 0,2088 4
5 MYOR -0,0377 0,0522 0,1843 0,0970 0,0838 0,4848 2,3321 2,8377 1,9866 0,1818 4
6 MYRX -0,6813 -3,1623 5,9434 0,0343 -0,0755 -1,2520 0,5055 0,2405 0,7716 1,1547 4
7 MYTX -0,4955 -1,1124 -4,3384 6,2437 -0,2214 -88,759 -0,0647 0,5655 -0,0577 -0,3530 4
8 NIPS -0,5948 -0,4384 1,9304 5,8708 -0,0343 -2,8560 0,6958 3,4732 -0,7008 -2,2044 4
9 PAFI -0,5253 0,0840 0,3742 -0,3364 1,3370 -2,3135 0,4016 1,4415 -2,7143 -0,3979 5
0 POLY -1,1195 0,0370 -0,8779 0,4236 -0,1738 -1,2835 1,0647 0,5316 0,0161 2,1532 5
1 RDTX 0,0538 0,0101 -0,0315 0,0238 0,0449 -0,0228 -0,7128 -2,3170 1,7327 0,7751 5
2 SCCO 1,7022 -0,0232 0,3124 -0,0014 -0,1575 1,9052 -0,9729 3,5500 -0,7387 -3,0906 5
3 SIMM 0,5075 -0,0562 -0,0618 -0,2637 -0,1278 0,5201 -0,7015 -2,5432 -3,9368 0,7105 5
4 SIPD -2,2154 1,0241 0,9293 1,7694 -0,7478 -4,9546 0,3703 0,7527 -0,4215 -0,4600 5
5 SMSM 0,3017 0,1368 0,0513 0,2066 -0,0334 0,4626 -0,0743 -0,2639 0,1908 0,1978 5
6 SOBI -0,7608 1,3386 0,3443 0,1199 0,0390 -3,3647 3,9030 -0,9710 0,3546 0,1948 5
7 SPMA -0,3462 -0,1852 -0,2143 0,0533 -0,2338 -8,9789 0,6386 0,0574 1,1955 -6,6654 5
8 SRSN 1,6245 0,1840 -0,1741 -0,2530 -0,9966 32,118 -0,1398 -2,1199 -1,4773 0,0543 5
9 SSTM -0,1040 0,0444 0,0777 0,2077 -0,1431 -2,0295 0,7325 3,0456 -0,6199 -6,6341 6
0 STTP 0,1866 0,1027 0,1266 0,1158 0,0581 0,2080 -0,3702 0,3590 0,0304 -0,0828 6
1 SUBA 36,099 0,5384 -0,0424 -0,2335 -0,3100 -1,0347 2,0092 -6,6211 -5,1480 0,0441 6
2 SUDI -1,9581 -1,1856 -0,4396 0,6863 -0,2454 10,994 -1,5146 2,1994 -0,4809 -1,3821 6
3 SULI -0,5899 -1,6108 -1,0706 -0,5621 1,1016 -202,41 -0,1136 0,5927 -0,0872 2,0485 6
4 TFCO -0,3693 0,0986 -0,1847 0,3672 -0,4670 -11,297 1,2899 -4,3697 -0,5251 -1,1721 6
Tabel 9
Return rata-rata geometrik tanggal 31 Maret
Return Saham
NO
Perusahaan
2.001 2.002 2.003 2.004 2.005
1 ACAP 0,00396
-0,02902
0,00054
-0,00018
0
2 ADES -0,01041
0,00037
-0,00452
-0,00132
0,00335
3 AISA -0,00222
0,00336
0,00073
-0,00199
-0,00069
4 AKRA -0,00752
-0,00377
-0,00704
0,00939
0,00197
5 ALMI -0,00565
0,00402
0
0,00112
0,00065
6 APLI -0,00294
0
-0,00365
0
-0,00103
7 ASGR -0,00963
0,00157
-0,0003
-0,00274
-0,00108
8 ASII -0,00434
0,00456
-0,00378
0,00081
0,00175
9 AUTO -0,0051
0,00454
-0,00186
-0,00238
-0,00019
10 BATA 0,00087
0,00173
-0,00173
0,00105
0,00004
11 BIMA 0,00153
-0,00029
0
0
0,00007
12 BRPT -0,00842
0,0069
0,00173
0,00207 0,0017
13 CEKA -0,00663
0,00292
-0,00108
0,00251
0,00037
14 CTBN -0,00059
0
0,0001
0
0
15 DAVO -0,00288
-0,00944
0,00173
0,00303
0,00069
16 DNKS -0,00116
0,00451
0,00366
-0,00978 -0,00312
17 DPNS -0,00354
0,00062
-0,00156
-0,00147
0,00515
18 DYNA -0,00493
0,01341
0,00267
0,00373
0,00038
19 EKAD -0,0035
0,00341
-0,0005
-0,02834 -0,00473
20 ERTX -0,00237
0,00154
0
-0,00083
-0,00224
21 ESTI -0,00184
0,00078
-0,01785
0
-0,0034
22 GDYR -0,00106
-0,00144
-0,00097
0,00109 0,00255
23 GRIV -0,00529
-0,00517
0,00073
0,00238
0,00111
24 HDTX -0,00378
-0,00361
0
0,00218
0
25 HEXA 0,00462
0,00769
0,00101
0,00823
0,00409
26 HMSP -0,00219
0,00589
-0,00371
0
0,00263
27 IGAR -0,00198
0,00456
-0,00205
-0,00199
-0,00125
28 IKAI -0,00567
-0,00469
-0,00365
0,0051
0,00087
29 IMAS -0,00576
-0,00208
0,00341
0
-0,00188
30 INAI -0,00647
0,00391
-0,00322
0,00219
0,00066
6
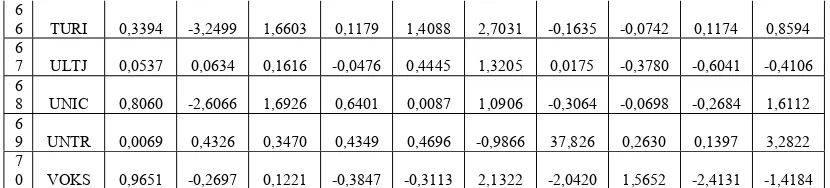
6 TURI 0,3394 -3,2499 1,6603 0,1179 1,4088 2,7031 -0,1635 -0,0742 0,1174 0,8594 6
7 ULTJ 0,0537 0,0634 0,1616 -0,0476 0,4445 1,3205 0,0175 -0,3780 -0,6041 -0,4106 6
8 UNIC 0,8060 -2,6066 1,6926 0,6401 0,0087 1,0906 -0,3064 -0,0698 -0,2684 1,6112 6
9 UNTR 0,0069 0,4326 0,3470 0,4349 0,4696 -0,9866 37,826 0,2630 0,1397 3,2822 7
32 INTA -0,00132
0,008
0,00447
0,00029
0,00167
33 INTP -0,00456
0,0033
0,00279
-0,00209
-0,00092
34 JECC -0,00943
0,00489
0
-0,00673
-0,00094
35 JPRS -0,00272
0
0,00122
-0,00268
0,00066
36 KLBF -0,00417
0,00651
0,00197
-0,00105
-0,00056
37 KONI -0,0035
-0,00153
0
0
0,00012
38 LION 0,00102
0,00379
0,00205
0,00246
0,00221
39 LMPI -0,00963
-0,00377
-0,00411
0,00162
-0,00125
40 LMSH
0,0005
-0,00813
0
0,00885
0,00474
41 MDRN -0,00541
0,00597
-0,00126
-0,00066
-0,00028
42 MLIA -0,00451
0,00288
-0,00209
0
0,00145
43 MLPL -0,0061
0,00344
-0,00503
0,00458 0,00251
44 MRAT -0,00335
0,00596
0,0062
0,00214
-0,00043
45 MYOR -0,00314
0,00482
-0,00066
0,00089
0,00167
46 MYRX -0,00396
0,00489
-0,00583
0,00935
0,00299
47 MYTX -0,00705
0,00162
-0,00422
0
-0,00155
48 NIPS -0,00572
0,00489
0,00193
0,00489
0,00128
49 PAFI -0,00596
0,00184
-0,00583
-0,0097
0,00299
50 POLY -0,00925
0,00309
-0,00471
0,01182
0,00135
51 RDTX -0,00188
-0,00074
0
-0,00097
0,00002
52 SCCO -0,00128
-0,00132
-0,0004
0
-0,00034
53 SIMM -0,00174
0,00645
-0,0047
-0,00199
-0,00016
54 SIPD -0,00462
-0,0034
-0,00478
-0,01365
0,00292
55 SMSM -0,00291
-0,00072
0,00056
0,00063
0,00121
56 SOBI -0,00365
0,00357
-0,00406
0,00054
0,00013
57 SPMA -0,00331
0,00109
-0,00106
-0,00158
-0,0003
58 SRSN -0,00068
0,00869
0,00176
-0,01678
-0,00384
59 SSTM -0,00381
0,00097
0,01096
-0,00261 -0,00164
60 STTP -0,00483
-0,00167
-0,00311
0,00132 -0,00037
61 SUBA -0,01676
0,00489
0,00262
0,00136
-0,00105
62 SUDI -0,00181
-0,00083
-0,00018
0
-0,00009
63 SULI -0,01052
-0,00295
0,00464
0
0,00186
64 TFCO -0,00086
0,0031
-0,00612
0,00072
0,00081
65 TRST -0,00529
0,00651
-0,00049
-0,0037
-0,00175
66 TURI 0,00351
-0,00038
-0,0015
0,00136
0,00358
67 ULTJ -0,01734
0,00117
-0,00298
-0,0063
0,00006
68 UNIC -0,00079
-0,00126
-0,00335
-0,00558
-0,00125
69 UNTR -0,00444
0,00398
-0,00111
0,00063
0,00096
Lampiran 2. Destriptif Uji Asumsi Klasik dan Regresi
Descriptives 2000
Descriptive Statistics
58 -,00963 ,00572 -,0023853 ,00384165 58 -2,2154 3,5852 ,080784 ,9816076 58 -11,2976 10,9940 -,999367 3,6812395 58
Rit NBEK LBK
Valid N (listwise)
N Minimum Maximum Mean Std. Deviation
Descriptives 2001
Descriptive Statistics
62 -,00813 ,00869 ,0011211 ,00393850
62 -3,2499 2,9474 ,003289 1,0040526
62 -8,2342 6,3333 ,544773 1,8675737
62 Rit
NBEK LBK
Valid N (listwise)
N Minimum Maximum Mean Std. Deviation
Descriptives 2002
Descriptive Statistics
63 -,00704 ,00620 -,0010968 ,00284248 63 -4,3384 5,9434 ,322075 1,1718624 63 -8,5320 3,9533 ,242394 2,2438529 63
Rit NBEK LBK
Valid N (listwise)
N Minimum Maximum Mean Std. Deviation
Descriptives 2003
Descriptive Statistics
51 -,00558 ,00558 ,0003190 ,00216945 51 -1,2068 1,0783 ,030261 ,3808968 51 -5,1480 3,1604 -,333941 1,4226370 51
Rit NBEK LBK
Valid N (listwise)
Descriptives 2004
Descriptive Statistics
67 -,00473 ,00515 ,0003312 ,00191333 67 -,9966 1,5246 ,072836 ,5131538 67 -6,6654 6,5360 -,090990 2,1178092 67
Rit NBEK LBK
Valid N (listwise)
N Minimum Maximum Mean Std. Deviation
Descriptives Panel
Descriptive Statistics
301 -,00963 ,00869 -,0003305 ,00328061 301 -4,3384 5,9434 ,104995 ,8759606 301 -11,2976 10,9940 -,106458 2,4340833 301
Rit NBEK LBK
Valid N (listwise)
N Minimum Maximum Mean Std. Deviation
Descriptives Sebelum GCG
Descriptive Statistics
120 -,00963 ,00869 -,0005737 ,00425637 120 -3,2499 3,5852 ,040745 ,9898558 120 -11,2976 10,9940 -,201562 2,9798287 120
Rit NBEK LBK
Valid N (listwise)
N Minimum Maximum Mean Std. Deviation
Descriptives Setelah GCG
Descriptive Statistics
118 -,00558 ,00558 ,0003259 ,00201902 118 -1,2068 1,5246 ,054435 ,4593397 118 -6,6654 6,5360 -,195994 1,8465067 118
Rit NBEK LBK
Valid N (listwise)
Regression 2000
Variables Entered/Removedb
LBK,
Removed Method
All requested variables entered. a.
Dependent Variable: Rit b.
Model Summaryb
,444a ,197 ,168 ,00350438 1,802
Model 1
R R Square
Adjusted R Square
Std. Error of the Estimate
Durbin-Watson
Predictors: (Constant), LBK, NBEK a.
Dependent Variable: Rit b.
ANOVAb
,000 2 ,000 6,750 ,002a
Squares df Mean Square F Sig.
Predictors: (Constant), LBK, NBEK a.
Dependent Variable: Rit b.
Coefficientsa
-,002 ,000 -4,211 ,000
,001 ,000 ,147 1,183 ,242 ,941 1,063
,000 ,000 ,385 3,088 ,003 ,941 1,063
(Constant) NBEK LBK Model 1
B Std. Error Unstandardized
Coefficients
Beta Standardized
Coefficients
t Sig. Tolerance VIF
Collinearity Statistics
Dependent Variable: Rit a.
Collinearity Diagnosticsa
1,301 1,000 ,21 ,10 ,37
Index (Constant) NBEK LBK
Variance Proportions
Dependent Variable: Rit a.
Residuals Statisticsa
-,0067777 ,0022703 -,0023853 ,00170542 58
-,008501 ,00727233 ,00000000 ,00344235 58
-2,576 2,730 ,000 1,000 58
-2,426 2,075 ,000 ,982 58
Predicted Value Residual
Std. Predicted Value Std. Residual
Minimum Maximum Mean Std. Deviation N
Explore
Case Processing Summary
58 12,3% 415 87,7% 473 100,0%
Unstandardized Residual
N Percent N Percent N Percent
Valid Missing Total
Cases
Descriptives
,0000000 ,00045200 -,0009051
,0009051
,0000461 -,0005571 ,000 ,00344235 -,00850 ,00727 ,01577 ,00482
-,050 ,314
,118 ,618
Mean
Lower Bound Upper Bound 95% Confidence
Interval for Mean
5% Trimmed Mean Median
Variance Std. Deviation Minimum Maximum Range
Interquartile Range Skewness
Kurtosis Unstandardized Residual
Statistic Std. Error
Extreme Values
25 ,00727 54 ,00704 11 ,00630 57 ,00592 30 ,00504 46 -,00850 28 -,00843 68 -,00606 5 -,00444 66 -,00400 1
2 3 4 5 1 2 3 4 5 Highest
Lowest Unstandardized Residual
Case Number Value
Tests of Normality
,104 58 ,190 ,980 58 ,468 Unstandardized Residual
Statistic df Sig. Statistic df Sig. Kolmogorov-Smirnova Shapiro-Wilk
GLESJER
Variables Entered/Removedb
LBK,
NBEKa . Enter
Model 1
Variables Entered
Variables
Removed Method
All requested variables entered. a.
Dependent Variable: ABS_RES b.
Model Summary
,117a ,014 -,022 ,00209
Model 1
R R Square
Adjusted R Square
Std. Error of the Estimate
Predictors: (Constant), LBK, NBEK a.
ANOVAb
,000 2 ,000 ,381 ,685a
,000 55 ,000
,000 57
Regression Residual Total Model 1
Sum of
Squares df Mean Square F Sig.
Predictors: (Constant), LBK, NBEK a.
Dependent Variable: ABS_RES b.
Coefficientsa
,003 ,000 9,459 ,000
,000 ,000 ,111 ,808 ,423
9,73E-006 ,000 ,017 ,126 ,901
(Constant) NBEK LBK Model 1
B Std. Error Unstandardized
Coefficients
Beta Standardized
Coefficients
t Sig.
Regression 2001
Variables Entered/Removedb
LBK,
Removed Method
All requested variables entered. a.
Dependent Variable: Rit b.
Model Summaryb
,238a ,057 ,025 ,00388921 2,156
Model 1
R R Square
Adjusted R Square
Std. Error of the Estimate
Durbin-Watson
Predictors: (Constant), LBK, NBEK a.
Dependent Variable: Rit b.
ANOVAb
,000 2 ,000 1,778 ,178a
Squares df Mean Square F Sig.
Predictors: (Constant), LBK, NBEK a.
Dependent Variable: Rit b.
Coefficientsa
,001 ,001 1,637 ,107
-2,0E-005 ,001 -,005 -,038 ,970 ,913 1,095 ,001 ,000 ,240 1,813 ,075 ,913 1,095 (Constant)
NBEK LBK Model 1
B Std. Error Unstandardized
Coefficients
Beta Standardized
Coefficients
t Sig. Tolerance VIF Collinearity Statistics
Dependent Variable: Rit a.
Collinearity Diagnosticsa
1,401 1,000 ,16 ,16 ,30
Index (Constant) NBEK LBK Variance Proportions
Dependent Variable: Rit a.
Residuals Statisticsa
-,0033161 ,0040476 ,0011211 ,00093901 62 -,010032 ,00791875 ,00000000 ,00382492 62 -4,725 3,117 ,000 1,000 62 -2,580 2,036 ,000 ,983 62 Predicted Value
Residual
Std. Predicted Value Std. Residual
Minimum Maximum Mean Std. Deviation N
Explore
Case Processing Summary
62 13,4% 400 86,6% 462 100,0%
Unstandardized Residual
N Percent N Percent N Percent
Valid Missing Total
Cases
Descriptives
,0000000 ,00048577 -,0009713
,0009713
,0000541 ,0005046 ,000 ,00382492 -,01003 ,00792 ,01795 ,00588
-,199 ,304 -,408 ,599 Mean
Lower Bound Upper Bound 95% Confidence
Interval for Mean
5% Trimmed Mean Median
Variance Std. Deviation Minimum Maximum Range
Interquartile Range Skewness
Kurtosis Unstandardized Residual
Statistic Std. Error
Extreme Values
60 ,00792 25 ,00665 55 ,00629 41 ,00596 19 ,00508 49 -,01003 56 -,00703 68 -,00678 18 -,00633 46 -,00500 1
2 3 4 5 1 2 3 4 5 Highest
Lowest Unstandardized Residual
Case Number Value
Tests of Normality
,066 62 ,200* ,988 62 ,818
Unstandardized Residual
Statistic df Sig. Statistic df Sig.
Kolmogorov-Smirnova Shapiro-Wilk
This is a lower bound of the true significance. *.
GLESJER
Variables Entered/Removedb
LBK,
NBEKa . Enter
Model 1
Variables Entered
Variables
Removed Method
All requested variables entered. a.
Dependent Variable: ABS_RES b.
Model Summary
,186a ,035 ,002 ,00207
Model 1
R R Square
Adjusted R Square
Std. Error of the Estimate
Predictors: (Constant), LBK, NBEK a.
ANOVAb
,000 2 ,000 1,061 ,353a
,000 59 ,000
,000 61
Regression Residual Total Model 1
Sum of
Squares df Mean Square F Sig.
Predictors: (Constant), LBK, NBEK a.
Dependent Variable: ABS_RES b.
Coefficientsa
,003 ,000 11,284 ,000
,000 ,000 ,102 ,766 ,447
,000 ,000 ,128 ,959 ,342
(Constant) NBEK LBK Model 1
B Std. Error Unstandardized
Coefficients
Beta Standardized
Coefficients
t Sig.
Regression 2002
Variables Entered/Removed b
LBK,
Removed Method
All requested variables entered. a.
Dependent Variable: Rit b.
Model Summaryb
,261a ,068 ,037 ,00278969 2,124 Model
1
R R Square
Adjusted R Square
Std. Error of the Estimate
Durbin-Watson
Predictors: (Constant), LBK, NBEK a.
Dependent Variable: Rit b.
ANOVAb
,000 2 ,000 2,184 ,121a
Squares df Mean Square F Sig.
Predictors: (Constant), LBK, NBEK a.
Dependent Variable: Rit b.
Coefficientsa
-,001 ,000 -2,685 ,009
-,001 ,000 -,219 -1,732 ,088 ,975 1,026
,000 ,000 ,180 1,429 ,158 ,975 1,026
(Constant) NBEK LBK Model 1
B Std. Error
Unstandardized Coefficients
Beta Standardized
Coefficients
t Sig. Tolerance VIF
Collinearity Statistics
Dependent Variable: Rit a.
Collinearity Diagnosticsa
1,378 1,000 ,24 ,28 ,16
Index (Constant) NBEK LBK
Variance Proportions
Dependent Variable: Rit a.
Residuals Statisticsa
-,0040787 ,0014488 -,0010968 ,00074052 63 -,005669 ,00736273 ,00000000 ,00274432 63 -4,027 3,438 ,000 1,000 63 -2,032 2,639 ,000 ,984 63 Predicted Value
Residual
Std. Predicted Value Std. Residual
Minimum Maximum Mean Std. Deviation N
Explore
Case Processing Summary
63 15,2% 352 84,8% 415 100,0%
Unstandardized Residual
N Percent N Percent N Percent
Valid Missing Total
Cases
Descriptives
,0000000 ,00034575 -,0006911
,0006911
-,0000547 -,0000047 ,000 ,00274432 -,00567 ,00736 ,01303 ,00367
,254 ,302
-,059 ,595 Mean
Lower Bound Upper Bound 95% Confidence
Interval for Mean
5% Trimmed Mean Median
Variance Std. Deviation Minimum Maximum Range
Interquartile Range Skewness
Kurtosis Unstandardized Residual
Statistic Std. Error
Extreme Values
44 ,00736 65 ,00551 61 ,00509 63 ,00492 20 ,00471 54 -,00567 49 -,00498 23 -,00432 64 -,00424 22 -,00403 1
2 3 4 5 1 2 3 4 5 Highest
Lowest Unstandardized Residual
Case Number Value
Tests of Normality
,051 63 ,200* ,989 63 ,863
Unstandardized Residual
Statistic df Sig. Statistic df Sig.
Kolmogorov-Smirnova Shapiro-Wilk
This is a lower bound of the true significance. *.
GLESJER
Variables Entered/Removedb
LBK,
NBEKa . Enter
Model 1
Variables Entered
Variables
Removed Method
All requested variables entered. a.
Dependent Variable: ABS_RES b.
Model Summary
,237a ,056 ,025 ,00165
Model 1
R R Square
Adjusted R Square
Std. Error of the Estimate
Predictors: (Constant), LBK, NBEK a.
ANOVAb
,000 2 ,000 1,785 ,177a
,000 60 ,000
,000 62
Regression Residual Total Model 1
Sum of
Squares df Mean Square F Sig.
Predictors: (Constant), LBK, NBEK a.
Dependent Variable: ABS_RES b.
Coefficientsa
,002 ,000 10,361 ,000
,000 ,000 -,100 -,785 ,436
,000 ,000 -,200 -1,573 ,121
(Constant) NBEK LBK Model 1
B Std. Error Unstandardized
Coefficients
Beta Standardized
Coefficients
t Sig.
Regression 2003
Variables Entered/Removed b
LBK,
Removed Method
All requested variables entered. a.
Dependent Variable: Rit b.
Model Summaryb
,285a ,081 ,043 ,00212266 2,209
Model 1
R R Square
Adjusted R Square
Std. Error of the Estimate
Durbin-Watson
Predictors: (Constant), LBK, NBEK a.
Dependent Variable: Rit b.
ANOVAb
,000 2 ,000 2,114 ,132a
Squares df Mean Square F Sig.
Predictors: (Constant), LBK, NBEK a.
Dependent Variable: Rit b.
Coefficientsa
,000 ,000 1,222 ,228
-,002 ,001 -,287 -2,034 ,048 ,960 1,042 2,34E-005 ,000 ,015 ,109 ,914 ,960 1,042 (Constant)
NBEK LBK Model 1
B Std. Error Unstandardized
Coefficients
Beta Standardized
Coefficients
t Sig. Tolerance VIF Collinearity Statistics
Dependent Variable: Rit a.
Collinearity Diagnosticsa
1,255 1,000 ,24 ,09 ,41
Index (Constant) NBEK LBK Variance Proportions
Dependent Variable: Rit a.
Residuals Statisticsa
-,0013825 ,0023490 ,0003190 ,00061728 51
-,004903 ,00463091 ,00000000 ,00207977 51
-2,756 3,289 ,000 1,000 51
-2,310 2,182 ,000 ,980 51
Predicted Value Residual
Std. Predicted Value Std. Residual
Minimum Maximum Mean Std. Deviation N
Explore
Case Processing Summary
51 11,2% 404 88,8% 455 100,0%
Unstandardized Residual
N Percent N Percent N Percent
Valid Missing Total
Cases
Descriptives
,0000000 ,00029123 -,0005849
,0005849
-,0000101 -,0000089 ,000 ,00207977 -,00490 ,00463 ,00953 ,00231
,095 ,333
,172 ,656
Mean
Lower Bound Upper Bound 95% Confidence
Interval for Mean
5% Trimmed Mean Median
Variance Std. Deviation Minimum Maximum Range
Interquartile Range Skewness
Kurtosis Unstandardized Residual
Statistic Std. Error
Extreme Values
35 ,00463 28 ,00429 53 ,00425 18 ,00389 15 ,00288 68 -,00490 65 -,00400 70 -,00344 7 -,00303 56 -,00271 1
2 3 4 5 1 2 3 4 5 Highest
Lowest Unstandardized Residual
Case Number Value
Tests of Normality
,090 51 ,200* ,983 51 ,656 Unstandardized Residual
Statistic df Sig. Statistic df Sig. Kolmogorov-Smirnova Shapiro-Wilk
This is a lower bound of the true significance. *.
GLESJER
Variables Entered/Removedb
LBK,
NBEKa . Enter
Model 1
Variables Entered
Variables
Removed Method
All requested variables entered. a.
Dependent Variable: ABS_RES b.
Model Summary
,187a ,035 -,005 ,00134
Model 1
R R Square
Adjusted R Square
Std. Error of the Estimate
Predictors: (Constant), LBK, NBEK a.
ANOVAb
,000 2 ,000 ,866 ,427a
,000 48 ,000
,000 50
Regression Residual Total Model 1
Sum of
Squares df Mean Square F Sig.
Predictors: (Constant), LBK, NBEK a.
Dependent Variable: ABS_RES b.
Coefficientsa
,002 ,000 7,830 ,000
,000 ,001 ,124 ,855 ,397
,000 ,000 -,167 -1,151 ,255
(Constant) NBEK LBK Model 1
B Std. Error Unstandardized
Coefficients
Beta Standardized
Coefficients
t Sig.
Regression 2004
Variables Entered/Removedb
LBK,
Removed Method
All requested variables entered. a.
Dependent Variable: Rit b.
Model Summaryb
,395a ,156 ,129 ,00178522 2,208 Model
1
R R Square
Adjusted R Square
Std. Error of the Estimate
Durbin-Watson
Predictors: (Constant), LBK, NBEK a.
Dependent Variable: Rit b.
ANOVAb
,000 2 ,000 5,906 ,004a
Squares df Mean Square F Sig.
Predictors: (Constant), LBK, NBEK a.
Dependent Variable: Rit b.
Coefficientsa
,000 ,000 1,299 ,198
,001 ,000 ,235 1,924 ,059 ,883 1,132
,000 ,000 ,247 2,020 ,048 ,883 1,132
(Constant) NBEK LBK Model 1
B Std. Error
Unstandardized Coefficients
Beta Standardized
Coefficients
t Sig. Tolerance VIF
Collinearity Statistics
Dependent Variable: Rit a.
Collinearity Diagnosticsa
1,347 1,000 ,03 ,33 ,29
Index (Constant) NBEK LBK
Variance Proportions
Dependent Variable: Rit a.
Residuals Statisticsa
-,0014034 ,0025598 ,0003312 ,00075526 67 -,005090 ,00362890 ,00000000 ,00175796 67 -2,297 2,951 ,000 1,000 67 -2,851 2,033 ,000 ,985 67 Predicted Value
Residual
Std. Predicted Value Std. Residual
Minimum Maximum Mean Std. Deviation N
Explore
Case Processing Summary
67 15,4% 369 84,6% 436 100,0% Unstandardized Residual
N Percent N Percent N Percent
Valid Missing Total
Cases
Descriptives
,0000000 ,00021477 -,0004288
,0004288
,0000385 ,0000336 ,000 ,00175796 -,00509 ,00363 ,00872 ,00220
-,305 ,293
,548 ,578
Mean
Lower Bound Upper Bound 95% Confidence
Interval for Mean
5% Trimmed Mean Median
Variance Std. Deviation Minimum Maximum Range
Interquartile Range Skewness
Kurtosis Unstandardized Residual
Statistic Std. Error
Extreme Values
16 ,00363 25 ,00342 54 ,00339 6 ,00331 46 ,00251 10 -,00509 41 -,00393 21 -,00376 31 -,00327 27 -,00298 1
2 3 4 5 1 2 3 4 5 Highest
Lowest Unstandardized Residual
Case Number Value
Tests of Normality
,069 67 ,200* ,981 67 ,404
Unstandardized Residua
Statistic df Sig. Statistic df Sig. Kolmogorov-Smirnova Shapiro-Wilk
This is a lower bound of the true significance. *.
GLESJER
Variables Entered/Removedb
LBK,
NBEKa . Enter
Model 1
Variables Entered
Variables
Removed Method
All requested variables entered. a.
Dependent Variable: ABS_RES b.
Model Summary
,216a ,047 ,017 ,00112
Model 1
R R Square
Adjusted R Square
Std. Error of the Estimate
Predictors: (Constant), LBK, NBEK a.
ANOVAb
,000 2 ,000 1,568 ,216a
,000 64 ,000
,000 66
Regression Residual Total Model 1
Sum of
Squares df Mean Square F Sig.
Predictors: (Constant), LBK, NBEK a.
Dependent Variable: ABS_RES b.
Coefficientsa
,001 ,000 9,724 ,000
,000 ,000 -,055 -,426 ,671
,000 ,000 ,229 1,761 ,083
(Constant) NBEK LBK Model 1
B Std. Error Unstandardized
Coefficients
Beta Standardized
Coefficients
t Sig.
Regression Panel
Variables Entered/Removedb
LBK,
Removed Method
All requested variables entered. a.
Dependent Variable: Rit b.
Model Summaryb
,307a ,094 ,088 ,00313272 1,799 Model
1
R R Square
Adjusted R Square
Std. Error of the Estimate
Durbin-Watson
Predictors: (Constant), LBK, NBEK a.
Dependent Variable: Rit b.
ANOVAb
,000 2 ,000 15,496 ,000a
,003 298 ,000
,003 300
Regression
Squares df Mean Square F Sig.
Predictors: (Constant), LBK, NBEK a.
Dependent Variable: Rit b.
Coefficientsa
,000 ,000 -1,456 ,146
,000 ,000 -,051 -,894 ,372 ,951 1,052
,000 ,000 ,314 5,556 ,000 ,951 1,052
(Constant) NBEK LBK Model 1
B Std. Error
Unstandardized Coefficients
Beta Standardized
Coefficients
t Sig. Tolerance VIF
Collinearity Statistics
Dependent Variable: Rit a.
Collinearity Diagnosticsa
1,229 1,000 ,05 ,40 ,31
Index (Constant) NBEK LBK
Variance Proportions
Dependent Variable: Rit a.
Residuals Statisticsa
-,0049794 ,0047605 -,0003305 ,00100690 301
-,010136 ,00904958 ,00000000 ,00312226 301
-4,617 5,056 ,000 1,000 301
-3,235 2,889 ,000 ,997 301
Predicted Value Residual
Std. Predicted Value Std. Residual
Minimum Maximum Mean Std. Deviation N
Explore
Case Processing Summary
301 78,2% 84 21,8% 385 100,0% Unstandardized Residua
N Percent N Percent N Percent Valid Missing Total
Cases
Descriptives
,0000000 ,00017996 -,0003542
,0003542
,0000020 -,0000058 ,000 ,00312226 -,01014 ,00905 ,01919 ,00384
-,091 ,140 ,290 ,280 Mean
Lower Bound Upper Bound 95% Confidence
Interval for Mean
5% Trimmed Mean Median
Variance Std. Deviation Minimum Maximum Range
Interquartile Range Skewness
Kurtosis Unstandardized Residual
Statistic Std. Error
Extreme Values
130 ,00905 95 ,00788 125 ,00757 111 ,00700 245 ,00679 46 -,01014 28 -,00900 119 -,00873 68 -,00865 70 -,00657 1
2 3 4 5 1 2 3 4 5 Highest
Lowest Unstandardized Residual
Case Number Value
Tests of Normality
,039 301 ,200* ,996 301 ,559 Unstandardized Residual
Statistic df Sig. Statistic df Sig. Kolmogorov-Smirnova Shapiro-Wilk
This is a lower bound of the true significance. *.
GELSJER
Variables Entered/Removedb
LBK,
NBEKa . Enter
Model 1
Variables Entered
Variables
Removed Method
All requested variables entered. a.
Dependent Variable: ABS_RES b.
Model Summary
,055a ,003 -,004 ,00196
Model 1
R R Square
Adjusted R Square
Std. Error of the Estimate
Predictors: (Constant), LBK, NBEK a.
ANOVAb
,000 2 ,000 ,445 ,641a
,001 298 ,000
,001 300
Regression Residual Total Model 1
Sum of
Squares df Mean Square F Sig.
Predictors: (Constant), LBK, NBEK a.
Dependent Variable: ABS_RES b.
Coefficientsa
,002 ,000 21,234 ,000
8,76E-005 ,000 ,039 ,663 ,508
-3,8E-005 ,000 -,048 -,802 ,423
(Constant) NBEK LBK Model 1
B Std. Error Unstandardized
Coefficients
Beta Standardized
Coefficients
t Sig.
Regression Sebelum GCG
Variables Entered/Removedb
LBK,
Removed Method
All requested variables entered. a.
Dependent Variable: Rit b.
Model Summaryb
,404a ,163 ,149 ,00392715 1,788
Model 1
R R Square
Adjusted R Square
Std. Error of the Estimate
Durbin-Watson
Predictors: (Constant), LBK, NBEK a.
Dependent Variable: Rit b.
ANOVAb
,000 2 ,000 11,394 ,000a
,002 117 ,000
,002 119
Regression
Squares df Mean Square F Sig.
Predictors: (Constant), LBK, NBEK a.
Dependent Variable: Rit b.
Coefficientsa
,000 ,000 -1,290 ,199
,000 ,000 ,028 ,323 ,747 ,948 1,055
,001 ,000 ,396 4,564 ,000 ,948 1,055
(Constant) NBEK LBK Model 1
B Std. Error
Unstandardized Coefficients
Beta Standardized
Coefficients
t Sig. Tolerance VIF
Collinearity Statistics
Dependent Variable: Rit a.
Collinearity Diagnosticsa
1,226 1,000 ,01 ,37 ,39
Index (Constant) NBEK LBK Variance Proportions
Dependent Variable: Rit a.
Residuals Statisticsa
-,0069065 ,0055337 -,0005737 ,00171855 120 -,010281 ,00921142 ,00000000 ,00389401 120 -3,685 3,554 ,000 1,000 120 -2,618 2,346 ,000 ,992 120 Predicted Value
Residual
Std. Predicted Value Std. Residual
Minimum Maximum Mean Std. Deviation N
Explore
Case Processing Summary
120 29,1% 293 70,9% 413 100,0% Unstandardized Residual
N Percent N Percent N Percent
Valid Missing Total
Cases
Descriptives
,0000000 ,00035547 -,0007039
,0007039
,0000454 -,0003334 ,000 ,00389401 -,01028 ,00921 ,01949 ,00572
-,046 ,221 -,280 ,438 Mean
Lower Bound Upper Bound 95% Confidence
Interval for Mean
5% Trimmed Mean Median
Variance Std. Deviation Minimum Maximum Range
Interquartile Range Skewness
Kurtosis Unstandardized Residual
Statistic Std. Error
Extreme Values
110 ,00921 76 ,00787 105 ,00748 92 ,00732 72 ,00637 41 -,01028 27 -,00926 100 -,00886 57 -,00792 58 -,00734 1
2 3 4 5 1 2 3 4 5 Highest
Lowest Unstandardized Residual
Case Number Value
Tests of Normality
,063 120 ,200* ,989 120 ,464 Unstandardized Residual
Statistic df Sig. Statistic df Sig. Kolmogorov-Smirnova Shapiro-Wilk
This is a lower bound of the true significance. *.
GLESJER
Variables Entered/Removedb
LBK,
NBEKa . Enter
Model 1
Variables Entered
Variables
Removed Method
All requested variables entered. a.
Dependent Variable: ABS_RES b.
Model Summary
,111a ,012 -,005 ,00218
Model 1
R R Square
Adjusted R Square
Std. Error of the Estimate
Predictors: (Constant), LBK, NBEK a.
ANOVAb
,000 2 ,000 ,723 ,487a
,001 117 ,000
,001 119
Regression Residual Total Model 1
Sum of
Squares df Mean Square F Sig.
Predictors: (Constant), LBK, NBEK a.
Dependent Variable: ABS_RES b.
Coefficientsa
,003 ,000 16,139 ,000
,000 ,000 ,053 ,558 ,578
6,27E-005 ,000 ,086 ,910 ,365
(Constant) NBEK LBK Model 1
B Std. Error Unstandardized
Coefficients
Beta Standardized
Coefficients
t Sig.
Regression Setelah GCG
Variables Entered/Removedb
LBK,
Removed Method
All requested variables entered. a.
Dependent Variable: Rit b.
Model Summaryb
,188a ,035 ,019 ,00200024 2,179
Model 1
R R Square
Adjusted R Square
Std. Error of the Estimate
Durbin-Watson
Predictors: (Constant), LBK, NBEK a.
Dependent Variable: Rit b.
ANOVAb
,000 2 ,000 2,104 ,127a ,000 115 ,000
,000 117 Regression
Squares df Mean Square F Sig.
Predictors: (Constant), LBK, NBEK a.
Dependent Variable: Rit b.
Coefficientsa
,000 ,000 1,904 ,059
,000 ,000 ,029 ,299 ,765 ,907 1,102
,000 ,000 ,177 1,842 ,068 ,907 1,102
(Constant) NBEK LBK Model 1
B Std. Error
Unstandardized Coefficients
Beta Standardized
Coefficients
t Sig. Tolerance VIF
Collinearity Statistics
Dependent Variable: Rit a.
Collinearity Diagnosticsa
1,288 1,000 ,00 ,35 ,34
Index (Constant) NBEK LBK
Variance Proportions
Dependent Variable: Rit a.
Residuals Statisticsa
-,0009632 ,0016365 ,0003259 ,00037930 118
-,005966 ,00573893 ,00000000 ,00198307 118
-3,399 3,455 ,000 1,000 118
-2,983 2,869 ,000 ,991 118
Predicted Value Residual
Std. Predicted Value Std. Residual
Minimum Maximum Mean Std. Deviation N
Explore
Case Processing Summary
118 27,3% 315 72,7% 433 100,0%
Unstandardized Residual
N Percent N Percent N Percent
Valid Missing Total
Cases
Descriptives
,0000000 ,00018256 -,0003615
,0003615
,0000042 -,0000853 ,000 ,00198307 -,00597 ,00574 ,01170 ,00246
-,009 ,223
,813 ,442
Mean
Lower Bound Upper Bound 95% Confidence
Interval for Mean
5% Trimmed Mean Median
Variance Std. Deviation Minimum Maximum Range
Interquartile Range Skewness
Kurtosis Unstandardized Residual
Statistic Std. Error
Extreme Values
35 ,00574 28 ,00524 53 ,00430 86 ,00391 76 ,00351 68 -,00597 80 -,00510 101 -,00408 65 -,00402 91 -,00385 1
2 3 4 5 1 2 3 4 5 Highest
Lowest Unstandardized Residual
Case Number Value
Tests of Normality
,077 118 ,079 ,989 118 ,451 Unstandardized Residual
Statistic df Sig. Statistic df Sig. Kolmogorov-Smirnova Shapiro-Wilk
GLESJER
Variables Entered/Removedb
LBK,
NBEKa . Enter
Model 1
Variables Entered
Variables
Removed Method
All requested variables entered. a.
Dependent Variable: ABS_RES b.
Model Summary
,063a ,004 -,013 ,00131
Model 1
R R Square
Adjusted R Square
Std. Error of the Estimate
Predictors: (Constant), LBK, NBEK a.
ANOVAb
,000 2 ,000 ,230 ,795a
,000 115 ,000
,000 117
Regression Residual Total Model 1
Sum of
Squares df Mean Square F Sig.
Predictors: (Constant), LBK, NBEK a.
Dependent Variable: ABS_RES b.
Coefficientsa
,002 ,000 12,189 ,000
,000 ,000 -,046 -,474 ,636
4,20E-005 ,000 ,059 ,607 ,545
(Constant) NBEK LBK Model 1
B Std. Error Unstandardized
Coefficients
Beta Standardized
Coefficients
t Sig.
Regression Time
Variables Entered/Removedb
timea . Enter
Model 1
Variables Entered
Variables
Removed Method
All requested variables entered. a.
Dependent Variable: R Square b.
Model Summary
,149a ,022 -,304 ,0701104 Model
1
R R Square
Adjusted R Square
Std. Error of the Estimate
Predictors: (Constant), time a.
ANOVAb
,000 1 ,000 ,068 ,811a
,015 3 ,005
,015 4
Regression Residual Total Model 1
Sum of
Squares df Mean Square F Sig.
Predictors: (Constant), time a.
Dependent Variable: R Square b.
Coefficientsa
,129 ,074 1,757 ,177
-,006 ,022 -,149 -,262 ,811
(Constant) time Model 1
B Std. Error Unstandardized
Coefficients
Beta Standardized
Coefficients
t Sig.