Effect of 2008 and 2016 U.S Presidential Election
in the Indonesian Stock Market
Evelyn1 and Sautma Ronni Basana2
1 Finance Program, Economic Faculty, Petra Christian University ([email protected]) 2 Finance Program, Economic Faculty, Petra Christian University ([email protected])
ABSTRACT
The U.S. Presidential election was an event that received widespread attention across the globe. In the 2008 presidential campaign, Barrack Obama nominated to be the first black President. In 2016, Hillary Clinton potentially become the first woman President in American history, while the other candidate, Donald Trump, made some unpopular and controversial proposals.
The purpose of this paper is to analyze whether the 2008 and 2016 election were considered as the relevant information in the Indonesian Stock Market (IDX). The daily closing prices of all all share listed in IDX would be examined used event study method. The results provide insight about the responsiveness of IDX participants to the US Presidential election event that could be used in decision making.
Keywords : the 2008 and 2016 U.S Presidential Election, Indonesia Stock Market (IDX), Event Study
INTRODUCTION
The United States Presidential election was received widespread attention across the globe (Boomgaarden, Vliegenthart, & Vreese, 2012). As a country with dominant force in military power, economic and currency strength, investment source and destination, technology, and sociological issue, The United States president changes will have a big impact to the global market. The United States produces a quarter of the world’s goods and services and becomes the first international assistance in addressing some of the most world’s troubling issues, including global warming, global security, terrorism, refugee crisis, Middle-East war, and sustaining economic growth and prosperity (Pickering, Crocker, & Yost, 2008).
There was much speculation in the 2008 and 2016 presidential campaign as in these events, both contenders are new players on the international political scene (Boomgaarden, Vliegenthart, & Vreese, 2012). In the 2008, Barrack Obama nominated to be the first black President. In 2016, Hillary Clinton potentially become the first woman President in American history, while the other candidate, Donald Trump, made some unpopular and controversial proposals.
Indonesia is one of the countries that has many strategic relationship with The United States. U.S. bilateral goods trade with Indonesia totalled almost $27 billion in 2015, while bilateral trade in services with Indonesia exceeded $3 billion (Bureau of East Asian and Pacific Affairs, 2017). The total US investment in Indonesia is US$ 1,773 million in 2015, placed the United States as the third biggest investor in Indonesia after Singapore and Japan (Badan Pusat Statistik, 2016). Indonesia and the United States also have bilateral cooperation in political, defence and security, tourism, development, energy,
environmental, food security, education, science and technology, and marine sector (Embassy of
Indonesia, n.d). The facts above make the U.S. Presidential Election became an important issue to Indonesia.
Many previous research indicated that uncertainty during the presidential election impacted the stock market performance in many countries (see e.g., Nippani & Arize, 2005; Hung, 2011; Oehler, Walker, & Wendt, 2012; Nezerwe, 2013; Imelda, Siregar, & Anggraeni, 2014; Chandra, 2015; Kabiru, Ochieng, & Kinyua, 2015). Goodell & Vähämaa (2013) stated that the presidential election process
Wisniewski (2008) evidenced that the stock prices can adjust dramatically and stock market volatility is likely to increase around the national elections, as investors anticipate new directions in economic and redistribution policies.
The presidential elections and the stock market are popular topics for research (Wisniewski, Lightfoot, & Lilley, 2012). Foerster & Schmitz (1997) studied the effect US election cycles on international returns and found that US presidential cycles are important when determining international stock market risk premiums. Nippani & Arize (2005) explained that the capital market in Mexico and Canada had been influenced a lot, owing to the delay announcement of the winner of U.S. presidential election in 2012. Gunaasih & Nursasmito (2015) study the effects of announcement of the 2012 U.S. presidential election toward the LQ45 index in Indonesia Stock Exchange.
The purpose of this paper is to analyse the effect of 2008 and 2016 U.S. Presidential election toward the Indonesian Stock Market. Specifically, this study investigate (1) the abnormal returns during the 2008 and 2016 U.S. Presidential election and 2009 and 2017 inauguration day in the Indonesian Stock Market, and (2) the abnormal returns differences before and after the 2008 and 2016 U.S. Presidential election and 2009 and 2017 inauguration day in the Indonesian Stock Market. This study contributes to existing literature in two ways. First, it shows that the Indonesian stock markets follow U.S. presidential elections as closely as their U.S. counterparts do. Second, it provides insight about the responsiveness of Indonesian stock market participants to the US Presidential election event that could be used in decision making.
LITERATURE REVIEW
Political events are a major influence on financial markets (Pantzalis, Stangeland, & Turtle, 2000). The most powerful political event is presidential election (Hung, 2011). As the administrator of the country, president have authority to make policies, including macroeconomic policies. Uncertainty about who successfully wins an election translates into policies uncertainty and a chance that the rules of the game may change after the election (Julio & Yook, 2012).
The election of new candidate should lead to more profound changes in government policy than the re-election of an incumbent president (Oehler, Walker, & Wendt, 2013). This statement is in line with Nordhaus (1975), who was introduce the famous Political Business Cycle, stated that incumbent has a predictable pattern of policy. Market will revise their expectations to respond the uncertainty. In fact, the S&P has dropped an average of 2.8% when a two-term president leaves office (Rolph, 2016). By contrast, in years when the sitting president is up for re-election, the S&P 500 has averaged returns of 12.6% (Merrill Lynch, 2015).
During the election process, firm will change its investment behavior. Julio & Yook (2012) document evidence that political uncertainty is an important determinant of corporate financial policies around the world. In the year leading up to the election outcome, firms reduce investment expenditures by an average of 5.3% relative to non-election years. Its can be concluded that higher political uncertainty leads to lower firm investments.
Change in firms’ investment behavior will also affect investors. Hung (2011) stated that investors adjust their investment behaviors around the presidential elections. Investors’ reaction is reflected in the abnormal return. Abnormal returns is defined as the difference between the stock’s actual return and the stock’s expected return in the absence of the event. Positive abnormal return is an indicator that investor receive a good news and fell optimistic about the condition. Otherwise, negative abnormal return indicate that investor receive bad news that make them fell pessimistic.
Wong & Hooy (2016) stated that the abnormal returns of the share price are the indicator of the impact of the event. Chen, Bin, & Chen (2005) did a research about the impacts of political events in Taiwan on the stock performance and found that every political event indeed showed the existence of abnormal return.
in particular, in countries with low rankings of political, economic, and press freedom, and elections in which the incumbent loses. Wong & Hooy (2016) show that during elections, there is a significantly positive cumulative average abnormal return (CAAR) for banks in Indonesia, Malaysia and Thailand. Kabiru, Ochieng, & Kinyua (2015) analysed the stock market reaction in the 1997, 2002, 2007 and 2013 general election in Kenya. The study found that the cumulative abnormal returns (CAR) in the 2002 and 2013 general elections were insignificant, while the CAR around the 1997 and 2007 general election events were found to be significant. Research conducted by Chandra (2015) in the Indonesia Stock Exchange shows that there is abnormal return for each event during presidential election, but there is no significant difference before and after the event.
The size of the abnormal return reflects the efficiency of the market. If the market is efficient, it is impossible for the investors to achieve abnormally high returns, because security prices is fully reflecting all available information which may affect the price of the product.
In case of election, informational efficiency requires that markets absorb news and political trends into prices in anticipation of election outcomes (Pantzalis, Stangeland, & Turtle, 2000). Imelda & Hermanto Siregar (2014) stated that presidential election gives an opportunity for investors to acquire abnormal return that does not last for a long time. Altin (2015) found that price movements experienced during the election period is the evidences against the efficient market hypothesis. If the efficient market hypothesis were valid, this form of anomaly would not be experienced.
METHOD
This paper adopted event study methodology. According to Hung (2011), event-study method provides a good measure to estimate the influence of new information on stock market value. This method is based on the notion of information provided by efficient markets whereby security prices should reflect all immediate accessible information (Wong & Hooy, 2016).
We used the following steps as outlined by MacKinlay (1997) and also used by Kabiru, Ochieng, & Kinyua (2015).
Step 1: Identification of the event of interest
We have four event of interest, namely:
1.! Event 1: the 2008 election day (November 4, 2008)
2.! Event 2: the 2009 inauguration day for Obama (January 20, 2009)
3.! Event 3: the 2016 election day (November 8, 2016)
4.! Event 4: the 2017 inauguration day for Trump (January 20, 2017)
Białkowski, Gottschalk, & Wisniewski (2008) found that a strong abnormal rise starts on the Election
Day and continues for a number of days thereafter, confirming that most of the large stock market moves are concentrated around the Election Day. Altin (2015) stated that the stock prices tend to increase before the elections and tend to decrease in the aftermath of the election period. Oehler, Walker, & Wendt (2013) stated that market participants price their expectations about effects of political change into stock prices prior to an election. They will adjust their opinion according to the actual voting results and even more after the inauguration, when the incoming president discloses more details about the political road map for the presidential term.
Step 2: Definition of the event window
The event window is taken to be 5 trading days before the event and 5 trading days after the event. The estimation window is 30 days before the event window.
Step 3: Selection of the sample set of firms included in the analysis
Step 4: Prediction of a normal return during the event window
The study first computed the changes recorded in share prices to determine the actual return (Ri,t).
!",$ = &
(($− ($*+) ($*+
×100
Step 5: Estimation of the abnormal return within the event window
We use JKSE (IDX composite index) as a proxy of market return (Rm,t)
!0,$= &
(1234$− 1234$*+)
1234$*+
×100
The expected return is measured by using market adjusted model, as described by Brown & Warner
(1985). The expected return, 4 !",$ and the abnormal return (ARi,t) is calculated by the following
equation:
4 !",$ =∝ +7!0,$ ARi,t = Ri,t – E(Ri,t)
Step 6: Testing whether the abnormal return is statistically different from zero.
Test statistics was used to measure the statistical significance of the Cumulative Abnormal Returns
(CAR) for all firms – across segments in the IDX. The CAR corresponding to an event that was
happening at time t was computed as:
CARi,t = ΣARi,t
A t-test will be applied where mean CAR for all shares in each sectors were aggregated and means of the two periods, that is, before and after election date checked for significant differences. The level of significance for the t-test was 1%, 5%, and 10% (99%, 95%, and 90% confidence level). If the significance number found is less than the critical value, there exists significant difference in abnormal returns before and after the U.S Presidential elections. The conclusion is that the information content of U.S. presidential elections and inauguration day is significant to Indonesian Stock market. Otherwise the events study concludes that U.S Presidential elections and inauguration day do not influence stock returns in Indonesia.
FINDINGS
We analyzed daily closing prices of 240 companies’ share which are divided into nine sectors, primarily based on a company’s major source of revenue: 1. Agriculture (7 companies), 2. Mining (27 companies), 3. Basic Industry & Chemicals (35 companies), 4. Miscellaneous Industry (20 companies),
5. Consumer Goods Industry (16 companies), 6. Property & Real Estate (32 companies), 7.
Infrastructure, Utilities & Transportation (12 companies), 8. Finance (45 companies), and 9. Trade, Services & Investments (46 companies).
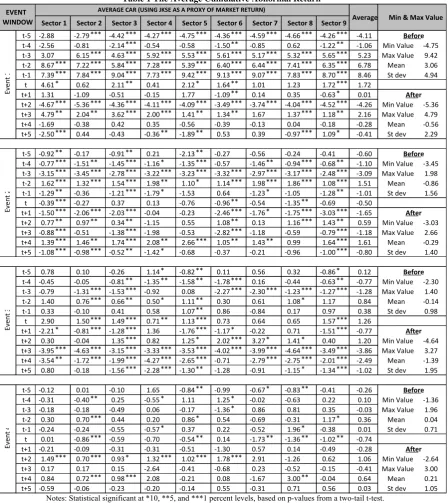
The average cumulative abnormal return of the nine sectors are provided in table 1. In Event 1, the 2008 U.S Presidential Election, the average cumulative abnormal returns range from a low -5.36 for sector 2 (mining) to a high of 9.42 for sector 5 (Consumer Goods Industry). In event 2, the 2009 inauguration day for Obama, sector 5 and sector 2 also possess the highest and the lowest return, respectively. In event 3, the 2016 election day, the highest cumulative abnormal return is in sector 7 (Infrastructure, Utilities & Transportation), while the lowest in sector 8 (Finance). In event 4, the 2017 inauguration day for Trump, the cumulative abnormal return ranges from a low -2.64 for sector 4 (Miscellaneous Industry) to a high 3.00 for sector 8 (Finance).
return in event 1), then declined to negative significant after the event. In the event 4, the cumulative abnormal return tends to be negative, in both before and after the event. Negative cumulative abnormal return indicates that the market reacts negatively against the event.
The t-statistic test shows that for all the four event, more than 50% average cumulative abnormal return in event 1, 2, and 3 is statistically significant. In event 4, most of the average cumulative abnormal return (73%) is statistically insignificant.
Table 1 The Average Cumulative Abnormal Return
Notes: Statistical significant at *10, **5, and ***1 percent levels, based on p-values from a two-tail t-test.
We only find three significant difference between the average cumulative abnormal return before and after the event. Table 2 shows that most of the t stat values for the four events’ average CAR are lower than the critical value of t table. The p values also greater than 0.05 and 0.1. The exception is only for sector 2 (mining) in event 1, sector 5 (Consumer Goods Industry) in event 2, and sector 3 (Basic Industry & Chemicals) in event 4. It appears from the results that the Indonesian market reacted in exactly the same way before and after the events.
t"5 "2.88 "2.79 *** "4.42 *** "4.27 *** "4.75 *** "4.36 *** "4.59 *** "4.66 *** "4.26 *** "4.11
t"4 "2.56 "0.81 "2.14 *** "0.54 "0.58 "1.50 ** "0.85 0.62 "1.22 ** "1.06 Min2Value "4.75 t"3 3.07 6.15 *** 4.63 *** 5.92 *** 5.53 *** 5.61 *** 5.17 *** 5.32 *** 5.65 *** 5.23 Max2Value 9.42 t"2 8.67 *** 7.22 *** 5.84 *** 7.28 *** 5.39 *** 6.40 *** 6.44 *** 7.41 *** 6.35 *** 6.78 Mean2 3.06 t"1 7.39 *** 7.84 *** 9.04 *** 7.73 *** 9.42 *** 9.13 *** 9.07 *** 7.83 *** 8.70 *** 8.46 St2dev 4.94
t 4.61 * 0.62 2.11 ** 0.41 2.12 * 1.64 ** 1.01 1.23 1.72 *** 1.72 t+1 1.31 "1.09 "0.51 "0.15 1.77 "1.09 ** 0.14 0.35 "0.63 * 0.01
t+2 "4.67 *** "5.36 *** "4.36 *** "4.11 *** "4.09 *** "3.49 *** "3.74 *** "4.04 *** "4.52 *** "4.26 Min2Value "5.36 t+3 4.79 ** 2.04 ** 3.62 *** 2.00 *** 1.41 ** 1.34 ** 1.67 1.37 *** 1.18 ** 2.16 Max2Value 4.79 t+4 "1.69 "0.38 0.42 0.35 "0.56 "0.39 "0.13 0.04 "0.18 "0.28 Mean2 "0.56 t+5 "2.50 *** 0.44 "0.43 "0.36 ** "1.89 ** 0.53 0.39 "0.97 *** 1.09 * "0.41 St2dev 2.29
t"5 "0.92 ** "0.17 "0.91 ** 0.21 "2.13 ** "0.27 "0.56 "0.24 "0.41 "0.60
t"4 "0.77 *** "1.51 ** "1.45 *** "1.16 * "1.35 *** "0.57 "1.46 ** "0.94 *** "0.68 ** "1.10 Min2Value "3.45 t"3 "3.15 *** "3.45 *** "2.78 *** "3.22 *** "3.23 *** "3.32 *** "2.97 *** "3.17 *** "2.48 *** "3.09 Max2Value 1.98 t"2 1.62 *** 1.32 *** 1.54 *** 1.98 ** 1.10 * 1.14 *** 1.98 *** 1.86 *** 1.08 *** 1.51 Mean2 "0.86 t"1 "1.29 ** "0.36 "1.21 *** "1.79 * "1.53 0.64 "1.23 * "1.05 "1.28 ** "1.01 St2dev 1.56
t "0.39 *** "0.27 0.37 0.13 "0.76 "0.96 ** "0.54 "1.35 ** "0.69 "0.50 t+1 "1.50 *** "2.06 *** "2.03 *** "0.04 "0.23 "2.46 *** "1.76 * "1.75 *** "3.03 *** "1.65
t+2 0.77 ** 0.97 ** 0.34 ** "1.15 0.55 1.08 ** 0.13 1.16 *** 1.43 ** 0.59 Min2Value "3.03 t+3 "0.88 *** "0.51 "1.38 *** "1.98 "0.53 "2.82 *** "1.18 "0.59 "0.79 *** "1.18 Max2Value 2.66 t+4 1.39 *** 1.46 ** 1.74 *** 2.08 ** 2.66 *** 1.05 ** 1.43 ** 0.99 1.64 *** 1.61 Mean2 "0.29 t+5 "1.08 *** "0.98 *** "0.52 ** "1.42 * "0.68 "0.37 "0.21 "0.96 "1.00 *** "0.80 St2dev 1.40
t"5 0.78 0.10 "0.26 1.14 * "0.82 ** 0.11 0.56 0.32 "0.86 * 0.12
t"4 "0.45 "0.05 "0.81 ** "1.35 ** "1.58 ** "1.78 *** 0.16 "0.44 "0.63 ** "0.77 Min2Value "2.30 t"3 "0.79 "1.31 *** "1.53 *** "0.92 0.08 "2.27 *** "2.30 *** "1.23 *** "1.27 *** "1.28 Max2Value 1.40 t"2 1.40 0.76 *** 0.66 ** 0.50 * 1.11 ** 0.30 0.61 1.08 * 1.17 0.84 Mean2 "0.14 t"1 0.33 "0.10 0.41 0.58 1.07 ** 0.86 "0.84 0.17 0.97 0.38 St2dev 0.98
t 2.90 1.50 *** 1.49 *** 0.71 ** 1.13 *** 0.73 0.64 0.65 1.57 *** 1.26 t+1 "2.21 * "0.81 *** "1.28 *** 1.36 "1.76 *** "1.17 * "0.22 0.71 "1.51 *** "0.77
t+2 0.30 "0.04 1.35 *** 0.82 1.25 * 2.02 *** 3.27 * 1.41 * 0.40 1.20 Min2Value "4.64 t+3 "3.95 *** "4.63 *** "3.15 *** "3.33 *** "3.53 *** "4.02 *** "3.99 *** "4.64 *** "3.49 *** "3.86 Max2Value 3.27 t+4 "3.54 ** "1.72 *** "1.99 *** "4.27 *** "2.65 *** "0.71 "2.79 *** "2.75 *** "2.01 *** "2.49 Mean2 "1.39 t+5 0.80 "0.18 "1.56 *** "2.28 *** "1.30 ** "1.28 "0.91 "1.15 * "1.34 *** "1.02 St2dev 1.95
t"5 "0.12 0.01 "0.10 1.65 "0.84 ** "0.99 "0.67 * "0.83 ** "0.41 "0.26
t"4 "0.31 "0.40 ** 0.25 "0.55 * 1.11 1.25 * "0.02 "0.63 0.22 0.10 Min2Value "1.36 t"3 "0.18 "0.18 "0.49 0.06 "0.17 "1.36 * 0.86 0.81 0.35 "0.03 Max2Value 1.96 t"2 0.30 0.70 *** 0.44 0.20 0.86 * 0.54 "0.69 "0.31 1.17 * 0.36 Mean2 0.04 t"1 "0.24 "0.24 "0.55 "0.57 * 0.37 0.22 "0.52 1.96 * "0.38 0.01 St2dev 0.71
t 0.01 "0.86 *** "0.59 "0.70 "0.54 ** 0.14 "1.73 ** "1.36 ** "1.02 ** "0.74 t+1 "0.21 "0.09 "0.31 "0.31 "0.51 "1.30 0.57 0.14 "0.49 "0.28
t+2 1.49 *** 0.70 *** 0.93 * 1.32 *** 1.02 *** 1.78 *** 2.91 "1.26 0.62 1.06 Min2Value "2.64 t+3 0.17 0.17 0.15 "2.64 "0.41 "0.68 0.23 "0.52 "0.15 "0.41 Max2Value 3.00 t+4 0.84 0.72 *** 0.98 *** 2.08 "0.21 0.08 "1.67 3.00 ** "0.04 0.64 Mean2 0.21 t+5 "0.59 "0.06 "0.23 "0.20 "0.14 0.55 "0.31 0.71 0.56 0.03 St2dev 1.05
Table 2 Paired- Sample t-test
Note:
Critical values of t for two tailed test, df = 4, significance level = 5% is 2.776 Critical values of t for two tailed test, df = 4, significance level = 10% is 2.13
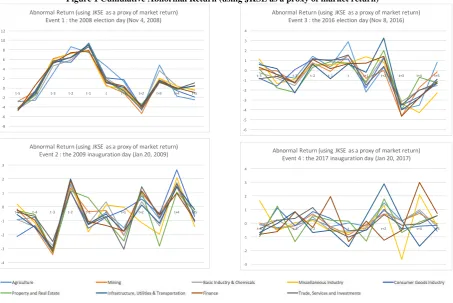
As presented in figure 1, the abnormal return for all share in nine sectors on average move in synchronicity during the event 1, 2, and 3. In event 4, the abnormal returns have more variation. All the sectors have experienced a fluctuation in cumulative abnormal return before and after the events. Generally, in event 1 and event 3 (election day), the cumulative abnormal return tends to be lower after the event, while in event 2 and 4 (inauguration day), it steadily rises after the event. However, the biggest cumulative abnormal return occurs before the event 1.
Figure 1 Cumulative Abnormal Return (using JKSE as a proxy of market return)
CONCLUSION
It can be concluded that there are abnormal returns during the 2008 and 2016 U.S. Presidential election and 2009 and 2017 inauguration day in the Indonesian Stock Market. However, there is no abnormal returns differences before and after the event. In other words, it can be said that the 2008 and 2016 US presidential election, and 2009 and 2017 inauguration day, affect investor’s profit rate in Indonesian Stock Market. The results of this study are consistent with Chandra (2015), Chen, Bin, & Chen (2005), Kabiru, Ochieng, & Kinyua (2015), Pantzalis, Stangeland, & Turtle (2000), and Wong & Hooy (2016) that found abnormal return during the election period.
t"stat t"stat t"stat t"stat
1":"Agriculture" 1.11 0.33 01.18 0.30 1.78 0.15 01.21 0.29
2":"Mining" 2.61 0.06 * 00.66 0.54 2.05 0.11 01.48 0.21
3":"Basic"Industry"&"Chemicals" 1.27 0.27 01.17 0.31 1.21 0.29 02.41 0.07 *
4":"Miscellaneous"Industry" 1.73 0.16 01.15 0.31 1.26 0.28 0.11 0.92
5":"Consumer"Goods"Industry" 1.27 0.27 05.96 0.00 * 1.29 0.27 1.36 0.25
6":"Property"&"Real"Estate" 1.78 0.15 0.35 0.75 0.44 0.68 00.66 0.54
7":"Infrastructure,"Utilities"&"Transportation" 1.48 0.21 00.88 0.43 0.52 0.63 00.78 0.48
8":"Finance" 1.64 0.18 00.60 0.58 1.16 0.31 00.25 0.82
9":"Trade,"Services"&"Investments 1.86 0.14 00.49 0.65 1.96 0.12 0.24 0.82
REFERENCES
Altin, H. (2015). Efficient Market Hypothesis, Abnormal Return and Election Periods. European
Scientific Journal, 11 (34), 169-178.
Badan Pusat Statistik. (2016, 10 18). Realisasi Investasi Penanaman Modal Luar Negeri Menurut
Negara. Retrieved 01 27, 2017, from Website Badan Pusat Statistik: https://www.bps.go.id/linkTabelStatis/view/id/1319
Białkowski, J., Gottschalk, K., & Wisniewski, T. P. (2008). Stock market volatility around national
elections. Journal of Banking & Finance, 32, 1941–1953.
Boomgaarden, H. G., Vliegenthart, R., & Vreese, C. H. (2012). A Worldwide Presidential Election:
The Impact of the Media on Candidate and Campaign Evaluations. International Journal of Public
Opinion Research, 24 (1), 42-61.
Brown, S. J., & Warner, J. B. (1985). Using Daily Stock Returns: The Case of Event Studies. Journal of Financial Economics, 14, 3-31.
Bureau of East Asian and Pacific Affairs. (2017, 01 17). U.S. Relations With Indonesia Fact Sheets.
Retrieved 01 27, 2017, from U.S. Department of State - Diplomacy in Action: https://www.state.gov/r/pa/ei/bgn/2748.htm
Chandra, T. (2015). Impacts of Indonesia’s 2014 Presidential Election towards Stock Priceso
Indonesia Stock Exchange . International Journal of Business and Management, 10 (7), 172-183.
Chen, D.-H., Bin, F.-S., & Chen, C.-D. (2005). The Impacts of Political Events on Foreign
Institutional Investors and Stock Returns: Emerging Market Evidence from Taiwan. International
Journal of Business, 10 (2), 166-188.
Embassy of Indonesia. (n.d). Indonesia-U.S. Relations: Bilateral Relations. Retrieved 01 27, 2017,
from Embassy of the Republic of Indonesia Washington DC: http://www.embassyofindonesia.org/wordpress/?page_id=516#
Foerster, S. R., & Schmitz, J. J. (1997). The Transmission of U.S. Election Cycles to International
Stock Returns. Journal of International Business Studies, 28 (1), 1-27.
Goodell, J. W., & Vähämaa, S. (2013). US presidential elections and implied volatility: The role of
political uncertainty. Journal of Banking & Finance, 37, 1108-1117.
Gunaasih, S. A., & Nursasmito, I. (2015). The Evaluation of Non-Economic Events towards the
LQ-45 Index in Indonesia Stock Exchange by Using Event Study Method. Review of Integrative
Business & Economics Research, 4 (2), 106-120.
Hung, L.-C. (2011). The Presidential Election and the Stock Market in Taiwan. Journal of Business
and Policy Research, 6 (2), 36-48.
Imelda, & HErmanto Siregar, L. A. (2014). Abnormal Returns and Trading Volume in the Indonesian Stock Market in Relation to the Presidential Election in 2004, 2009, and 2014. International Journal of Administrative Science & Organization, 21 (2), 65-76.
Julio, B., & Yook, Y. (2012). Political uncertainty and corporate investment cycles. Journal of
Kabiru, J. N., Ochieng, D. E., & Kinyua, H. W. (2015). The Effect of General Elections on Stock
Returns at The Nairobi Securities Exchange. European Scientific Journal, 11 (28), 435-460.
MacKinlay, A. C. (1997). Event Studies in Economics and Finance. Journal of Economic
Literature, 35 (1), 13-39.
Merrill Lynch. (2015, 12 15). Investing: How Presidential Elections Affect The Markets. Retrieved
02 07, 2017, from Forbes: http://www.forbes.com/sites/merrilllynch/2015/12/15/how-presidential-elections-affect-the-markets/#1c49c12e5c7d
Nezerwe, Y. (2013). Presidential Elections and Stock Returns in Egypt . Review of Business and
Finance Studies , 4 (2), 63-68.
Nippani, S., & Arize, A. C. (2005). U.S. Presidential Election Impact on Canadian and Mexican
Stock Markets. Journal of Economics and Finance, 29 (2), 271-279.
Nordhaus, W. D. (1975). The Political Business Cycle. Review of Economic Studies, 42, 169-190.
Oehler, A., Walker, T. J., & Wendt, S. (2013). Effects of Election Results on Stock Price
Performance: Evidence from 1976 to 2008. Managerial Finance, 39 (8), 714 - 736.
Pantzalis, C., Stangeland, D. A., & Turtle, H. J. (2000). Political elections and the resolution of
uncertainty: The international evidence. Journal of Banking & Finance, 24, 1575-1604.
Pickering, T. R., Crocker, C. A., & Yost, C. A. (2008). America’s Role in the World: Foreign
Policy Choices for the Next President. Edmund A. Walsh School of Foreign Service, Institute for the Study of Diplomacy. Washington, D.C. : Georgetown University.
Rolph, D. (2016, 10 26). Advisor Network: How Presidential Elections Affect The Markets.
Retrieved 02 07, 2017, from Forbes: http://www.forbes.com/sites/duncanrolph/2016/10/26/how-president-elections-affect-the-markets/#76ef8e3f2d72
Wisniewski, T. P., Lightfoot, G., & Lilley, S. (2012). Speculating on Presidential Success:
Exploring the Link between the Price-Earnings Ratio and Approval Ratings. Journal of Economics
and Finance, 36, 106–122.
Wong, W.-Y., & Hooy, C.-W. (2016). The Impact of Election on Stock Market Returns of
Government-Owned Banks: The Case of Indonesia, Malaysia and Thailand. Asian Journal of