Article
Factors Decomposition of
Indonesia’s
Household
Electricity Consumption
Yusak Tanoto
1,*
and Maria Praptiningsih
21 Electrical Engineering Department, Petra Christian University, Surabaya 60236, Indonesia 2 Business Management Program, Petra Christian University, Surabaya 60236, Indonesia
*
E-mail: tanyusak@petra.ac.id (Corresponding author)Abstract. Household sector has been ranked the largest electricity share over decades in Indonesia. As response to the ever growing power demand in this sector, corresponding energy policies should be appropriately formulated based on the understanding of the past electricity consumption in household sector. This paper presents a study of factors decomposition of Indonesia’s household annual electricity consumption for the period 2000 – 2010 using Additive-Logarithmic Mean Divisia Index (Additive – LMDI) method considering current and constant pricing reference. Given a total of 29,285.2 GWh electricity consumption, production effect contributed for 75.2%, under the constant price or far less compared with that obtained under current price, or with 224.3%. Contributions of the electrified household to the total output of national economy were 19.5% and 13.7%, using constant price and current price, respectively. Meanwhile, the efficiency effect was also contributed for a total positive electricity consumption growth with 5.3% under the constant price. In contrast, the same effect was contributed an opposite direction with a decrease of 138% under the current price. Nevertheless, the
intensity effect was still contributed toward a positive household’s electricity growth, given
the efficiency improvement was failed to decrease the total change during the study period.
Keywords: Factors decomposition, household electricity consumption, activity effect, structural effect, intensity effect.
ENGINEERING JOURNAL Volume 17 Issue 2 Received 23 August 2012
Accepted 14 November 2012 Published 1 April 2013
1.
Introduction
For many countries, energy sector development and economic growth is interdependence. A well-developed power sector in terms of improving power supply facility as well as increasing demand are commonly triggered by the positive changes of economic macro indicators. The immediate concern is then how to allocate sufficient resources to powering the needs of electricity demand, which is in turn supporting economic growth. The needs of having a clear understanding on how electricity is consumed in each sector are unavoidable due to global economic competition. Resources scarcity is one of prominent driving factor that spur efficiency in using resources on power sector. The appropriate policy could be ascertained to match the needs only if the indicators’ effect toward the demand growth could be revealed. Household is seen as one of important power sector customer that highly contributes to the ever growing energy utilization and power sector expansion.
Only few studies related with the factors decomposition in the household energy utilization have been reported. Haas [1] used the Laspeyres decomposition method to find the energy intensity indicators of the residential sector. Later on, Pachauri and Muller [2] used the index decomposition method to understand the relative importance of changes in the size of population and households, increases in connectivity, and changes in level of consumption per connected household in rural and urban sector across India. In 2009, Achão and Schaeffer [3] applied the LMDI decomposition technique to explain the electricity evolution of the Brazilian residential sector in terms of the activity, structure and intensity effects. In 2011, Lotz and Blignaut [4] conducted a decomposition analysis to determine the significance of production changes, changes in the structure of economy and the efficiency
improvement of the South Africa’s total electricity consumption. The annual changes in the contribution of the factors to total electricity consumption were first considered, followed by a sectoral decomposition analysis. Meanwhile, a four – term of energy intensity decomposition of Hong Kong residential sector is conducted by Chung, et al. [5] using LMDI method. They evaluated the respective contributions of changes in the number of households, share of different types of residential households, efficiency gains, and climate condition. Australian energy intensity in the residential sector in terms of decomposition of changes in energy consumption is reported by Petchey [6]. Wang et al. [7] developed extended decomposition models based on LMDI to study energy-related carbon emission in the household sector of Guangdong Province, China. It is concluded from the study that the two most effective approaches to reduce carbon emissions for Guangdong province are by optimizing the energy mix and developing low-carbon technologies. Important findings revealed from those studies may give ideas on how electricity consumption in the respective country is influenced and developed. Although LMDI method is currently used in most of the factor decomposition studies, none of the aforementioned papers employed different based price to observe the contributing effects obtained from the analysis.
A factors decomposition analysis of Indonesian household annual electricity consumption for the period 2000 – 2010 using Additive – LMDI method is conducted in this study to find factors affecting Indonesian power sector evolution, particularly in the household sector. Both constant and current price are used in the analysis. Moreover, although there are numerous energy decomposition studies, this paper is
the first paper focused on the case of Indonesia’s household electricity use. This paper is organized as follows. Overview of Indonesian power sector is briefly described in section 2, including the elaboration of electricity in the household sector and its comparison with other countries. Section 3 describes research methodology in terms of proposed LMDI formulations for production, structural, and efficiency effects. Subsequently, result and discussion are presented in section 4. This paper is concluded in section 5.
2.
Indonesia’s
Power Sector
2.1. Overview
was 26,895 MW, with the total production and grid losses of 169,786 GWh and 9.7%, respectively [8]. The PLN installed capacity in 2010 based on the plant type is presented in the following table.
Table 1. PLN’s power plants installed capacity in 2010 [9].
Power Plant Type Installed Capacity (MW)
Geothermal 438.75 Gas turbine 3,223.68 Diesel + Diesel gas + Sun + wind 3,307.16
Hydro 3,522.57
Combined cycle 6,951.32
Steam 9,451.50
Total 26,894.98
Besides, Independent Power Producer (IPP) has strengthened the national capacity with 4,761 MW. The 2010 PLN electricity sales of 147,297 GWh was a 9.45% increase from 2009’s 134,581 GWh. It rose significantly in all customer groups, particularly household and industry [8]. Among which, 113,400 GWh or 77% are consumed by the most populous islands, Java-Madura-Bali, which belong to the largest grid interconnection system in Indonesia. Indonesian electricity customers are divided into four groups, in addition to household and industry sector, others are commerce and public. As reported, commercial sector ranked first with average growth of 10.45% on 2006 – 2010 electricity sales, followed by household and industry with 9.14% and 3.86%, respectively [8]. In 2010, the largest source of the electric power sales revenue still comes from the industry and household.
2.2. Household Electricity
As of 2010, the number of PLN’s household customer was 39.32 million or 92.67% of the total PLN’s customers. The household sector consumed 59,824 GWh or nearly 41% of the total national electricity consumption. Household customers are divided into three sub-sectors based on their tariff category, since
1999. The “R-1” category are those with connected capacity up to 2,200 VA whereas “R-2” and “R-3” are
those with connected capacity up to 6,600 VA and beyond, respectively. The “R-1” category is dominated with almost 90% of electricity consumption among other categories. With the growth of total number of household customers from 39.32 million at the end of 2010 to 45.83 million at the end of 2011, the electrification ratio reached around 71.23% at the end of 2011 [10].
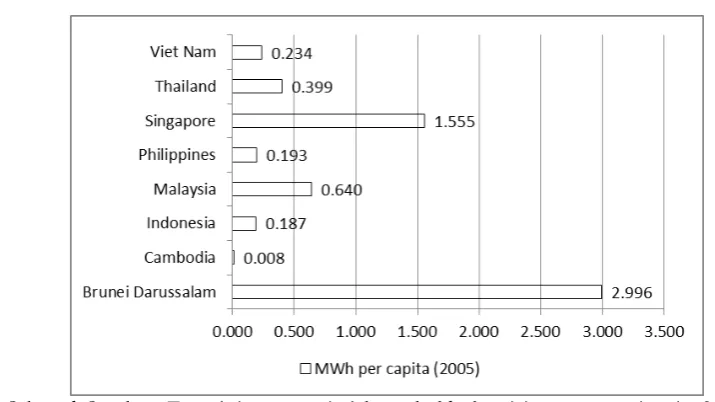
Countries’ household electricity consumption can be compared based on [11] and [12]. Selected South East Asian household electricity-final consumption in 2009 and per capita electricity consumption in 2005 are presented in Fig. 1 and Fig. 2, respectively.
Fig. 2. Selected South – East Asian countries’ household electricity consumption in 2005 (MWh per capita).
From Fig. 1 and Fig. 2, we can see that despite of the large amount of Indonesia’s household electricity consumption due to the largest number of electrified households, its per capita electricity consumption is relatively low among most other South East Asian countries.
3.
Research Methodology
3.1. Proposed Equation and Data
In order to conduct factors decomposition of electricity consumption in the Indonesian household sector, the general equation for household energy decomposition is initially constructed as follows:
it it t
i e s Y
E (1)
t
t it
it it
i Y
Y Y
Y E
E (2)
Here, Ytis GDP for year t, expressed in million Rupiah. In Indonesia, GDP is officially determined in two
ways, by using output approach or expenditure approach, all of which, in principle, give the same result. Regarding to the household electricity consumption, using expenditure approach shall be more appropriate than using output approach because electricity is purchased as part of household expenditure that in turn, is determined by the total household income, which is also quite commonly used in other country. The Indonesian Statistical Office as well as Central Bank defines household expenditure as household final consumption expenditure. Hence, using the expenditure approach Yit is defined as the household final
consumption expenditure for year t.
it it Y E
is energy intensity of household sector for year t, expressed in
MWh/million Rupiah,
t it Y Y
is the ratio between household final consumption expenditure for year t and Gross Domestic Product (GDP). Nevertheless, for the whole country, Eq. (2) would be suitable with a precondition that the country’s electrification ratio is 100%. In GDP calculation, Yit is determined from all
households; regardless they are electrified or not whereas household electricity consumption is calculated solely based on electrified household. In this sense, all electricity consumption Eit is accounted from all
household in that country, where all households are powered. Here, eit will be affected, which is household
electricity intensity. The proper eit should then be determined based on household electricity consumption,
Problem may occur in determining household electricity intensity for country’s holding electrification ratio less than 100% like Indonesia. Household electricity consumption is accounted from households connected to the utility grid only but on the other hand, household final consumption expenditure is calculated based on all households, whether electrified or not. Therefore, a slightly modification in terms of
it
Y is proposed for household sector with less than 100% electrification ratio as:
it
In Eq. (3), household final consumption expenditure as part of household energy intensity is adjusted. It should be noted that the adjusted Yitis used to represent the fact that not all households in a country are electrified. Since there is no measurement or data of “electrified-household final consumption expenditure” officially provided, the term adjusted Yitis used as approximation purpose to represent electrified-household
final consumption expenditure, which is here defined as the ratio between the number of PLN’s household customer for year t
Helectt
and the total number of household for year t
Ht or country’s rate ofelectrification ratio multiply with GDP for year t. In its physical meaning, adjusted Yitcan be understood as the proportion of household expenditure taken into account electrified-household final consumption expenditure which is, also serve as share of total household income represented electrified-households.
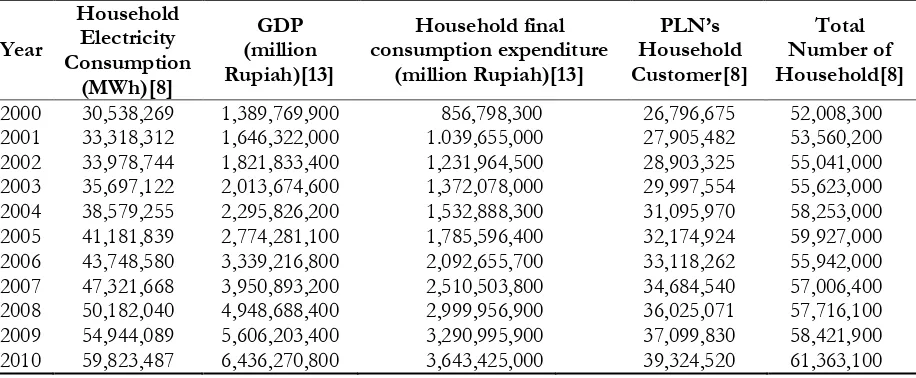
In accordance with Eq. (3) and Eq. (4), several data of which consists of annual household electricity
consumption, GDP, private expenditure, total number of household, and number of PLN’s household
customer, are presented in Table 2. Both GDP and household final consumption expenditure are taken as current price. Based on available data, adjusted Yitis then calculated according to Eq. (3).
Table 2. Data required for conducting Indonesian household electricity decomposition.
Year
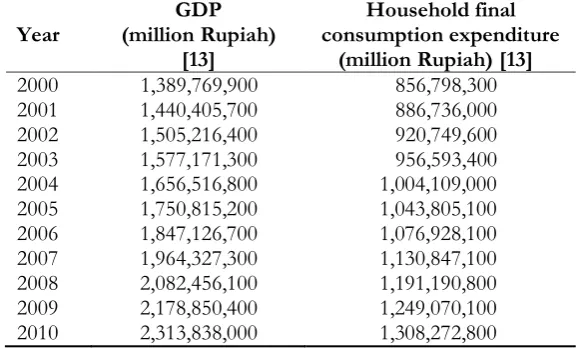
Table 3. GDP and household final consumption expenditure expressed in constant price 2000. electricity consumption over the past decade. Moreover, determination in the study period refers to the ten years basis of planning on electricity provision, which is annually published by PLN.
3.2. Additive-LMDI
Index decomposition analysis can be done through two broad methods: those linked to Laspeyres index and those linked to Divisia index. The Divisia index is a weighted sum of logarithmic growth rates, where
the weights are the components’ shares in total value, given in the form of a line integral [4]. LMDI method, of which belong to methods linked to Divisia index, is preferred to be applied in this study. As the key references originally proposed by Ang [14] and further explained in [15], this method is later on used by many researchers in the study of energy and carbon decomposition because of several advantages compared with other methods, such as derived from a solid theoretical foundation, well adapted, ease of use, perfect decomposition, among others [4, 16, 17]. Specifically, additive-LMDI is chosen in this study
because its “difference” change is decomposed. The method presents symmetry between decomposition of changes in terms of ratio or differences, which means that it gives the same results. Moreover, additive-LMDI is applied due to ease of use and ease of result interpretation. Using additive-additive-LMDI, change in household electricity consumption between year t and year t– 1 can be determined as [15]:
int str acttot Et Et E E E E
1 (5)
where Eint denotes change in energy intensity, Estr indicates structural change, and Eact indicates
change in activity, which is changes in output or GDP. Changes in energy intensity can be represented by
the efficiency effect, which may be related with the household’s energy efficient-technology implementation effect. Structural change refers to the change of electrified household output share against the whole output. If the change of the number of electrified household increased in proportion to other power sector customers, then the change is in turn contributing to the increase of household electricity consumption. Meanwhile, change in activity, which is reflecting production output of the whole sector, can be expressed as production effect. In additive-LMDI and based on Eq. (1), the above-mentioned changes are defined as:
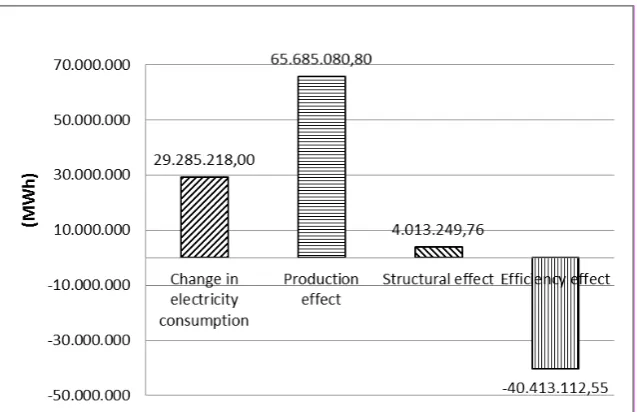
It is known that Indonesia’s household electricity consumption has significantly increased from 2000 to 2010, which amounts to a total increase of 29,285,218 MWh, or nearly 100%. Results of the decomposition analysis using Additive – LMDI are presented in Table 4 and Table 5, based on constant price (2000) and current price, respectively. Despite the difference of pricing reference, activity changes have shown its dominant contribution toward the total increase of household electricity consumption, using both constant and current based price, respectively. Meanwhile, Fig. 3 and Fig. 4 depict share of production, structural, and efficiency effect, for the case of constant and current price, respectively.
Table 4. Indonesia’s household electricity consumption decomposition: 2000 – 2010 (constant price 2000).
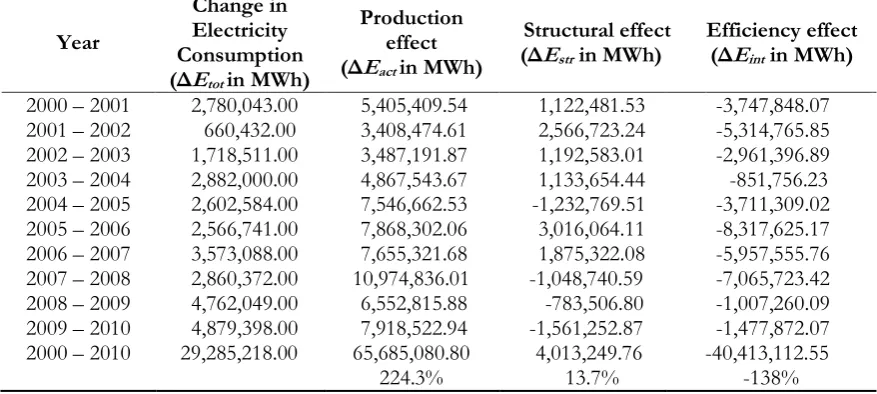
Table 5. Indonesia’s household electricity consumption decomposition: 2000 – 2010 (current price).
Fig. 3. Production, structural, and efficiency effect in the period 2000 – 2010 (constant price 2000).
Fig. 4. Production, structural, and efficiency effect in the period 2000 – 2010 (current price).
Applying two pricing references, results obtained from the analysis have shown the huge differences in terms of the share of three effects to the total change in electricity consumption as well as changes of electricity intensity level. Production effect contributed for 22,021,829.44 MWh (or 75.2%) to the total increase of household electricity consumption, under the constant price reference, or far less compared with that obtained under current price, which account for 65,685,080.80 MWh (or 224.3%). If we take a closer look into the household sector itself, we find that the contribution of electrified household to the total output of national economy, here defined as structural effect, were 19.5% and 13.7%, using constant price and current price, respectively. Furthermore, the efficiency effect, under constant price, was also contributed for a total positive electricity consumption growth with 5,712,597.10 MWh, or 5.3% share. In contrast, the same effect was contributed an opposite direction with a decrease of 40,413,112.55 MWh or -138% under the current price, in the total change for the period 2000 – 2010.
the role to slowing down the total change of household electricity consumption. The positive but rather slow growth rate of GDP as well as private expenditure has caused the changes both in structural and efficiency effect having a positive growth share, in aggregate. Meanwhile, the growth rate of energy intensity using two different pricing methods are both mathematically correct although it may lead into different interpretation.
Based on current based price as used in Eq. (2) to Eq. (4) and from Table 2, the eitis found gradually
lesser over the study period, started with 0.0692 in 2000 and finally 0.0256 in 2010 resulted consistent negative values of ΔEint.Here, the results should be carefully interpreted as we should see that that the
energy intensity is becoming worsened as more money have to be spend in consuming electricity yet in higher growth rate compared to that shown by the electricity consumption growth itself. Hence, we can’t simply consider that the total negative changes in intensity effect were due to efficiency improvement although it shares a decreasing growth towards the total electricity change. Using analysis involving constant based price, we can see that the values of ΔEint is found considerably small-positive in total, as it consists of
mixed positive as well as negative ΔEint over the study period. Based on Table 4, the energy intensity is
found quite well in some years as it is marked with negative values. In this regard, we can imply that, in general, the role of efficiency improvement such as in household’s appliances and lighting system to lower electricity consumption is quite insignificant since the ΔEint was still positive. In other word, the intensity
effect was still contributed toward a positive Indonesia’s household electricity growth, given the efficiency improvement was failed to decrease the total change during the study period.
Pro or contra may arise from using different based price, especially when comparison between two different periods is made like what presented in this paper. It is difficult to directly compare the consumption and grasp the change because consumption consists of two variances, price and quantity. It is therefore indices are generally used to compare prices or quantity at different periods by fixing quantities or prices. Constant price GDP measures value expressed in the prices of a particular year, known as the base period. It is calculated by adjusting nominal values for price changes. By expressing current price series in constant prices, the price and volume components can be analyzed separately. In the case of energy decomposition, changes in volume as well as in relative prices are captured through the analysis using current price based – LMDI whereas only volume changes can be captured using constant price based. However, due to price change, comparing energy consumption change over two periods can be misleading. For instance, negative value of intensity effect can be occurred due to inflation. Since the current based price is essentially used to construct nominal GDP i.e. to determine the total value during a particular year, factors decomposition using current based price is applied to determine factors affecting household energy consumption in that particular year. On contrary, comparison of household energy consumption changes in one year with past years and determination of total effect contributed toward the energy changes over a study periods, is focused on volume, i.e. amount of energy changes. Therefore, the use of constant based price – LMDI should be more appropriate.
5.
Concluding Remarks
This paper presents the factors decomposition of Indonesia’s household electricity consumption during 2000 – 2010. The Additive-LMDI has been used as the preferred analysis method considering the constant and current pricing reference. Based on the results considering the two pricing reference, it is obvious that the positive household electricity consumption growth is affected by three factors. Unlike other countries, Indonesia’s household electricity decomposition was characterized by a small-positive growth on the intensity effect, under the constant price-economic data. Moreover, it is revealed from the analysis that the contribution of energy efficient-technology should be increased for the case of Indonesia’s household sector so that the electricity consumption could substantially be reduced. Regarding to power sector policies, some strategic programs such as power system expansion, efficient-technology deployment, and electrification ratio improvement shall become a primary focus. Nevertheless, comparison of results obtained by Additive-LMDI with other decomposition method is not discussed in this paper since the main focus of the study is to obtain factors effecting total household’s electricity changes using the preferred method.
turn, revealed and compared each other. In turn, power sector strategy related to the household electricity utilization could be better planned. In addition, failure of efficiency changes to decrease the total electricity change will be further examined.
Acknowledgement
The authors express his gratitude to the Institute of Research and Community Outreach Petra Christian University for providing grant to conduct this research under Contract No. 02/Sugas-Pen/LPPM-UKP/2011. The authors would also like to convey their thankfulness to the utility and statistics office for their valuable help in providing relevant data. In addition, the authors would like to thank anonymous reviewers of the journal for providing helpful comments in an earlier version of the paper. However, the authors only are responsible for any remaining error in the paper.
References
[1] R. Haas, “Energy efficiency indicators in the residential sector,” Energy Policy, vol. 25, no. 7-9, pp. 789-802, Jun-Jul, 1997.
[2] S. Pachauri and A. Muller. (2008). Regional decomposition of domestic electricity consumption in India: 1980-2005
[Online]. Available: http://www.iiasa.ac.at/Research/PCC/recent-events/Pachauri&Mueller_Istanbul_June 2008_Final.pdf
[3] C. Achão and R. Schaeffer, “Decomposition analysis of the variations in residential electricity consumption in Brazil for the 1980-2007 period: Measuring the activity, intensity and structure effects,” Energy Policy, vol. 37 no. 12, pp. 5208-5220, Dec, 2009.
[4] R. I. Lotz and J. Blignaut, “South Africa’s electricity consumption: A sectoral decomposition analysis,”
Applied Energy, vol. 88, no. 12, pp. 4779-4784, Dec, 2011.
[5] W. Chung, M. S. Kam, and C. Y. Ip, “A study of residential energy use in Hong Kong by decomposition analysis 1990-2007,”Applied Energy, vol. 88, no. 12, pp. 5180-5187, Dec, 2011.
[6] R. Petchey, “End use energy intensity in the Australian economy,” ABARE–BRS, Canberra, Australia, Research Rep. No. 10.08, 2010.
[7] W. X. Wang, Y. Kuang, and N. Huang, “Study on the decomposition of factors affecting energy -related carbon emissions in Guangdong province, China,” Energies, vol. 4, pp. 2249-2272, Dec, 2011. [8] S. Corporate, “PLN Statistics 2010,” PT. PLN (Persero), Jakarta, Indonesia, 2011.
[9] S. Corporate, “PLN Annual Report 2010,” PT. PLN (Persero), Jakarta, Indonesia, 2011.
[10] S. Corporate, “PLN Statistics 2010,” PT. PLN (Persero), Jakarta, Indonesia, 2012.
[11] United Nations Statistics Division (2012). 2009 Energy Balances and Electricity Profiles [Online]. Available: http://unstats.un.org/unsd/energy/balance/default.htm
[12] Nation Master (2012). Consumption by Households (per capita) (Most Recent) by Country [Online]. Available: http://www.nationmaster.com/graph/ene_ele_con_by_hou_percap-electricity-consumption-house holds-per-capita
[13] Bank Indonesia (2010). Special Data Dissemination Standard [Online]. Available: http://www.bi.go.id/ sdds/series/NA/index_NA.asp
[14] B. W. Ang, “Decomposition analysis for policy making in energy: Which is the preferred method?”
Energy Policy, vol. 32, no. 9, pp. 1131-1139, Jun, 2004.
[15] B. W. Ang, “The LMDI approach to decomposition analysis: A practical guide,”Energy Policy,vol. 33, no. 7, 2005, pp. 867-871, May, 2005.
[16] B. W. Ang and F. L. Liu, “A new energy decomposition method: Perfect in decomposition and consistent in aggregation,”Energy, vol. 26, no. 6, pp. 537-548, Jun, 2001.
![Table 1. PLN’s power plants installed capacity in 2010 [9].](https://thumb-ap.123doks.com/thumbv2/123dok/1559297.2049418/3.595.138.459.539.731/table-pln-s-power-plants-installed-capacity.webp)