Jordan Tigani
Siddartha Naidu
BigQuery
Published by John Wiley & Sons, Inc. 10475 Crosspoint Boulevard Indianapolis, IN 46256 www.wiley.com
Copyright © 2014 by John Wiley & Sons, Inc., Indianapolis, Indiana Published simultaneously in Canada
ISBN: 978-1-118-82482-5 ISBN: 978-1-118-82487-0 (ebk) ISBN: 978-1-118-82479-5 (ebk)
Manufactured in the United States of America 10 9 8 7 6 5 4 3 2 1
No part of this publication may be reproduced, stored in a retrieval system or transmitted in any form or by any means, electronic, mechanical, photocopying, recording, scanning or otherwise, except as permitted under Sections 107 or 108 of the 1976 United States Copyright Act, without either the prior written permission of the Publisher, or autho-rization through payment of the appropriate per-copy fee to the Copyright Clearance Center, 222 Rosewood Drive, Danvers, MA 01923, (978) 750-8400, fax (978) 646-8600. Requests to the Publisher for permission should be addressed to the Permissions Department, John Wiley & Sons, Inc., 111 River Street, Hoboken, NJ 07030, (201) 748-6011, fax (201) 748-6008, or online at http://www.wiley.com/go/permissions.
Limit of Liability/Disclaimer of Warranty: The publisher and the author make no representations or warranties with respect to the accuracy or completeness of the contents of this work and specifi cally disclaim all warranties, including without limitation warranties of fi tness for a particular purpose. No warranty may be created or extended by sales or promotional materials. The advice and strategies contained herein may not be suitable for every situation. This work is sold with the understanding that the publisher is not engaged in rendering legal, accounting, or other professional services. If professional assistance is required, the services of a competent professional person should be sought. Neither the publisher nor the author shall be liable for damages arising herefrom. The fact that an organization or Web site is referred to in this work as a citation and/or a potential source of further information does not mean that the author or the publisher endorses the information the organization or website may provide or recommendations it may make. Further, readers should be aware that Internet websites listed in this work may have changed or disap-peared between when this work was written and when it is read.
For general information on our other products and services please contact our Customer Care Department within the United States at (877) 762-2974, outside the United States at (317) 572-3993 or fax (317) 572-4002.
Wiley publishes in a variety of print and electronic formats and by print-on-demand. Some material included with standard print versions of this book may not be included in e-books or in print-on-demand. If this book refers to media such as a CD or DVD that is not included in the version you purchased, you may download this material at http:// booksupport.wiley.com. For more information about Wiley products, visit www.wiley.com.
Library of Congress Control Number: 2014931958
Trademarks: Wiley and the Wiley logo are trademarks or registered trademarks of John Wiley & Sons, Inc. and/or its affi liates, in the United States and other countries, and may not be used without written permission. Google is a registered trademark of Google, Inc. All other trademarks are the property of their respective owners. John Wiley & Sons, Inc. is not associated with any product or vendor mentioned in this book.
Proofreader Mary Beth Wakefi eld
Director of Community Marketing
David Mayhew
Business Manager Amy Knies
Vice President and Executive Group Publisher
Richard Swadley
Associate Publisher Jim Minatel
Jordan Tigani has more than 15 years of professional software development experience, the last 4 of which have been spent building BigQuery. Prior to join-ing Google, Jordan worked at a number of star-crossed startups. The startup experience made him realize that you don’t need to be a big company to have Big Data. Other past jobs have been in Microsoft Research and the Windows kernel team. When not writing code, Jordan is usually either running or playing soc-cer. He lives in Seattle with his wife, Tegan, where they both can walk to work.
Jeremy Condit is one of the founding engineers of the BigQuery project at Google, where he has contributed to the design and implementation of BigQuery's API, query engine, and client tools. Prior to joining Google in 2010, he was a researcher in computer science, focusing on programming languages and operating sys-tems, and he has published and presented his research in a number of ACM and Usenix conferences. Jeremy has a bachelor's degree in computer science from Harvard and a Ph.D. in computer science from U.C. Berkeley.
About the Technical Editor
About the Technical Proofreader
First, we would like to thank the Dremel and BigQuery teams for building and running a service worth writing about. The last four years since the offsite at Barry’s house, where we decided we weren’t going to build what management suggested but were going to build BigQuery instead, have been an exciting time. More generally, thanks to the Google tech infrastructure group that is home to many amazing people and projects. These are the type of people who say, “Only a petabyte?” and don’t mean it ironically. It is always a pleasure to come to work.
There were a number of people who made this book possible: Robert Elliot, who approached us about writing the book and conveniently didn’t mention how much work would be involved; and Kevin Kent, Tom Dinse, and others from Wiley who helped shepherd us through the process.
A very special thank you to our tech editor and colleague Jeremy Condit who showed us he can review a book just as carefully as he reviews code. Readers should thank him as well, because the book has been much improved by his suggestions.
Other well-deserved thanks go to Bruce Chhay, another BigQuery team member, who volunteered on short notice to handle the fi nal edit. Jing Jing Long, one of the inventors of Dremel, read portions of the book to make sure our descriptions at least came close to matching his implementation. Craig Citro provided moral support with the Python programming language.
And we’d like to thank the BigQuery users, whose feedback, suggestions, and even complaints have made BigQuery a better product.
It has been a great experience working on this project with Siddartha; he’s one of the best engineers I’ve worked with, and his technical judgment has formed the backbone of this book. I’d like to thank my parents, who helped inspire the Shakespeare examples, and my wife, Tegan, who inspires me in innumerable other ways. Tegan also lent us her editing skills, improving clarity and making sure I didn’t make too many embarrassing mistakes. Finally, I’d like to thank the Google Cafe staff, who provided much of the raw material for this book.
— Jordan Tigani
When I was getting started on this project, I was excited to have Jordan as my collaborator. In retrospect, it would have been impossible without him. His productivity can be a bit daunting, but it comes in handy when you need to slack off. I would like to thank my wife, Nitya, for helping me take on this project in addition to my day job. She had to work hard at keeping Vivaan occupied, who otherwise was my excuse for procrastinating. Lastly, I want to thank my parents for their tireless encouragement.
Introduction xiii
Part I BigQuery Fundamentals
C H A P T E R
1Chapter 1 The Story of Big Data at Google 3
Big Data Stack 1.0 4
Big Data Stack 2.0 (and Beyond) 5
Open Source Stack 7
Google Cloud Platform 8
Cloud Processing 9
Cloud Storage 9
Cloud Analytics 9
Problem Statement 10
What Is Big Data? 10
Why Big Data? 10
Why Do You Need New Ways to Process Big Data? 11 How Can You Read a Terabyte in a Second? 12
What about MapReduce? 12
How Can You Ask Questions of Your Big Data and Quickly
Get Answers? 13
Summary 13
Chapter 2 BigQuery Fundamentals 15
What Is BigQuery? 15
SQL Queries over Big Data 16
Cloud Storage System 21
Distributed Cloud Computing 23
Analytics as a Service (AaaS?) 26
What BigQuery Isn’t 29
Google Cloud Platform 34
BigQuery Service History 37
BigQuery Sensors Application 39
Sensor Client Android App 40
BigQuery Sensors AppEngine App 41
Running Ad-Hoc Queries 42
Summary 43
Chapter 3 Getting Started with BigQuery 45
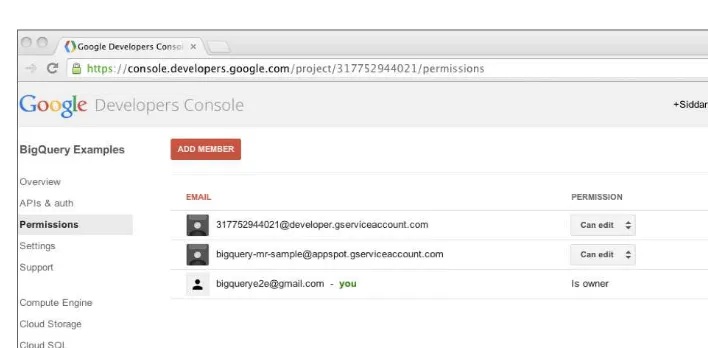
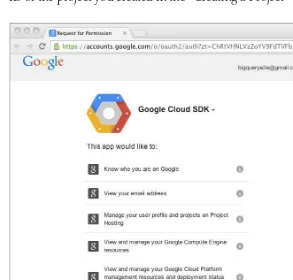
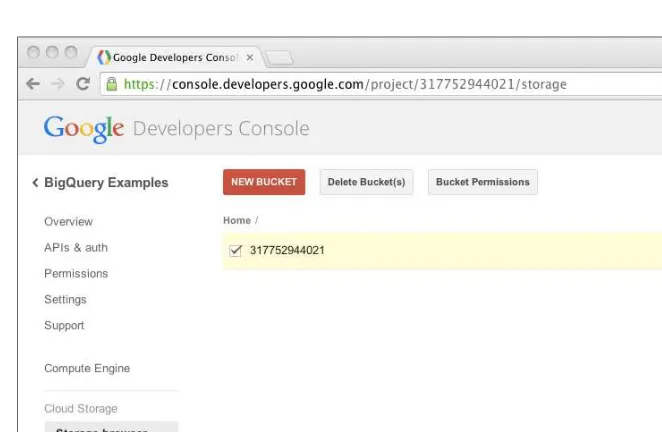
Creating a Project 45
Google APIs Console 46
Free Tier Limitations and Billing 49
Running Your First Query 51
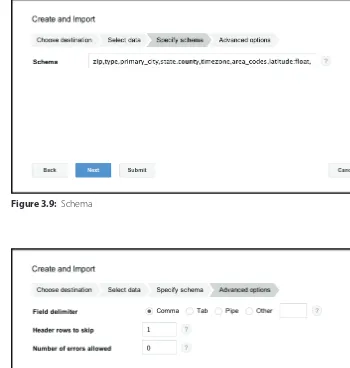
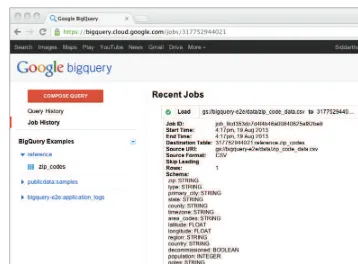
Loading Data 54
Using the Command-Line Client 57
Install and Setup 58
Using the Client 60
Service Account Access 62
Setting Up Google Cloud Storage 64
Development Environment 66
Python Libraries 66
Java Libraries 67
Additional Tools 67
Summary 68
Chapter 4 Understanding the BigQuery Object Model 69
Projects 70
Project Names 70
Project Billing 72
Project Access Control 72
Projects and AppEngine 73
BigQuery Data 73
Naming in BigQuery 73
Schemas 75 Tables 76 Datasets 77
Jobs 78
Job Components 78
BigQuery Billing and Quotas 85
Storage Costs 85
Processing Costs 86
Query RPCs 87
TableData.insertAll() RPCs 87
Data Model for End-to-End Application 87
Part II Basic BigQuery 93
Chapter 5 Talking to the BigQuery API 95
Introduction to Google APIs 95
Authenticating API Access 96
RESTful Web Services for the SOAP-Less Masses 105
Discovering Google APIs 112
Common Operations 113
BigQuery REST Collections 122
Projects 123 Datasets 126 Tables 132 TableData 139 Jobs 144
BigQuery API Tour 151
Error Handling in BigQuery 154
Summary 158
Chapter 6 Loading Data 159
Bulk Loads 160
Moving Bytes 163
Destination Table 170
Data Formats 174
Errors 182
Limits and Quotas 186
Streaming Inserts 188
Summary 193
Chapter 7 Running Queries 195
BigQuery Query API 196
Query API Methods 196
Query API Features 208
Query Billing and Quotas 213
BigQuery Query Language 221
BigQuery SQL in Five Queries 222
Differences from Standard SQL 232
Summary 236
Chapter 8 Putting It Together 237
A Quick Tour 238
Mobile Client 242
Monitoring Service 243
Log Collection Service 252
Log Trampoline 253
Dashboard 260
Data Caching 261
Data Transformation 265
Part III Advanced BigQuery 273
Chapter 9 Understanding Query Execution 275
Background 276
Storage Architecture 277
Colossus File System (CFS) 277
ColumnIO 278
Durability and Availability 281
Query Processing 282
Dremel Serving Trees 283
Architecture Comparisons 295
Relational Databases 295
MapReduce 298
Summary 303
Chapter 10 Advanced Queries 305
Advanced SQL 306
Subqueries 307 Combining Tables: Implicit UNION and JOIN 310 Analytic and Windowing Functions 315
BigQuery SQL Extensions 318
The EACH Keyword 318
Data Sampling 320
Repeated Fields 324
Query Errors 334
Result Too Large 334
Resources Exceeded 337
Recipes 338
Pivot 339
Cohort Analysis 340
Parallel Lists 343
Exact Count Distinct 344
Trailing Averages 346
Finding Concurrency 347
Summary 348
Chapter 11 Managing Data Stored in BigQuery 349
Query Caching 349
Result Caching 350
Table Snapshots 354
AppEngine Datastore Integration 358
Simple Kind 359
Mixing Types 366
Final Thoughts 368
Metatables and Table Sharding 368
Time Travel 368
Part IV BigQuery Applications 381
Chapter 12 External Data Processing 383
Getting Data Out of BigQuery 384
Extract Jobs 384
TableData.list() 396
AppEngine MapReduce 405
Sequential Solution 407
Basic AppEngine MapReduce 409
BigQuery Integration 412
Using BigQuery with Hadoop 418
Querying BigQuery from a Spreadsheet 419
BigQuery Queries in Google Spreadsheets (Apps Script) 419 BigQuery Queries in Microsoft Excel 429
Summary 433
Chapter 13 Using BigQuery from Third-Party Tools 435
BigQuery Adapters 436
Simba ODBC Connector 436
JDBC Connection Options 444
Client-Side Encryption with Encrypted BigQuery 445
Scientifi c Data Processing Tools in BigQuery 452
BigQuery from R 452
Python Pandas and BigQuery 461
Visualizing Data in BigQuery 467
Visualizing Your BigQuery Data with Tableau 467 Visualizing Your BigQuery Data with BIME 473 Other Data Visualization Options 477
Summary 478
Chapter 14 Querying Google Data Sources 479
Google Analytics 480
Setting Up BigQuery Access 480
Table Schema 481
Querying the Tables 483
Google AdSense 485
Table Structure 486
Leveraging BigQuery 490
Google Cloud Storage 491
Summary 494
If you want to get the most out of any tool, whether it is a database or a rotary power drill, it is important to know how it works. This lets you develop an intuition about how you can use the tool effectively. The goal of this book is to help you develop an intuition about BigQuery, which can enable you to make your own decisions about when BigQuery is the right tool for the job, how you can improve your query effi ciency, and how you can apply BigQuery in unan-ticipated situations.
It is also important to have good examples that you can incorporate into your code. This book provides source code to help you start using BigQuery in your applications and query examples that can help you solve complex problems in SQL. In addition, we show you how to write code to get your data in, how to query and visualize that data, and how to get it out again.
The target audience for this book is a data scientist who wants to analyze data with BigQuery, a developer who wants to integrate BigQuery into their data pipelines, or someone who is trying to determine whether BigQuery is the right tool to use. Each type of reader might want something different from the book; the “How to Read This Book” section provides guidelines for a custom path through the chapters.
Overview of the Book and Technology
annual developer conference. Two years later, also at Google I/O, Jordan was on hand to announce public availability.
In the intervening time, we have both been active contributors to the design and implementation of the BigQuery service. The system has grown consider-ably, both in the number of users as well as what it can do. We’ve also helped support the product via mailing lists and the BigQuery area on StackOverfl ow. We’ve paid close attention to how the product was used, the kinds of problems that people had, and the interesting applications they found for the technology.
Along the way we built up a collection of cool things you can do using BigQuery: different techniques, ways of querying, and methods of working around limita-tions. These tricks and best practices are in this book.
This book doesn’t attempt to replace the online documentation. Instead, it is a good format to dive deeper into the service and address different audiences, particularly those familiar with traditional data warehousing products. In addi-tion, this book gives you a sense of how BigQuery works and answers some of the “whys” behind the design.
Although BigQuery, as a product, moves quickly, we’ve written the book with changes (expected and otherwise) in mind. A new version of BigQuery is released every week or so, and each one fi xes bugs, adds features, or improves scalability and performance. By the time you read this book, BigQuery may have undergone signifi cant evolution.
The BigQuery team works hard at making sure all changes to BigQuery will be backward compatible. When new functionality is introduced that confl icts with existing behavior, the policy is to ensure the old version continues to work for at least 12 months. The code and examples in this book should continue to work for a considerable amount of time. Both code and SQL queries that were written to interact with BigQuery at the public launch in 2012 still work today. Even though the BigQuery service maintains backward compatibility, the best way to achieve a particular result sometimes changes as new features become available. We have chosen to document in this book core concepts that are useful independent of details that might change over time. When in doubt, consult the offi cial documentation at https://developers.google.com/bigquery.
How This Book Is Organized
This book is divided into four sections:
■ BigQuery Fundamentals (Chapters 1 through 4): Walks you through
how to start with BigQuery and describes the basic abstractions used by the service. If you’re familiar with BigQuery, you might want to just skim this section; although, it might be helpful to read it to make sure you have a fi rm grounding in the primary concepts.
■ Basic BigQuery (Chapters 5 through 8): Shows how to use the API at a
raw HTTP level and via the higher-level clients, as well as how to write SQL queries. This section culminates with an AppEngine app that ties the various pieces of the API together and shows how they are useful in a real-world scenario.
■ Advanced BigQuery (Chapters 9 through 11): Goes into detail about
how BigQuery works, gives advanced query tricks and recipes, and gives advice on data management strategies. This section can help you under-stand why a query that seems like it should work might return an error, and can help you create queries that can be diffi cult to express in SQL.
■ BigQuery Applications (Chapters 12 through 14): Shows how to tie
BigQuery in with other systems. For instance, this section shows how to visualize your data with Tableau, how to query BigQuery tables from Microsoft Excel, and how to query your Google Analytics data.
How to Read This Book
You can, of course, read this book straight through from cover to cover. However, depending on your goals, you may want to skip some sections without losing much context. For example, if you are a data analyst trying to learn how to write better BigQuery queries, you may not be as interested in the HTTP API as a developer who wants to mirror a production database to BigQuery. Following are a couple of suggested paths though the book for different user profi les.
Data Scientist
will be through SQL and the various BigQuery tools provided by Google. The data scientist can follow this chapter progression:
■ Chapters 1–4 (fundamentals): For anyone not familiar with BigQuery,
these chapters describe what BigQuery is and how to start using it. Chapter 4, “Understanding the BigQuery Object Model,” is important because the fundamental abstractions in BigQuery differ slightly from other relational database systems.
■ Chapter 7, “Running Queries”: You may want to skim the API portion,
but you probably shouldn’t skip it completely because it describes what is possible via the API. (And all the API features should be available in the web UI or in the bq command-line client.) Some table management operations that you may expect to be in SQL (such as creating a tempo-rary table) are done via the API in BigQuery. This chapter also discusses how BigQuery SQL is different from standard SQL and walks through a number of BigQuery queries.
■ Chapter 9, “Understanding Query Execution”: This chapter describes
the architecture of the systems that underlie BigQuery. If you want to write good queries and understand why query X is faster than query Y, this chapter is important. Most users of relational databases develop an intuition about how to write effi cient queries, and because BigQuery uses a different fundamental architecture, some of these previous intuitions could get you in trouble. This chapter can help you develop similar intu-ition about the types of queries that can run well in BigQuery.
■ Chapter 10, “Advanced Queries”: This chapter shows some queries that
you might not think of writing and provides advanced query recipes. You may want to refer back to this chapter when you run into data modeling or query problems.
■ Chapter 11, “Managing Data Stored in BigQuery”: You might want to
skip or skim this chapter, but the portions on how to partition your data or how to make use of the query cache may be useful.
■ Chapter 12, “External Data Processing”: The second half of this
chap-ter, which describes running queries from Microsoft Excel and Google Spreadsheets, will likely be interesting if your organization uses a lot of spreadsheets.
■ Chapter 13, “Using BigQuery from Third-Party Tools”: You should read
this chapter if you’re interested in data visualization, client-side encryp-tion, R, or using BigQuery via ODBC.
■ Chapter 14, “Querying Google Data Sources”: If you have data from a
Software Developer
If you’re a developer who wants to integrate BigQuery with your data pipelines or create a dashboard using BigQuery, you might be most interested in the fol-lowing chapters:
■ Chapters 1–4 (fundamentals): If you’re going to use the API, carefully
read Chapter 4, “Understanding the BigQuery Object Model.” You need to understand the BigQuery object model, the difference between a Dataset and a Table, and what kinds of things you can do with Jobs.
■ Chapter 5, “Talking to the BigQuery API”: This chapter gives an overview
of the HTTP API that you’ll use if you write code to talk to BigQuery.
■ Chapter 6, “Loading Data”: If you want to get your data into BigQuery,
read this chapter.
■ Chapter 7, “Running Queries”: This chapter discusses the BigQuery query
language and the query API. You’ll likely want to be familiar with how to run queries via the API as well as the various query options.
■ Chapter 8, “Putting It Together”: This chapter walks you through an
end-to-end AppEngine application that uses BigQuery for logging, dash-boarding, and ad-hoc querying. If you write code that uses BigQuery, the online resources for this chapter will be particularly interesting because you may cut and paste a lot of the code that is provided.
■ Chapter 11, “Managing Data Stored in BigQuery”: This may be interesting
because it gives best practices for how to partition your data effectively, and gives tips and tricks for reducing the cost of using BigQuery.
■ Chapter 12, “External Data Processing”: If you want to process your data
outside of BigQuery, this chapter will be useful. Maybe you want to run Hadoop over your BigQuery data, or you want to download your tables locally to process them on-premise.
■ Chapter 13, “Using BigQuery from Third-Party Tools”: There are a
number of third-party tools that can make it easier for you to integrate with BigQuery. For example, if you already use ODBC to connect to a database source, the Simba ODBC driver for BigQuery may allow you to run queries without having to write any additional code.
Technology Evaluator
you’re interested in what the technology can do and how it works, consider the following chapters:
■ Chapter 2, “Big Query Fundamentals”: This chapter is a good
introduc-tion to BigQuery and what it can do. It also describes what BigQuery does not do and gives some comparisons to other technologies.
■ Chapter 4, “Understanding the BigQuery Object Model”: This chapter
will be worth skimming, even if you’re interested only in how BigQuery works. Other chapters reference it heavily and assume that you know the difference between a Table and a Dataset.
■ Chapters 5–8 (BigQuery API): These chapters may be worth skimming,
if to see only what BigQuery can do and what the code to use for various features would look like.
■ Chapter 9, “Understanding Query Execution”: This chapter has
archi-tectural comparisons to other Big Data frameworks such as Hadoop. It describes how BigQuery works, including the Dremel architecture, Colossus, and the other building blocks that BigQuery uses to provide a comprehensive service.
■ Chapter 12, “External Data Processing”: This chapter describes a number
of ways to interact with BigQuery; it will be interesting if you want to fi gure out how to integrate with your existing systems.
■ Chapter 13, “Using BigQuery from Third-Party Tools”: This chapter
gives a survey of visualization, connection, and other types of tools that are built on top of BigQuery.
■ Chapter 14, “Querying Google Data Sources”: If you use other Google
services, such as AdSense or Double Click, this chapter is worth skim-ming to see how you can access the data you already have within Google via BigQuery.
Tools You Need
If you’re an analyst or someone who just wants to use BigQuery directly out-of-the-box (that is, without writing code to interact with it), the only thing you need is a web browser (and perhaps a credit card if your queries exceed the free monthly quota).
a bit more. You should have Python installed, at least version 2.7, and should know either Python or another similar language such as Ruby fairly well. The examples in the book are mostly in Python for two reasons: The fi rst is that it is the language that is most commonly used to access BigQuery. The other is that Python is fairly compact (unlike Java) and readable (unlike Perl), so it is easy to see what the important pieces are without a lot of extra boilerplate.
Some chapters have code in other languages where either the code is suf-fi ciently different from the Python code or there is a more natural language to use. For example, Chapter 12, “External Data Processing,” uses App Script to demonstrate how to run BigQuery queries from Google Spreadsheets, and Chapter 13, “Using BigQuery from Third-Party Tools,” has examples in R and C#. For these sections you will likely need other development environments. For Java code you’ll want the JDK, for C# code you’ll likely want Microsoft Visual Studio, and for R you’ll want R studio.
For the most part, we assume that you’ve already installed these applications, but for some more specialized environments, such as R, we provide download and installation information. Even if you’re not an experienced user of these other languages, you can still follow along with the examples.
If you’re not already a BigQuery user, you need to set up a Google Cloud Project. Chapter 3, “Getting Started with BigQuery,” walks you through that process. If you intend to use BigQuery heavily, you may need to provide a credit card, but there is a free tier of usage that may suffi ce for fi guring out whether BigQuery meets your needs.
Chapter 8, “Putting It Together,” builds both an Android App to stream data into BigQuery from device sensors and an AppEngine App. You can use the Android App as-is, but if you want to tweak it, you need the Android devel-opment tools. Chapter 8 goes into more detail about what you need. For the AppEngine portions you need to create your own AppEngine app. Again, the installation information is provided in Chapter 8.
Supplemental Materials and Information
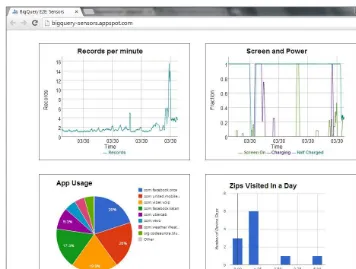
The companion website to this book is hosted at http://www.wiley.com/go/ googlebigquery. The site contains information about downloading source code and fi nding sample data used throughout the book. There is also an AppEngine app at http://bigquery-sensors.appspot.com, the same one that is built in Chapter 8. It contains links to the BigQuery Sensor dashboard and Android app downloads.
samples and sensors. The former contains the code snippets used in the book, arranged by chapter. The latter directory contains code for the Sensors AppEngine and Android apps.
You can navigate to that link and browse through the code, or if you have Git or Subversion installed, you can check out the code to try it on your local machine. Chapter 3 has directions to help you get started. We will update the code periodically to fi x bugs or match current best practices. If you fi nd a bug, you can report it at the project issue tracker (https://code.google.com/p/ bigquery-e2e/issues/list).
I
BigQuery Fundamentals
In This Part
Chapter 1: The Story of Big Data at Google Chapter 2: BigQuery Fundamentals Chapter 3: Getting Started with BigQuery
Since its founding in 1998, Google has grown by multiple orders of magnitude in several different dimensions—how many queries it handles, the size of the search index, the amount of user data it stores, the number of services it pro-vides, and the number of users who rely on those services. From a hardware perspective, the Google Search engine has gone from a server sitting under a desk in a lab at Stanford to hundreds of thousands of servers located in dozens of datacenters around the world.
The traditional approach to scaling (outside of Google) has been to scale the hardware up as the demands on it grow. Instead of running your database on a small blade server, run it on a Big Iron machine with 64 processors and a terabyte of RAM. Instead of relying on inexpensive disks, the traditional scaling path moves critical data to costly network-attached storage (NAS).
There are some problems with the scale-up approach, however:
■ Scaled-up machines are expensive. If you need one that has twice the
processing power, it might cost you fi ve times as much.
■ Scaled-up machines are single points of failure. You might need to get
more than one expensive server in case of a catastrophic problem, and each one usually ends up being built with so many backup and redundant
pieces that you’re paying for a lot more hardware than you actually need.
1
■ Scale up has limits. At some point, you lose the ability to add more
processors or RAM; you’ve bought the most expensive and fastest machine that is made (or that you can afford), and it still might not be fast enough.
■ Scale up doesn’t protect you against software failures. If you have a Big
Iron server that has a kernel bug, that machine will crash just as easily (and as hard) as your Windows laptop.
Google, from an early point in time, rejected scale-up architectures. It didn’t, however, do this because it saw the limitations more clearly or because it was smarter than everyone else. It rejected scale-up because it was trying to save money. If the hardware vendor quotes you $1 million for the server you need, you could buy 200 $5,000 machines instead. Google engineers thought, “Surely there is a way we could put those 200 servers to work so that the next time we need to increase the size, we just need to buy a few more cheap machines, rather than upgrade to the $5 million server.” Their solution was to scale out, rather than scale up.
Big Data Stack 1.0
Between 2000 and 2004, armed with a few principles, Google laid the founda-tion for its Big Data strategy:
■ Anything can fail, at any time, so write your software expecting
unreli-able hardware. At most companies, when a database server crashes, it is a serious event. If a network switch dies, it will probably cause downtime. By running in an environment in which individual components fail often, you paradoxically end up with a much more stable system because your software is designed to handle those failures. You can quantify your risk beyond blindly quoting statistics, such as mean time between failures (MTBFs) or service-level agreements (SLAs).
■ Use only commodity, off-the-shelf components. This has a number of
advantages: You don’t get locked into a particular vendor’s feature set;
you can always fi nd replacements; and you don’t experience big price discontinuities when you upgrade to the “bigger” version.
■ The cost for twice the amount of capacity should not be considerably
more than the cost for twice the amount of hardware. This means the software must be built to scale out, rather than up. However, this also imposes limits on the types of operations that you can do. For instance,
if you scale out your database, it may be diffi cult to do a JOIN operation,
■ “A foolish consistency is the hobgoblin of little minds.” If you abandon the
“C” (consistency) in ACID database operations, it becomes much easier to parallelize operations. This has a cost, however; loss of consistency means that programmers have to handle cases in which reading data they just wrote might return a stale (inconsistent) copy. This means you need smart programmers.
These principles, along with a cost-saving necessity, inspired new computation architectures. Over a short period of time, Google produced three technologies that inspired the Big Data revolution:
■ Google File System (GFS): A distributed, cluster-based fi lesystem. GFS
assumes that any disk can fail, so data is stored in multiple locations, which means that data is still available even when a disk that it was stored on crashes.
■ MapReduce: A computing paradigm that divides problems into easily
parallelizable pieces and orchestrates running them across a cluster of machines.
■ Bigtable: A forerunner of the NoSQL database, Bigtable enables structured
storage to scale out to multiple servers. Bigtable is also replicated, so failure of any particular tablet server doesn’t cause data loss.
What’s more, Google published papers on these technologies, which enabled others to emulate them outside of Google. Doug Cutting and other open source contributors integrated the concepts into a tool called Hadoop. Although Hadoop is considered to be primarily a MapReduce implementation, it also incorporates GFS and BigTable clones, which are called HDFS and HBase, respectively.
Armed with these three technologies, Google replaced nearly all the off-the-shelf software usually used to run a business. It didn’t need (with a couple of exceptions) a traditional SQL database; it didn’t need an e-mail server because its Gmail service was built on top of these technologies.
Big Data Stack 2.0 (and Beyond)
The three technologies—GFS, MapReduce, and Bigtable—made it possible for Google to scale out its infrastructure. However, they didn’t make it easy. Over the next few years, a number of problems emerged:
■ MapReduce is hard. It can be diffi cult to set up and diffi cult to
you face the issue of how to deal with state in between phases and how to deal with partial failures without having to restart the whole thing.
■ MapReduce can be slow. If you want to ask questions of your data, you
have to wait minutes or hours to get the answers. Moreover, you have to write custom C++ or Java code each time you want to change the
ques-tion that you’re asking.
■ GFS, while improving durability of the data (since it is replicated
multiple times) can suffer from reduced availability, since the metadata server is a single point of failure.
■ Bigtable has problems in a multidatacenter environment. Most services
run in multiple locations; Bigtable replication between datacenters is only eventually consistent (meaning that data that gets written out will show up everywhere, but not immediately). Individual services spend a lot of redundant effort babysitting the replication process.
■ Programmers (even Google programmers) have a really diffi cult time
dealing with eventual consistency. This same problem occurred when Intel engineers tried improving CPU performance by relaxing the memory model to be eventually consistent; it caused lots of subtle bugs because the hardware stopped working the way people’s mental model of it operated.
Over the next several years, Google built a number of additional infrastructure components that refi ned the ideas from the 1.0 stack:
■ Colossus: A distributed filesystem that works around many of the
limitations in GFS. Unlike many of the other technologies used at Google,
Colossus’ architecture hasn’t been publicly disclosed in research papers.
■ Megastore: A geographically replicated, consistent NoSQL-type datastore.
Megastore uses the Paxos algorithm to ensure consistent reads and writes. This means that if you write data in one datacenter, it is immediately available in all other datacenters.
■ Spanner: A globally replicated datastore that can handle data locality
constraints, like “This data is allowed to reside only in European datacen-ters.” Spanner managed to solve the problem of global time ordering in a geographically distributed system by using atomic clocks to guarantee synchronization to within a known bound.
■ FlumeJava: A system that allows you to write idiomatic Java code that
ease of setup, ease of writing, and ease of handling multiple MapReduce problems previously mentioned.
■ Dremel: A distributed SQL query engine that can perform complex queries
over data stored on Colossus, GFS, or elsewhere.
The version 2.0 stack, built piecemeal on top of the version 1.0 stack (Megastore is built on top of Bigtable, for instance), addresses many of the drawbacks of the previous version. For instance, Megastore allows services to write from any datacenter and know that other readers will read the most up-to-date version. Spanner, in many ways, is a successor to Megastore, which adds automatic planet-scale replication and data provenance protection.
On the data processing side, batch processing and interactive analyses were separated into two tools based on usage models: Flume and Dremel. Flume enables users to easily chain together MapReduces and provides a simpler programming model to perform batch operations over Big Data. Dremel, on the other hand, makes it easy to ask questions about Big Data because you can now run a SQL query over terabytes of data and get results back in a few seconds. Dremel is the query engine that powers BigQuery; Its architecture is discussed in detail in Chapter 9, “Understanding Query Execution.”
An interesting consequence of the version 2.0 stack is that it explicitly rejects the notion that in order to use Big Data you need to solve your problems in fundamentally different ways than you’re used to. While MapReduce required you to think about your computation in terms of Map and Reduce phases, FlumeJava allows you to write code that looks like you are operating over nor-mal Java collections. Bigtable replication required abandoning consistent writes, but Megastore adds a consistent coordination layer on top. And while Bigtable had improved scalability by disallowing queries, Dremel retrofi ts a traditional SQL query interface onto Big Data structured storage.
There are still rough edges around many of the Big Data 2.0 technologies: things that you expect to be able to do but can’t, things that are slow but seem like they should be fast, and cases where they hold onto awkward abstractions. However, as time goes on, the trend seems to be towards smoothing those rough edges and making operation over Big Data as seamless as over smaller data.
Open Source Stack
infancy, they more or less followed Google’s lead. Hadoop was designed to be very similar to the architecture described in the MapReduce paper, and the Hadoop subprojects HDFS and HBase are close to GFS and BigTable.
However, as the value of scale-out systems began to increase (and as problems with traditional scale-up solutions became more apparent), the Open Source Big Data stack diverged signifi cantly. A lot of effort has been put into making Hadoop faster; people use technologies such as Hive and Pig to query their data; and numerous NoSQL datastores have sprung up, such as CouchDB, MongoDB, Cassandra, and others.
On the interactive query front, there are a number of open source options:
■ Cloudera’s Impala is an open source parallel execution engine similar
to Dremel. It allows you to query data inside HDFS and Hive without extracting it.
■ Amazon.com’s Redshift is a fork of PostgreSQL which has been modifi ed to scale out across multiple machines. Unlike Impala, Redshift is a hosted service, so it is managed in the cloud by Amazon.com.
■ Drill is an Apache incubator project that aims to be for Dremel what Hadoop was for MapReduce; Drill fi lls in the gaps of the Dremel paper to provide a similar open source version.
■ Facebook’s Presto is a distributed SQL query engine that is similar to Impala. The days when Google held the clear advantage in innovation in the Big Data space are over. Now, we’re in an exciting time of robust competition among different Big Data tools, technologies, and abstractions.
Google Cloud Platform
Cloud Processing
The cloud processing components enable you to run arbitrary computations over your data:
■ Google Compute Engine (GCE): The base of Google’s Cloud Platform, GCE is infrastructure-as-a-service, plain and simple. If you have software you just want to run in the cloud on a Linux virtual machine, GCE enables you to do so. GCE also can do live migration of your service so that when the datacenter it is running is turned down for maintenance, your service won’t notice a hiccup.
■ AppEngine: AppEngine is a higher-level service than GCE. You don’t need to worry about OS images or networking confi gurations. You just write the code you actually want running in your service and deploy it; AppEngine handles the rest.
Cloud Storage
These cloud storage components enable you to store your own data in Google’s cloud:
■ Google Cloud Storage (GCS): GCS enables you to store arbitrary data in the cloud. It has two APIs: one that is compatible with Amazon.com’s S3 and another REST API that is similar to other Google APIs.
■ DataStore: A NoSQL key-value store. DataStore is usually used from AppEngine, but its REST API enables you to store and look up data from anywhere.
■ BigQuery (Storage API): BigQuery enables you to store structured rows and columns of data. You can ingest data directly through the REST API, or you can import data from GCS.
Cloud Analytics
Google’s cloud analytics services enable you to extract meaning from your data: ■ Cloud SQL: A hosted MySQL instance in the cloud
■ Cloud Hadoop: Packages Hadoop and makes it easy to run on Google
Compute Engine
■ BigQuery: Enables you to run SQL statements over your structured data
If you fi nd that something is missing from Google’s Cloud Platform, you always have the option of running your favorite open source software stack on Google Compute Engine. For example, the Google Cloud Hadoop package is one way of running Hadoop, but if you want to run a different version of Hadoop than is supported, you can always run Hadoop directly; Google’s Hadoop package uses only publicly available interfaces.
Problem Statement
Before we go on to talk about BigQuery, here’s a bit of background information about the problems that BigQuery was developed to solve.
What Is Big Data?
There are a lot of different defi nitions from experts about what it means to have Big Data; many of these defi nitions conceal a boast like, “Only a petabyte? I’ve forgotten how to count that low!” This book uses the term Big Data to mean more data than you can process sequentially in the amount of time you’re willing to spend waiting for it. Put another way, Big Data just means more data than you can easily handle using traditional tools such as relational databases without spending a lot of money on specialized hardware.
This defi nition is deliberately fuzzy; to put some numbers behind it, we’ll say a hundred million rows of structured data or a hundred gigabytes of unstructured data. You can fi t data of that size on a commodity disk and even use MySQL on it. However, dealing with data that size isn’t going to be pleasant. If you need to write a tool to clean the data, you’re going to spend hours running it, and you need be careful about memory usage, and so on. And as the data size gets big-ger, the amount of pain you’ll experience doing simple things such as backing it up or changing the schema will get exponentially worse.
Why Big Data?
■ Over time: If you produce a million records a day, that might not be “Big Data.” But in 3 years, you’ll have a billion records; at some point you may fi nd that you either need to throw out old data or fi gure out a new way to process the data that you have.
■ Viral scaling: On the Internet, no one knows you’re a small company. If your website becomes popular, you can get a million users overnight. If you track 10 actions from a million users a day, you’re talking about a billion actions a quarter. Can you mine that data well enough to be able to improve your service and get to the 10 million user mark?
■ Projected growth: Okay, maybe you have only small data now, but after you sign customer X, you’ll instantly end up increasing by another 2 orders of magnitude. You need to plan for that growth now to make sure you can handle it.
■ Architectural limitations: If you need to do intense computation over your data, the threshold for “Big Data” can get smaller. For example, if you need to run an unsupervised clustering algorithm over your data, you may fi nd that even a few million data points become diffi cult to handle without sampling.
Why Do You Need New Ways to Process Big Data?
A typical hard disk can read on the order of 100 MB per second. If you want to ask questions of your data and your data is in the terabyte range, you either need thousands of disks or you are going to spend a lot of time waiting.
As anyone who has spent time tuning a relational database can attest, there is a lot of black magic involved in getting queries to run quickly on your-favorite-database. You may need to add indexes, stripe data across disks, put the transaction log on its own spindle, and so on. However, as your data grows, at some point it gets harder and harder to make your queries perform well. In addition, the more work you do, the more you end up specializing the schema for the type of questions you typically ask of your data.
What if you want to ask a question you’ve never asked before? If you are relying on a heavily tuned schema, or if you’re running different queries than the database was tuned for, you may not get answers in a reasonable amount of time or without bogging down your production database. In these cases, your options are limited; you either need to run an extremely slow query (that may degrade performance for your entire database), or you could export the data and process it in an external system like Hadoop.
to explore the data in a way that requires access to all the impressions? Maybe you want to compute the number of distinct users that visited your site—if you drop 90 percent of your data, you can’t just multiply the remaining users by 10 to get the number of distinct users in the original dataset. This point is somewhat subtle, but if you drop 90 percent of your data, you might still have records representing 99 percent of your users, or you might have records representing only 5 percent of your users; you can’t tell unless you use a more sophisticated way to fi lter your data.
How Can You Read a Terabyte in a Second?
If you want to ask interactive questions of your Big Data, you must process all your data within a few seconds. That means you need to read hundreds of gigabytes per second—and ideally more.
Following are three ways that you can achieve this type of data rate:
1. Skip a lot of the data. This is a good option if you know in advance the types of questions you’re going to ask. You can pre-aggregate the data or create indexes on the columns that you need to access. However, if you want to ask different questions, or ask them in a different way, you may not be able to avoid reading everything.
2. Buy some really expensive hardware. For a few million dollars or so, you can get a machine onsite that will come with its own dedicated support person that can let you query over your terabytes of data.
3. Run in parallel. Instead of reading from one disk, read from thousands of disks. Instead of one database server, read from hundreds.
If you use custom hardware (solution #2) and you want it to go faster, you need to buy an even bigger data warehouse server (and hope you can sell the old one). And if you rely on skipping data (solution #1) to give you performance, the only way to go faster is to be smarter about what data you skip (which doesn’t scale).
BigQuery, and most Big Data tools, take approach #3. Although it may sound expensive to have thousands of disks and servers, the advantage is that you get exactly what you pay for; that is, if you need to run twice as fast, you can buy twice as many disks. If you use BigQuery, you don’t need to buy your own disks; you get a chance to buy small slices of time on a massive amount of hardware.
What about MapReduce?
which allows you to perform operations over Big Data orders of magnitude more quickly than if you had to read that data sequentially.
However, Hadoop specifi cally and MapReduce in general have some archi-tectural drawbacks that make them unsuited for interactive-style analyses. That is, if you want to ask questions of your data using MapReduce, you’re probably going to want to get a cup of coffee (or go out to lunch) while you wait. Interactive analyses should give you answers before you get bored or forget why you were asking in the fi rst place. Newer systems, such as Cloudera’s Impala, allow interactive queries over your Hadoop data, but they do so by abandoning the MapReduce paradigm. Chapter 9 discusses the architecture in more detail and shows why MapReduce is better suited to batch workloads than interactive ones.
How Can You Ask Questions of Your Big Data and Quickly
Get Answers?
Google BigQuery is a tool that enables you to run SQL queries over your Big Data. It fans out query requests to thousands of servers, reads from tens or hundreds of thousands of disks at once, and can return answers to complex questions within seconds. This book describes how BigQuery can achieve such good performance and how you can use it to run queries on your own data.
Summary
This chapter introduces you to BigQuery, describing what it can do, when to use it, when not to use it, and even a bit about why it is so fast. Because you may be evaluating whether BigQuery is the right tool for you, this chapter spends a bit of time comparing it to other systems and other architectures. It discusses the performance and types of workloads best-suited to BigQuery, and also how BigQuery fi ts with other offerings in the Google Cloud Platform.
This chapter concludes with an introduction to an AppEngine and Android App that is used as the basis of many of the examples throughout the book. This sample app demonstrates several ways that BigQuery can be integrated into an application—from log collection and analyses to dashboard development and correlation of multiple data streams.
What Is BigQuery?
BigQuery, like many tools, started with a problem. Google engineers were hav-ing a hard time keephav-ing up with the growth of their data. The number of Gmail users is in the hundreds of millions; by 2012, there were more than 100 billion Google searches done every month. Trying to make sense of all this data was a time-consuming and frustrating experience.
Google is hugely a data-driven company. Decisions ranging from café menus to interview strategies to marketing campaigns are made by analyzing data.
2
If you have a great idea but you don’t have data to back it up, you’re going to have a hard time convincing anyone to implement your suggestion. However, if you have data on your side that says people click more ads with a particu-lar shade of blue background, your shade of blue will likely become the new offi cial standard.
As Google grew exponentially, the amount of data available also grew exponentially. Despite spending a lot of money on hardware and software for relational databases, it was often diffi cult to ask simple questions of the data. Despite having invented MapReduce to help analyze large datasets, it was still diffi cult to get answers interactively, without waiting minutes or hours for a long batch job to complete.
The data problem led to the development of an internal tool called Dremel, which enabled Google employees to run extremely fast SQL queries on large datasets. According to Armando Fox, a professor of computer science at the University of California at Berkley, “If you told me beforehand what Dremel claims to do, I wouldn’t have believed you could build it.” Dremel has become extremely popular at Google; Google engineers use it millions of times a day for tasks ranging from building sales dashboards to datacenter temperature analyses to computing employees’ percentile rank of how long they’ve worked at the company.
In 2012, at Google I/O, Google publicly launched BigQuery, which allowed users outside of Google to take advantage of the power and performance of Dremel. Since then, BigQuery has expanded to become not just a query engine but a hosted, managed cloud-based structured storage provider. The following sections describe the main aspects of BigQuery.
SQL Queries over Big Data
The primary function of BigQuery is to enable interactive analytic queries over Big Data. Although Big Data is a fuzzy term, in practice it just means “data that is big enough that you have to worry about how big it is.” Sometimes the data might be small now, but you anticipate it growing by orders of magnitude later. Sometimes the data might be only a few megabytes, but your algorithms to process it don’t scale well. Or sometimes you have a million hard drives full of customer data in a basement.
BigQuery SQL
The lingua franca for data analyses is the SQL query language. Other systems, such as Hadoop, enable you to write code in your favorite language to perform analytics, but these languages make it diffi cult to interactively ask questions of your data. If you have to write a Java program to query your data, you’ll end up spending a lot of time compiling, debugging, and uploading your program, rather than fi guring out what data you need.
Despite being somewhat intimidating at fi rst, SQL is also easy to use for nonprogrammers. Many software engineers are surprised when someone from marketing comes up with a sophisticated query to fi gure out why sales are slumping. However, it is actually quite common for non- or semi- technical people to be SQL wizards.
Oddly enough, the ones who often have the most diffi culty with SQL are the programmers themselves. SQL is a declarative language; that is, you declare what results you want, and it is up to the software to fi gure out how to get those results. For programmers, this reverses the natural order; we’re used to telling the computer exactly what we want it to do so that it gives us the results that we want. SQL leaves the method of execution up to the underlying query engine. This turns out to be advantageous for BigQuery because it allows the Dremel query engine to perform the analysis in a different way from traditional relational databases.
It can be surprising that a model we often have trouble understanding would be accessible to people in other disciplines. But after seeing sales, marketing, and even pointy-haired managers wielding RIGHT OUTER JOINs, we grudgingly have to admit that people who aren’t programmers are still quite intelligent.
BigQuery uses an admittedly nonstandard dialect of SQL. Speaking for all the engineers who currently work on or ever have worked on BigQuery or Dremel, if we could go back and change one thing, it probably would be to stick to something closer to standard SQL. If there was one prediction we could make about a breaking change in the future, it would be that BigQuery would deprecate some of the nonstandard quirks, such as a comma for table union, in favor of more standard SQL. That said, if such a change was made, there would be lots of advance warning, and the old dialect would continue to work for a long time after the new dialect was released.
How Fast Is BigQuery?
would still be limited by disk I/O speeds—if your data is stored on a single disk, reading the disk from multiple places in parallel may actually be slower than reading it sequentially.
The SQL query language is highly parallelizable, however, as long as you have a way to take advantage of it. The Dremel query engine created a way to paral-lelize SQL execution across thousands of machines. Chapter 9, “Understanding Query Execution,” describes in detail how it works, but the central principle is that it is a scale-out solution. If you want your queries to run faster, you can throw more machines at the problem. This is a contrast to a traditional scale-up architecture, where when you want more performance, you buy fancier hardware.
When run in the Google infrastructure, the Dremel architecture scales nearly linearly to tens of thousands of processor cores and hundreds of thousands of disks. The performance goal of the system was to process a terabyte of data in a second; although peak performance numbers have not been published, those goals have been met and exceeded.
Of course, this doesn’t mean that you’ll automatically see performance in that range; the Dremel clusters used by BigQuery are tuned for serving multiple queries at once rather than single queries at peak speed. A rough estimate for performance you can expect is on the order of 50 GB per second for a simple query. More complex queries—JOINs, complex regular expressions, and so on—will be somewhat slower. That said, 95 percent of all queries in the public BigQuery clusters fi nish in less than 5 seconds. However, unless you reserve capacity, you may fi nd that performance fl uctuates signifi cantly due to load on the system.
BIGQUERY RESERVED CAPACIT Y
BigQuery off ers the ability to reserve processing capacity in a dedicated virtual cluster in units of 5 GB processed per second. This might sound strange, since we just said that the rough goal is to process 50 GB per second for on-demand. Does that mean reserved capacity charges you more for less performance?
There are a couple of things to note with respect to reservations:
■ Reserved capacity gives you the ability to run queries that preempt other users, up to your capacity limit.
■ Reserved capacity gives you the optional ability to ‘burst’ over your capacity rate. This means your queries can use the pool of on-demand resources in addi-tion to reserved resources.
Query performance should continue to scale sublinearly (that is, if you double the size, it will take less than double the time) up to at least 500 GB of data processed in the query. So if you have a 100 MB table that takes 3 seconds to query and you increase the size a thousand times to 100 GB, it might take only 5 seconds to query. Increasing the size of the table will allow BigQuery to use more hardware to run the query.
There is a limit to the number of execution nodes that will be assigned to any one query, however. Based on current cluster sizing, that limit comes at approximately one-half a terabyte of data processed. If you start with a 1 TB table that you can query in 20 seconds and double it to 2 TB, your queries will now likely take 40 seconds. Note that the relevant size here just includes the fi elds that are touched. If you have 100 fi elds but just read one of them, the effective size is just the size of that single fi eld.
There isn’t actually a hard maximum table size you can process in BigQuery, other than saying that after a certain point, querying the tables may take longer than you’re willing to wait. Multiterabyte queries are fairly common; multi-petabyte queries are not.
Performance Benchmarks
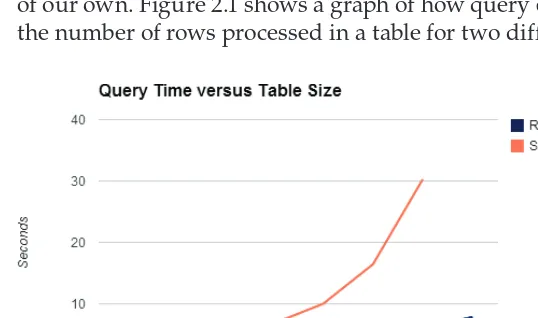
Google doesn’t publish benchmarks against BigQuery because when a company publishes its own benchmarks, people have a tendency to not believe them. In addition, if Google published performance numbers, it could be construed as a promise that users will see similar numbers. Because there seemed to be a lack of available performance information, we decided to run a simple benchmark of our own. Figure 2.1 shows a graph of how query execution time varies with the number of rows processed in a table for two different queries.
The benchmark used a real dataset: daily page views for Wikipedia in 2011. Each run of the benchmark used a sampled set of rows from the underlying dataset and increased by roughly an order of magnitude in size. The smallest table was 1,192 rows; the largest was more than 10 billion rows. The tables are in a publicly available dataset: bigquery-samples:wikipedia_benchmark. You should be able to reproduce similar results on your own (although you should note that several of the tables are large, and it can be easy to run up a serious bill by querying them).
The lower line on the chart corresponds to timings for a simple query that does a regular expression over the title fi eld, groups by the language fi eld, and sorts by the number of views. Here is the query that was used (where <size> ranged from 1k to 10B):
SELECT language, SUM(views) AS views
FROM [bigquery-samples:wikipedia-benchmark<size>] WHERE REGEXP_MATCH(title, "G.*o.*o.*g")
GROUP BY language ORDER BY views DESC
We used a reasonably complex query because we didn’t want it to be some-thing that could be done with a simple fi lter or index, and we wanted to make sure the query engine wouldn’t be able to use any tricks to skip data.
From the chart, you can see that each order of magnitude increase in the table size roughly corresponds to an additional 1 second of query time (the x-axis is plotted in log scale). The fi nal point on the right corresponds to a 10 billion-row table (10,677,046,566 rows, to be exact). Querying this table scans almost one-half a terabyte of data (446 GB).
This query would be extremely slow on a relational database; there isn’t a way to precompute the regular expression results, so a relational database would have to do a table scan. In BigQuery, the query over the largest table took less than 8 seconds, on average, to read half a terabyte and perform 10 billion regular expressions.
We mentioned that there is a size after which you’ll start seeing linear per-formance. To show this, we added another table, this one with more than 100 billion rows, and re-ran the same query. This query processed 4.4 TB and took 69 seconds on average, which is about ten times as long as the query with one tenth the data took. While we didn’t go further than the 100 billion row table in our tests, there are a number of customers who routinely query over tens or hundreds of terabytes at a time.
JOIN EACH (
SELECT title, MAX(views) as max_views
FROM [bigquery-samples:wikipedia-benchmark<size>] GROUP EACH BY title
) AS wiki2
ON wiki1.title = wiki2.title
GROUP EACH BY wiki1.year, wiki1.month, wiki1.day
The timing of these queries can be seen as the Self Join line in Figure 2.1. They take longer than the simple queries, but still increase slowly until about 100 million rows. Increasing from 100 million to a billion rows takes about double the time—still faster than linear but a signifi cant slowdown. You can see, however, that the line ends at the 1 billion row point; this is because the query against the larger 10 billion row table failed with an Insuffi cient Resources error. Chapter 9 gives much more information about which queries will work well, which won’t, and why. That chapter also provides some pointers for what to do when you hit errors like this one.
Cloud Storage System
In addition to being a way to run queries over your data, BigQuery is also a place to store your structured data in the cloud. Although this aspect of BigQuery grew out of necessity—if your data didn’t live in Google’s cloud then, you couldn’t query it—it has grown into a signifi cant and useful subsystem.
Your data is replicated to multiple geographically distinct locations for improved availability and durability. If a Google datacenter in Atlanta gets shut down because of a hurricane, that shouldn’t cause a hiccup in your ability to access your data. Data is also replicated within a cluster, so your data should be virtually immune to data loss due to hardware failure. Of course, the BigQuery service may not have perfect uptime, and if your data is important, you should make sure it is backed up. You can back up your tables by exporting them to Google Cloud Storage for safekeeping, or you can run a table copy job in BigQuery to save a snapshot.
Data Ingestion
Data used in BigQuery must be loaded into the system before it can be queried. The load process transforms your data into a format that is optimized for querying and stores it in locations in physical proximity to the Dremel compute clusters.
Direct upload can be an easier route if you don’t want to go through Google Cloud Storage, because you can follow a standard resumable-upload HTTP protocol. Streaming is the easiest method; you can post individual rows, which will be available for query immediately. That said, for large load operations, or cases in which you want all your data to be available atomically, streaming may not be the best mechanism. For more information about how to get data into BigQuery, Chapter 6, “Loading Data,” describes the various options in detail.
Structured Data Storage
BigQuery is a system that stores and operates on structured data; that is, data that follows a rigid schema. A spreadsheet is an example of structured data, as is a database table. An HTML document, even though it may have predictable fi elds, is unstructured. If your data doesn’t have a schema, or can’t be coerced to a schema, there may be other tools that are better-suited for your use case.
BigQuery schemas describe the columns, or fi elds, of the structured data. Each fi eld has a name and a data type that indicates the kind of data that can be stored in the fi eld. Those data types can be either primitive or record types. Primitive types are basic types that store a single value—a string, a fl oating-point number, an integer, or a boolean fl ag.
A record type, however, is a collection of other fi elds. For the most part, a record is just a way of grouping your fi elds together. For example, if you store location as latitude and longitude, you could have a location record with two fi elds: lat and long. Fields can also be repeated, which means that they can store more than one value.
These last two features—record types and repeated fi elds—distinguish BigQuery from most relational databases, which can store only fl at rows. Records and repeated fi elds enable you to store the data in a more natural way than you might in a relational database. For example, if your table contains customer orders, you might want to store an entire order as a single record, even though there were multiple items in the order. This makes it easier to perform analysis of the orders without having to fl atten the data or normalize it into multiple tables.
Collections of rows of data following a single schema are organized into
tables. These tables are similar to tables in a typical relational database but have some restrictions. The only way to modify BigQuery tables is to append to them or rewrite them—there is no way to update individual rows. BigQuery also doesn’t support table modifi cation queries, like ALTER TABLE, DROP TABLE, or UPDATE TABLE.
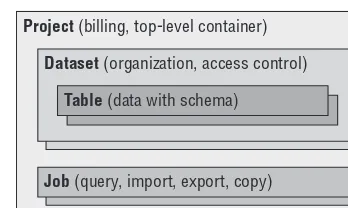
For instance, if you have a MySQL database with your fi nancial data you might want that to be a separate catalog from your user data.
These catalogs map quite well to a BigQuery dataset. Datasets can be shared with other users and groups. Collections of datasets owned by a single user or organization are organized into projects. Projects are a Google Cloud Platform concept that indicates a single billing entity with a team of users in various roles. Chapter 4, “Understanding the BigQuery Object Model,” discusses these abstractions in much more detail.
Distributed Cloud Computing
Google has a lot of hardware in their datacenters. A number of people have tried to fi gure out just how many machines Google has by taking into account things like global PC sales and maximum power capacity of various known Google datacenters. It is a large number. Very few, if any, organizations can match the scale and, as importantly, the organization of Google’s datacenters. Google’s Cloud Platform allows people outside of Google to take advantage of this scale and manageability.
Harnessing the Power of Google’s Cloud
When you run your queries via BigQuery, you put a giant cluster of machines to work for you. Although the BigQuery clusters represent only a small frac-tion of Google’s global fl eet, each query cluster is measured in the thousands of cores. When BigQuery needs to grow, there are plenty of resources that can be harnessed to meet the demand.
If you want to, you could probably fi gure out the size of one of BigQuery’s compute clusters by carefully controlling the size of data being scanned in your queries. The number of processor cores involved is in the thousands, the number of disks in the hundreds of thousands. Most organizations don’t have the budget to build at that kind of scale just to run some queries over their data.
The benefi ts of the Google cloud go beyond the amount of hardware that is used, however. A massive datacenter is useless unless you can keep it running. If you have a cluster of 100,000 disks, some reasonable number of those disks is going to fail every day. If you have thousands of servers, some of the power supplies are going to die every day. Even if you have highly reliable software running on those servers, some of them are going to crash every day.