The Kinetic Approach of NO
xPhotoreaction Related to
Ground Measurement of Solar Radiation in Estimates of
Surface Ozone Concentration
Abdu F. Assomadi
1*, Basuki Widodo
2, Joni Hermana
1 1Department of Environmental Engineering, Faculty of Civil Engineering and Planning
2
Department of Mathematic, Faculty of Mathematic and Science
Institut Teknologi Sepuluh Nopember Surabaya, 60111, Indonesia
Abstract : Surface ozone is a secondary pollutant produced by the collision of oxygen
molecules withoxy-radicals as a result of the photoreaction of nitrogen oxide. Excessive levels of this pollutant cause negative impacts on the environment. Moreover, understanding the formation kinetics and precursors are important for air quality management. This study aims to determine the surface ozone reaction kinetics of formation phase dominant factors (NOx
precursors and influx radiation) in urban areas. These kinetics are based on the recorded measurements of global radiation, remaining NOx and ozone concentration at ground level from
air quality monitoring. These data are then categorised for rainy and dry seasons. Each data category was analysed according to daily pattern and daily maximum value. The relationship and kinetic constants of concerned parameters were determined. The ozone concentration is proportional by factork to the influx radiation and conversely to the remaining nitrogen dioxide in the first-order photoreaction. This relationship is linear with R2greater than 0.9 during both rainy and dry seasons. The value of kinetic constant k is equal to 1.1044 for rainy seasons and to 0.8416 for dry seasons. It shows the factor of influx radiation and remaining [NOx] in an
atmosphere with a dominant rainy as compared to dry season.
Keywords: Air quality, Photochemical kinetics, Atmospheric oxidation, Influx radiation, Urban.
Introduction
Regardless of the importance of other aspects in an urban environment, air pollution is one of the most common problems faced by major cities in developing countries. This problem stems from the fact that many standard parameters measuring the concentrations of air pollutants are frequently violated, such as ozone (O3),
nitrogen dioxide (NO2), sulphur dioxide (SO2), and dust 1
. Increasing air pollutant levels can affect the shift toward radiation equilibrium and particulate stability, with effects on radiative properties2and environmental health. High ozone concentration in the surface atmosphere is injurious to life and plants, materials, as well as serious consequences of the health of the human respiratory system, mainly when ambient concentrations are over acceptable levels3.
Surface zone is not directly emitted from sources because it is a secondary air pollutant. This pollutant results from the oxidation of organic compounds (e.g., methane and other volatile organics) and nitrogen oxides (NOx) in the presence of photon radiation4. During daylight, the photon energy is used by nitrogen dioxide
Recently, de Souza develop an artificial neural network (ANN) method to estimate the level concentration of surface ozone by season of climate data10. Other researchers have found that the ozone concentration is altered according to nitrogen oxide's characteristics, solar radiation, the direction of wind from potential sources11, and changing climate patterns, mainly related to extreme temperatures during the summer season12. The surface ozone concentration varies, with a maximum value at around mid-day and a minimum in the morning3. This study is an urban air quality data analysis, especially for the kinetic of surface ozone due to its precursor availability and influx of measured solar radiation. The intention of this study is to develop the kinetic constants of surface ozone patterns in urban areas as related to the radiative cycle and NO2 as its
precursor.
Materials and Methods
The estimation of surface ozone concentration, related to measured global radiation (GRAD) and NO2
concentration as its precursor in photoreaction, are approached by using: 1) the pattern that describes the concentration changes related to radiation intensity, in daily and monthly cycle during both rainy and dry seasons, 2) mathematical relationship of concerned parameters that is analysed in regression pattern or in the kinetic form of overall reaction that occurs. The entire analysis was conducted based on hourly data monitoring of urban air quality. The parameters studied are expressed as ozone concentration (µg.m-3), NO2concentration
(µg.m-3), and global radiation (watt.m-2). All of approaching estimation are verified with data in tropical country monitoring (case of Surabaya, Indonesia at the latitude (λ) = - 7.23, longitude = 112.74, an average altitude is 5–10 m from the sea level and in year of 2010).
Moreover, all of the data are classified by rainy and dry seasons. For this purpose, the hourly data were selected by normality pattern from the data collected in January, February, and March for the rainy season and the data collected in June, July, and August for the dry season. The daily pattern and daily maximum value are analysed from both season categories. Furthermore, changes in ozone concentration and NO2 as related to the
GRAD are characterised from this pattern. These changes are then used to determine the mathematical relationship of concerned parameters and to approximate the kinetics involved. Result of this mathematic and kinetics expressions use to describe and estimate the surface ozone level change in time for known remaining NO2 and GRAD data.
Results and Discussion
Photoreaction kinetics for the prediction of ozone formation
NO2 is a primary pollutant emitted from its sources, mainly due to the fossil fuel consumption
associated with urban activity, i.e. transportation, industry, and domestic. Any change of atmospheric NO2
concentration is a consequence of such activity. In general, the industrial and domestic activities operate almost continuously, with uniform loads daily. Conversely, the transportation activities have specific cycle pattern. In assumption a constant load from the other sources, the NOx and other pollutant concentration change in urban
area are mainly due to transportation activities13. It can be estimate in proportion to the number of passenger car units (PCU) per time, vehicle emission factor, and fuel consumption13, 14. There are highest loads during peak times in morning and evening in every day14. According to this pattern, the increasing NO2 concentration is in
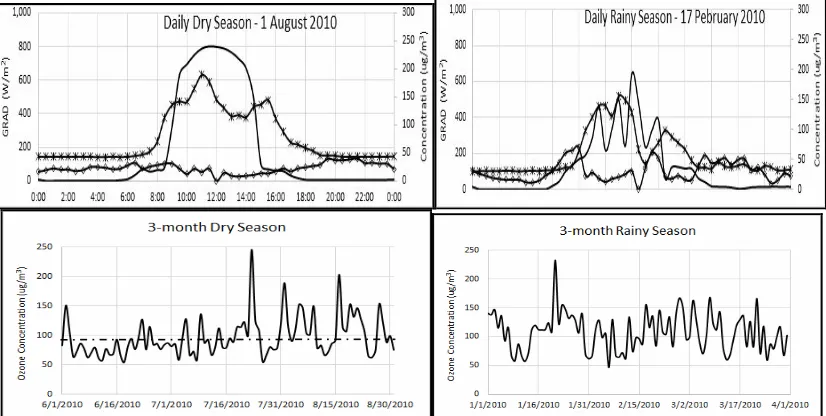
Figure 1. The resume data of surface ozone, NO2, and GRAD (one cycle)
During the daylight, NO2 concentration decreases as influx solar radiation increases, and more surface
ozone is formed by photoreaction. It is reasonably obvious because NO2 is a precursor in the formation of ozone
as part of the surface photoreaction. When the radiation intensity is sufficient to initiate radical reaction, the photoreaction starting immediately for NO2 to produce NO and O radicals. This process is faster as the intensity
is greater, ready for midday. Consequently, the concentration of NO2 will decrease as NO molecules increase.
This is an initiation process of the radical photoreaction.
1
The next process is simultaneous: the O radicals react with free O2 molecules in the atmosphere to
produce ozone molecules. This is a propagation process. More O radicals are formed in the initiation process; more ozone is produced in this reaction. However, the ozone formed may split to O2 and O again. This latter
reaction has a slower reversal rate than the rate of its initial formation.
2
3
In line with the decreasing of solar intensity (after 12.30 pm, see Fig 1.) the reaction 1 is slowing down, yield slower propagation process. In this reaction, due to the accumulation of ozone has been high, the reverse reaction (ozone depletion process) occurs more quickly. The evidence for this assertion comprises reduced concentrations of ozone and the rise of NO2 concentrations again. Ozone that has been depleted into O2 and O
can re-join NO to reform NO2. This process is called a termination.
4
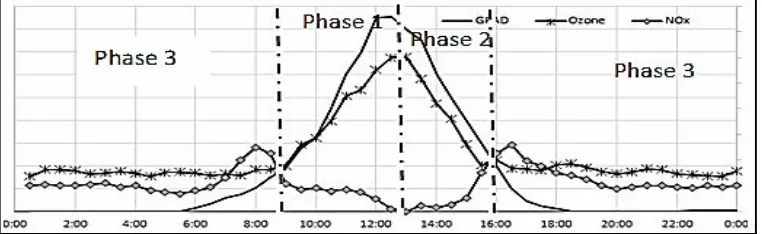
All of the above reactions may be divided in two categories, namely, the reactions of ozone formation and the reactions of ozone depletion. Furthermore, it was analysed from surface ozone cycle, its concentration changes in cycle with three dominant phases. Phase 1 is an increasing or formation phase up to maximum level; Phase 2 is a decreasing or destruction phase up to minimum level; Phase 3 is a steady phase at minimum level with no photoreaction. These phases are illustrated simpler in Fig. 2. The variation of ozone concentration strongly depend on the influx radiation and precursor that are present (i.e., NO2).
Eq.2
Radiation intensity is varies during the formation reaction, and useful to include it parameter as a variable in calculation as the assumed reactants. For steady state, the change in [O] is zero. The rearrangement of Eq. (1) yields:
Eq.3
Eq.4
By substituting Eq. (4) into Eq. (2) we obtain the first order reaction:
Eq.5
From Eq. (5), it appears that the formation of photochemical reactions is only influenced by the initial concentration of NO2 and radiation intensity. By solving the last equation, we get the relationship [O3] with
[NO2] andhv, such as the following:
Eq.6 Eq.7
Eq. (7) specifically applies in the reactor, where there are no external changes during the reaction in terms of the reactants and the intensity of the radiation. Value of [NO2] in the last equation is a initial [NO2]. It must be
converted to the remaining [NO2]. In that reaction system, the initial [NO2] is conversely related to the
remaining [NO2] using this formula:
Eq.8
In regards with natural reaction system in urban atmosphere, the reaction occurs with varied reactants and intensity, therefore we use the Eq. (8) and assume , and thus the Eq. (7) should be modified to be:
Eq.9
The reaction is assumed to be independent from the set reaction, the earlier or the later (no accumulation), withk as the overall reaction constant. In that equation,hv is expressed by the measured GRAD.
Profile of the surface ozone and application of the kinetics
For case of this study, based on recapitulation of analysed data (see Fig. 1 and Fig. 2), the ozone daily cycle phases describes as below:
1. Phase 1 (the surface ozone formation phase) begins at around 08:30 local time and continues up to around mid-day (12:30 or 13:00 local time). During this phase, the surface ozone concentration rises up from about 30–40 µg.m-3to the average maximum value, which is about 110 µg.m-3 during the rainy season and about 90 µg.m-3 during the dry season.
2. Phase 2 or surface ozone destruction phase occurs after mid-day until around 16:00 or 17:00 local time. During this phase, the concentration of ozone decreases to a minimum level at 30–40 µg.m-3.
3. Phase 3 or steady phase in minimum level ozone occurs in the night time until sunrise the next day. During this phase, the concentration is relatively constant at the minimum level.
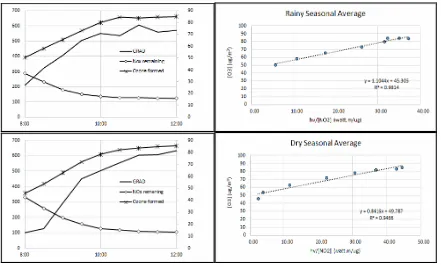
In seasonal analysis, the level of surface ozone appears to have no big difference for rainy and dry season. Average maximum concentration during the rainy season is about 108 µg.m-3; during the dry season, the concentration is 96 µg.m-3, as shown in Fig. 3.
Figure 3. The profile of GRAD, NO2, surface ozone (up) and average of maximum seasonal ozone
concentration (down) in dry and rainy season
Figure 4. Estimated solar influx radiation (top), data observation (middle) and atmosphere clearness index (bottom) in Surabaya 201016
The other interesting fact is the NO2 pattern. Observed data shows the changes of NO2 value differ with
surface ozone pattern in daily cycle. It shows at ending and beginning of phase 3, the concentration of NO2 is
the highest and at transition phase 1 to phase 2 the concentration of NO2 is lowest. It is contrary with surface
ozone pattern. In overall, the pattern of ozone, NO2 and GRAD based on the maximum data analysed is shown
in Fig. 5. This figure shows the complexity of the relationship among parameters, which necessitates the use of kinetic theory for analysis approaches.
For surface ozone formation (phase 1) analysis, applying Eq. (9) for two seasonal average recorded data yielded the good confidence. Result of that application is presented below. First, all of the data (presented in Fig. 5) were analysed to yield the average value of each parameter in both seasons. Then the value ofhv/[NO2]
is calculated from them. This average value is shown in Table 1.
Table 1. The average seasonal GRAD, remained NO2, and O3 formed in formation phase
3 month Drought Seasonal (Jun – Aug. 2010)
8:00 101.6 42.6 45.8 2.4 209.8 36.9 50.4 5.7 8:30 127.6 33.2 53.6 3.8 320.8 29.7 58.1 10.8 9:00 292.8 25.3 63.0 11.6 404.1 23.0 65.4 17.6 9:30 450.2 20.1 72.0 22.4 504.4 19.3 73.0 26.2 10:00 502.1 16.3 78.3 30.7 549.2 17.4 80.0 31.6 10:30 555.9 15.1 81.9 36.9 536.9 16.6 84.3 32.4 11:00 603.2 14.0 83.4 43.0 605.4 16.2 83.7 37.3 11:30 606.0 13.6 84.8 44.6 559.7 16.0 84.5 35.0 12:00 632.3 13.4 85.4 47.1 571.0 15.7 85.0 36.3 12:30 628.4 12.2 84.1 51.6 506.3 15.0 82.4 33.8
According to Eq. (9), the parameters and produce linear association with k as slope
(overall kinetic constant). Using the data presented in Table 1 for graphical analysis and linear regression, we obtained a good linear relationship for both parameters, as seen in Fig. 6.
Figure 6. Trend of averages GRAD, NOx, ozone and [O3] - regression in rainy season (top) and dry
season (bottom)
It relationship is described in linear regression with R2> 0.9 on both rainy and dry seasons. The value of kinetic constantk is equal to 1.1044 for rainy, and 0.8416 in µg2m-1 unit for dry season as see in Fig. 6. Slope
k for rainy season is greater than in dry season. It means that the factor of is more dominant in rainy
Acknowledgements
This study was funded by a grant from the Ministry of National Education and Higher Education 2012– 2015 and the Ministry of Research, Technology, and Higher Education, 2015. All secondary data are provided by the Environmental Agency of Surabaya City Government, accessed in 2015.
References
1. Environmental Agency of Surabaya. (accessed in 2015). Overview of Measured Values and PSI results. Surabaya, Indonesia: The Integrated Air Quality Management for Metropolitan Areas, Regional Data Center.
2. IPCC. (2007). Good Practice Guidance and Uncertainty Management in National Greenhouse Gas Inventories. IPCC-TSU NGGIP. Japan.
3. Sharma, R. K., Chithambarathanu, T., & Elampari, K. (2013). Assessment of Surface Ozone Levels in a Semi-urban Site and Its Predictions Using Neural Network. International Journal of Engineering Research and Applications (IJERA), 3(1), 1527 - 1531. Retrieved from www.ijera.com
4. Sofen, E. D., Bowdalo, D., Evans, M. J., Apadula, F., Bonasoni, P., Cupeiro, M., Torseth, K, et al. (2015). Gridded Global Surface Ozone Metrics for Atmospheric Chemistry Model Evaluation. Earth System Science data Discussion; Open Access, 8, 603 - 647. doi:10.5194/essdd-8-603-2015
5. Seinfeld, J. H., & Pandis, S. N. (2006). Atmospheric Chemistry and Physics, from Air Pollution to Climate Change.New Jersey and Simultaneously in Canada: John Wiley & Sons, Inc.
6. de Souza, A., Aristone, F., & Sabbah, I. (2015). Modeling the Surface Ozone Concentration in Campo Grande (MS) - Brazil Using Neural Networks.Natural Science, 7, 171 - 178.
doi:10.4236/ns.2015.74020
7. Derwent, R. G., & Kay, P. A. (1988). Factor Influencing the Ground Level Distribution of Ozone in Europe.Environmental Pollution, 55, 191 - 219.
8. ChammiReddy, A. K. R., Karthikeyan J. (2016). Development of wind rose diagrams for Kadapa region of Rayalaseema.International Journal of ChemTech Research Vol.9, No.02 pp 60-64, CODEN (USA): IJCRGG ISSN: 0974-4290
9. Monks, P. S., Archibald, A. T., Colette, A., Cooper, O., Coyle, M., Derwent, R., William, M. L., et al. (2014). Tropospheric Ozone and Its Precursors from the Urban to the Global Scale from air quality to short-lived climate forcer. Atmospheric Chemistry and Physics Discussion, 14, 606. doi:10.5194/acpd-14-32709-2014
10. de Souza, A., Aristones, F., & Goncalves, F. V. (2015). Modeling of Surface and Weather Effects Ozone Concentration Using Neural Networks in West Center of Brazil. Climatology and Weather Forecasting, 3(1). doi:10.4172/2332-2594.1000123
11. Banan, N., Latif, M. T., Juneng, L., & Ahamad, F. (2013). Characteristics of Surface Ozone Concentrations at Stations with Different Backgrounds in the Malaysian Peninsula. Aerosol and Air Quality Research, 13, 1090 - 1106. doi:10.4209/aaqr.2012.09.0259
13. Razif, M., Santoso, I. B. (2016). Prediction of CO, CO2, CH4, and N2O Vehicle Emissions from Environmental Impact Assessment (EIA) at Toll Road of Krian-Legundi-Bunder in East Java of Indonesia. International Journal of ChemTech Research, Vol.9, No 03 pp 653-664, CODEN (USA): IJCRGG ISSN: 0974-4290
14. Hermana, J., Wilujeng, S. A., Assomadi, A. F., & Sudibyo. (2013). Study of Carbon Footprint for Ecoregion pattern in East Java, Indonesia. Surabaya, Indonesia: Researh Report, Institut Teknologi Sepuluh Nopember.
15. Widodo, B. (2012). Mathematical Modeling (1-st ed.).Surabaya, Indonesia: ITS Press.
16. Assomadi, A. F., Widodo, B., & Hermana, J. (2015). Determination of Clearness Index in Urban Atmosphere Based on the Data Series of Daily Global Radiation Measured. National Conference of Environmental Technology XII. Surabaya, Indonesia: National Conference of Environmental Technology XII, Environmental Engineering of Institut Teknologi Sepuluh Nopember.
![Fig. 5) were analysed to yield the average value of each parameter in both seasons. Then the value of hv/ [NO2]is calculated from them](https://thumb-ap.123doks.com/thumbv2/123dok/1827578.2101896/6.595.81.533.450.726/analysed-yield-average-value-parameter-seasons-value-calculated.webp)