Contents
1. Learning Outcome Statements (LOS) 2. Study Session 18—Trading
1. Reading 35: Execution of Portfolio Decisions 1. Exam Focus
2. Module 35.1: Market and Limit Orders 3. Module 35.2: The Effective Spread
4. Module 35.3: Alternative Market Structures and Market Quality 5. Module 35.4: Volume-Weighted Average Price and Implementation
Shortfall
6. Module 35.5: Econometric Models and Trading Tactics 7. Module 35.6: Algorithmic Trading
8. Module 35.7: Best Execution 9. Key Concepts
10. Answer Key for Module Quizzes 2. Topic Assessment: Trading
3. Topic Assessment Answers: Trading 3. Study Session 19—Performance Evaluation
1. Reading 36: Evaluating Portfolio Performance 1. Exam Focus
2. Module 36.1: Calculating Return
3. Module 36.2: Data Quality and Decomposing Return 4. Module 36.3: Benchmarks
5. Module 36.4: Macro Attribution 6. Module 36.5: Micro Attribution
7. Module 36.6: Fundamental Factor and Fixed Income Attribution 8. Module 36.7: Risk to Return Analysis
9. Module 36.8: Manager Control 10. Key Concepts
11. Answer Key for Module Quizzes 2. Topic Assessment: Performance Evaluation
3. Topic Assessment Answers: Performance Evaluation
4. Reading 37: Overview of the Global Investment Performance Standards 1. Exam Focus
2. Module 37.1: GIPS Overview
3. Module 37.2: Compliance and Data Requirements 4. Module 37.3: Calculation
5. Module 37.4: Composites 6. Module 37.5: Disclosures
7. Module 37.6: Presentation and Reporting 8. Module 37.7: Real Estate and Private Equity
10. Module 37.9: Verification and After-Tax Reporting 11. Module 37.10: Evaluating a Report
12. Key Concepts
13. Answer Key for Module Quizzes
5. Topic Assessment: Global Investment Performance Standards
STUDY SESSION 18
The topical coverage corresponds with the following CFA Institute assigned reading:
35. Execution of Portfolio Decisions The candidate should be able to:
a. compare market orders with limit orders, including the price and execution uncertainty of each. (page 1)
b. calculate and interpret the effective spread of a market order and contrast it to the quoted bid–ask spread as a measure of trading cost. (page 1)
c. compare alternative market structures and their relative advantages. (page 3) d. explain the criteria of market quality and evaluate the quality of a market when
given a description of its characteristics. (page 5)
e. explain the components of execution costs, including explicit and implicit costs, and evaluate a trade in terms of these costs. (page 8)
f. calculate and discuss implementation shortfall as a measure of transaction costs. (page 9)
g. contrast volume weighted average price (VWAP) and implementation shortfall as measures of transaction costs. (page 12)
h. explain the use of econometric methods in pretrade analysis to estimate implicit transaction costs. (page 14)
i. discuss the major types of traders, based on their motivation to trade, time versus price preferences, and preferred order types. (page 14)
j. describe the suitable uses of major trading tactics, evaluate their relative costs, advantages, and weaknesses, and recommend a trading tactic when given a description of the investor’s motivation to trade, the size of the trade, and key market characteristics. (page 16)
k. explain the motivation for algorithmic trading and discuss the basic classes of algorithmic trading strategies. (page 18)
l. discuss the factors that typically determine the selection of a specific algorithmic trading strategy, including order size, average daily trading volume, bid–ask spread, and the urgency of the order. (page 19)
m. explain the meaning and criteria of best execution. (page 21)
STUDY SESSION 19
The topical coverage corresponds with the following CFA Institute assigned reading:
36. Evaluating Portfolio Performance The candidate should be able to:
a. demonstrate the importance of performance evaluation from the perspective of fund sponsors and the perspective of investment managers. (page 39)
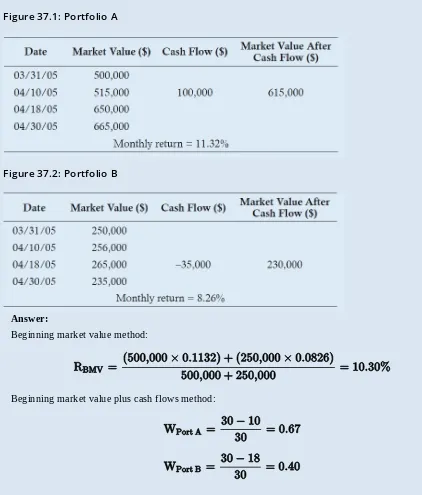
b. explain the following components of portfolio evaluation: performance measurement, performance attribution, and performance appraisal. (page 41) c. calculate, interpret, and contrast time-weighted and money-weighted rates of return
and discuss how each is affected by cash contributions and withdrawals. (page 42) d. identify and explain potential data quality issues as they relate to calculating rates
of return. (page 48)
e. demonstrate the decomposition of portfolio returns into components attributable to the market, to style, and to active management. (page 48)
f. discuss the properties of a valid performance benchmark and explain advantages and disadvantages of alternative types of benchmarks. (page49)
g. explain the steps involved in constructing a custom security-based benchmark. (page 53)
h. discuss the validity of using manager universes as benchmarks. (page 53) i. evaluate benchmark quality by applying tests of quality to a variety of possible
benchmarks. (page 54)
j. discuss issues that arise when assigning benchmarks to hedge funds. (page 55) k. distinguish between macro and micro performance attribution and discuss the
inputs typically required for each. (page 58)
l. demonstrate and contrast the use of macro and micro performance attribution methodologies to identify the sources of investment performance. (page 58) m. discuss the use of fundamental factor models in micro performance attribution.
(page 67)
n. evaluate the effects of the external interest rate environment and active management on fixed-income portfolio returns. (page 68)
o. explain the management factors that contribute to a fixed-income portfolio’s total return and interpret the results of a fixed-income performance attribution analysis. (page 68)
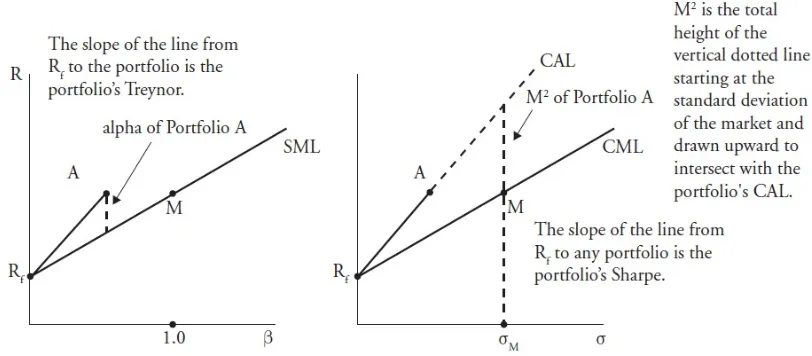
p. calculate, interpret, and contrast alternative risk-adjusted performance measures, including (in their ex post forms) alpha, information ratio, Treynor measure, Sharpe ratio, and M2. (page 75)
q. explain how a portfolio’s alpha and beta are incorporated into the information ratio, Treynor measure, and Sharpe ratio. (page 80)
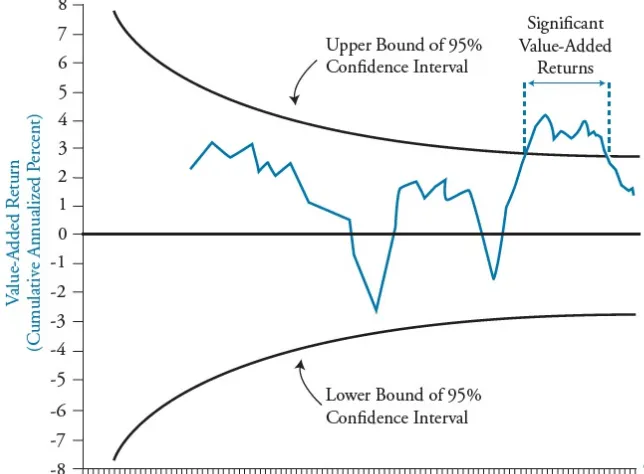
r. demonstrate the use of performance quality control charts in performance appraisal. (page 81)
s. discuss the issues involved in manager continuation policy decisions, including the costs of hiring and firing investment managers. (page 83)
The topical coverage corresponds with the following CFA Institute assigned reading:
37. Overview of the Global Investment Performance Standards The candidate should be able to:
a. discuss the objectives, key characteristics, and scope of the GIPS standards and their benefits to prospective clients and investment managers. (page 109) b. explain the fundamentals of compliance with the GIPS standards, including the
definition of the firm and the firm’s definition of discretion. (page 111)
c. explain the requirements and recommendations of the GIPS standards with respect to input data, including accounting policies related to valuation and performance measurement. (page 113)
d. discuss the requirements of the GIPS standards with respect to return calculation methodologies, including the treatment of external cash flows, cash and cash equivalents, and expenses and fees. (page 115)
e. explain the requirements and recommendations of the GIPS standards with respect to composite return calculations, including methods for asset-weighting portfolio returns. (page 120)
f. explain the meaning of “discretionary” in the context of composite construction and, given a description of the relevant facts, determine whether a portfolio is likely to be considered discretionary. (page 122)
g. explain the role of investment mandates, objectives, or strategies in the construction of composites. (page 123)
h. explain the requirements and recommendations of the GIPS standards with respect to composite construction, including switching portfolios among composites, the timing of the inclusion of new portfolios in composites, and the timing of the exclusion of terminated portfolios from composites. (page 123)
i. explain the requirements of the GIPS standards for asset class segments carved out of multi-class portfolios. (page 126)
j. explain the requirements and recommendations of the GIPS standards with respect to disclosure, including fees, the use of leverage and derivatives, conformity with laws and regulations that conflict with the GIPS standards, and noncompliant performance periods. (page 130)
k. explain the requirements and recommendations of the GIPS standards with respect to presentation and reporting, including the required timeframe of compliant performance periods, annual returns, composite assets, and benchmarks. (page 134)
l. explain the conditions under which the performance of a past firm or affiliation must be linked to or used to represent the historical performance of a new or acquiring firm. (page 134)
m. evaluate the relative merits of high/low, range, interquartile range, and equal-weighted or asset-equal-weighted standard deviation as measures of the internal
dispersion of portfolio returns within a composite for annual periods. (page 134) n. identify the types of investments that are subject to the GIPS standards for real
estate and private equity. (page 139)
p. explain the provisions of the GIPS standards for Wrap fee/Separately Managed Accounts. (page 147)
q. explain the requirements and recommended valuation hierarchy of the GIPS Valuation Principles. (page 148)
r. determine whether advertisements comply with the GIPS Advertising Guidelines. (page 150)
s. discuss the purpose, scope, and process of verification. (page 152)
t. discuss challenges related to the calculation of after-tax returns. (page 153)
Video covering this content is available online.
The following is a review of the Trading principles designed to address the learning outcome statements set forth by CFA Institute. Cross-Reference to CFA Institute Assigned Reading #35.
READING 35: EXECUTION OF PORTFOLIO
DECISIONS
1
Study Session 18
EXAM FOCUS
For the exam, be able to distinguish between limit and market orders and discuss the circumstances under which each is appropriate to use. Be able to calculate midquotes, effective spreads, volume-weighted average price, and implementation shortfall costs. Motivations for trading have always been a CFA Institute favorite, so you should also be able to discuss major trader types, trading tactics, and implementation shortfall strategies.
MODULE 35.1: MARKET AND LIMIT ORDERS
LOS 35.a: Compare market orders with limit orders, including the price and execution uncertainty of each.
CFA® Program Curriculum: Volume 6, page 7
Market microstructure refers to the structure and processes of a market that may affect the pricing of securities in relation to intrinsic
value and the ability of managers to execute trades. The microstructure of the market and the objectives of the manager should affect the type of order the manager uses. The two major types of orders are market orders and limit orders. The first offers greater certainty of execution and the second offers greater certainty of price.
A market order is an order to execute the trade immediately at the best possible price. If the order cannot be completely filled in one trade, it is filled by other trades at the next best possible prices. The emphasis in a market order is the speed of execution. The disadvantage of a market order is that the price it will be executed at is not known ahead of time, so it has price uncertainty.
Video covering this content is available online.
MODULE 35.2: THE EFFECTIVE SPREAD
LOS 35.b: Calculate and interpret the effective spread of a market order and contrast it to the quoted bid–ask spread as a measure of trading cost.
CFA® Program Curriculum: Volume 6, page 10
The bid price is the price a dealer will pay for a security, and the bid quantity is the amount a dealer will buy of a security. The ask or offer price is the price at which a dealer will sell a security and the ask quantity is the amount a dealer will sell of a security. The ask price minus the bid price (the bid-ask spread) provides the dealer’s compensation. In theory it is the total cost to buy and then sell the security.
An overview of some trading terms will help illustrate some of the concepts involved in trading. The prices a dealer offers are limit orders because they specify the price at which they will transact. A dealer’s offering of securities is thus termed the limit order book. Several dealers may transact in the same security and compete against each other for the investor’s business. The best bid price (the highest bid price from the trader’s perspective) is referred to as the inside bid or market bid. The best ask price (the lowest ask price from the trader’s perspective) is referred to as the inside ask or market ask. The best bid price and the best ask price in the market constitute the inside or market quote. Subtracting the best bid price from the best ask price results in the inside bid-ask spread or market bid-ask spread. The average of the inside bid and ask is the
midquote.
The effective spread is an actual transaction price versus the midquote of the market bid and ask prices. This difference is then doubled. If the effective spread is less than the market bid-asked spread, it indicates good trade execution or a liquid security. More formally:
effective spread for a buy order = 2 × (execution price − midquote) effective spread for a sell order = 2 × (midquote − execution price)
Effective spread is a better measure of the effective round trip cost (buy and sell) of a transaction than the quoted bid-asked spread. Effective spread reflects both price improvement (some trades are executed at better than the bid-asked quote) and price impact (other trades are done outside the bid-asked quote).
EXAMPLE: Effective spread
Suppose a trader is quoted a market bid price of $11.50 and an ask of $11.56. Calculate and
interpret the effective spread for a buy order, given an executed price of $11.55.
Answer:
Effective spread on a single transaction may indicate little but be more meaningful when averaged over all transactions during a period in order to calculate an average effective spread. Lower average effective spreads indicate better liquidity for a security or superior trading.
EXAMPLE: Average effective spread
Suppose there are three sell orders placed for a stock during a day. Figure A shows bid and ask quotes at various points in the day.
Figure A: Trade Quotes During a Trading Day
Assume the following trades take place:
At 10 am the trader placed an order to sell 100 shares. The execution price was $12.11. At 1 pm the trader placed an order to sell 300 shares. The execution price was $12.00.
At 2 pm the trader placed an order to sell 600 shares. The average execution price was $11.75.
Calculate the quoted and effective spreads for these orders. Calculate the average quoted and average effective spread. Analyze the results.
Answer:
The quoted spread in Figure B for each order is the difference between the ask and bid prices.
Figure B: Calculated Quoted Spreads
The average quoted spread is a simple average of the quoted spreads: ($0.06 + $0.07 + $0.08) / 3 = $0.07.
The effective spread for a sell order is twice the midquote of the market bid and ask prices minus the execution price.
The midquote for each trade is calculated as in Figure C.
Figure C: Calculated Midquotes
The effective spread for each sell order is shown in Figure D.
Video covering this content is available online.
The average effective spread is ($0.04 + $0.07 + $0.18) / 3 = $0.0967.
A weighted-average effective spread can also be calculated using the relative sizes of the orders. The total number of shares transacted over the day is 1,000 shares (100 + 300+ 600). The weighted-average effective spread is then (100 / 1,000)($0.04) + (300 / 1,000)($0.07) + (600 / 1,000)($0.18) = $0.133.
Analysis:
In the first trade, there was price improvement because the sell order was executed at a bid price higher than the quoted price. Hence, the effective spread was lower than the quoted spread. In the second trade, the quoted price and execution price were equal as were the quoted and effective spread. In the last trade, the trade size of 600 was larger than the bid size of 300. The trader had to “walk down” the limit order book to fill the trade at an average execution price that was less favorable than that quoted. Note that the effective spread in this case was higher than that quoted. Overall, the average effective spreads (both simple and weighted) were higher than the average quoted spread, reflecting the high cost of liquidity in the last trade.
MODULE 35.3: ALTERNATIVE MARKET
STRUCTURES AND MARKET QUALITY
LOS 35.c: Compare alternative market structures and their relative advantages.
CFA® Program Curriculum: Volume 6, page 10
Securities markets serve several purposes: liquidity—minimal cost and timely trading;
transparency—correct and up-to-date trade and market information; assurity of
completion—trouble-free trade settlement (i.e., the trade is completed and ownership is transferred without problems).
There are three main categories of securities markets: 1. Quote-driven: Investors trade with dealers.
2. Order-driven markets: Investors trade with each other without the use of intermediaries.
3. Brokered markets: Investors use brokers to locate the counterparty to a trade. A fourth market, a hybrid market, is a combination of the other three markets.
Additionally, new trading venues have evolved, and the electronic processing of trades has become more common.
Quote-Driven Markets
Quote-driven markets offer liquidity. Traders transact with dealers (a.k.a. market makers) who post bid and ask prices, so quote-driven markets are sometimes called
prices where he will buy or sell. The dealer is providing liquidity by being willing to buy or sell and seeking to earn a profit from the spread.
Many markets that trade illiquid securities (e.g., bond markets) are organized as dealer markets because the level of natural liquidity (trading volume) is low. In such markets, dealers can provide immediate liquidity when none would otherwise exist because they are willing to maintain an inventory of securities. Dealers also provide liquidity for securities whose terms are negotiated (e.g., swap and forward markets). Note that the dealer that offers the best price is not always the one to get a trader’s business because credit risk is more important in some markets (e.g., currency markets) than price. In some dealer markets, the limit order book is closed to the average investor. In these
closed-book markets, an investor must hire a broker to locate the best quote.
Order-Driven Markets
Order-driven markets may have more competition resulting in better prices. Traders transact with other traders. There are no intermediary dealers as there are in quote-driven markets. Dealers may trade in these markets but as a trader, prices are set by supply and demand. The disadvantage is that because there may not be a dealer willing to maintain an inventory of a security, liquidity may be poor. In an order-driven market, orders drive the market and the activity of traders determines the liquidity for a security. Execution of a trade is determined by a mechanical rule, such as matching prices
between a willing buyer and seller.
There are three main types of order-driven markets: electronic crossing networks, auction markets, and automated auctions. In an electronic crossing network, the typical trader is an institution. Orders are batched together and crossed (matched) at fixed points in time during the day at the average of the bid and ask quotes. The costs of trading are low because commissions are low and traders do not pay a dealer’s bid-ask spread. A trade may not be filled or may be only partially filled if there is insufficient trading activity.
The trader usually does not know the identity of the counterparty or the counterparty’s trade size in an electronic crossing network. Because of this, there is no price discovery (i.e., prices do not adjust to supply and demand conditions). This also results in trades unfilled or only partially filled because prices do not respond to fill the traders’ orders. In an auction market, traders put forth their orders to compete against other orders for execution. An auction market can be a periodic (a.k.a. batch) market, where trading occurs at a single price at a single point during the day, or a continuous auction market, where trading takes place throughout the day. An example of the former is the open and close of some equity markets. Auction markets provide price discovery, which results in less frequent partial filling of orders than in electronic crossing networks.
not known. Unlike electronic crossing networks, they are auction markets and thus provide price discovery.
Brokered Markets
In brokered markets, brokers act as traders’ agents to find counterparties for the traders.
Hybrid Markets
Hybrid markets combine features of quote-driven, order-driven, and broker markets. The New York Stock Exchange, for example, has features of both quote-driven and order-driven markets. It has specialist dealers so it trades as a quote-driven market. It also trades throughout the day as in a continuous auction market and trades as a batch auction market at the opening of the exchange.
MARKET QUALITY
LOS 35.d: Explain the criteria of market quality and evaluate the quality of a market when given a description of its characteristics.
CFA® Program Curriculum: Volume 6, page 19
A security market should provide liquidity, transparency, and assurity of completion. Accordingly, the markets should be judged to the extent that they succeed in providing these to traders.
A liquid market has small bid-ask spreads, market depth, and resilience. If a market has small spreads, traders are apt to trade more often. Market depth allows larger orders to trade without affecting security prices much. A market is resilient if asset prices stay close to their intrinsic values, and any deviations from intrinsic value are minimized quickly.
In a liquid market, traders with information trade more frequently and security prices are more efficient. Corporations can raise capital more cheaply and quickly, as more liquidity lowers the liquidity risk premium for securities. Investors, corporations, and securities increase in wealth or value in liquid markets.
There are several factors necessary for a market to be liquid, including:
An abundance of buyers and sellers, so traders know they can quickly reverse their trade if necessary.
Investor characteristics are diverse. If every investor had the same information, valuations, and liquidity needs, there would be little trading.
A convenient location or trading platform which lends itself to increased investor activity and liquidity.
Integrity as reflected in its participants and regulation, so that all investors receive fair treatment.
(regarding completed trades). If a market does not have transparency, investors lose faith in the market and decrease their trading activities.
When markets have assurity of completion, investors can be confident that the counterparty will uphold its side of the trade agreement. To facilitate this, brokers and clearing bodies may provide guarantees to both sides of the trade.
To evaluate the quality of a market, one should examine its liquidity, transparency, and assurity of completion. While transparency and assurity of completion require a
qualitative assessment, liquidity can be measured by the quoted spread, effective spread, and ask and bid sizes. Lower quoted and effective spreads indicate greater liquidity and market quality. Higher bid and ask sizes indicate greater market depth, greater liquidity, and higher market quality.
MODULE QUIZ 35.1, 35.2, 35.3
To best evaluate your performance, enter your quiz answers online. 1. Discuss why a limit order has execution uncertainty.
2. There were three sell orders placed for a stock during a day. The following are the quoted bid and ask quotes at various points in the day.
At 11 am the trader placed an order to sell 200 shares. The execution price was $20.02.
At 12 pm the trader placed an order to sell 300 shares. The execution price was $20.11.
At 2 pm the trader placed an order to sell 500 shares. The average execution price was $20.09.
Calculate the quoted and effective spreads for these orders and the spread averages. Comment on any possible price improvement in each trade.
Video covering this content is available online. 4. An analyst is comparing two markets. Market A has higher average bid and ask
sizes than Market B. Discuss which market has the higher quality and why.
MODULE 35.4: VOLUME-WEIGHTED AVERAGE
PRICE AND IMPLEMENTATION SHORTFALL
LOS 35.e: Explain the components of execution costs, including explicit and implicit costs, and evaluate a trade in terms of these costs.
CFA® Program Curriculum: Volume 6, page 22
The explicit costs of trade execution are directly observable and include commissions, taxes, stamp duties, and fees. Implicit costs are harder to measure, but they are real. They include the bid-ask spread, market or price impact costs, opportunity costs, and delay costs (i.e., slippage costs). They must be inferred by measuring the results of the trade versus a reference point.
Volume-Weighted Average Price (VWAP)
Implicit costs are measured using some benchmark, such as the midquote used to calculate the effective spread. An alternative is the VWAP. VWAP is a weighted average of execution prices during a day, where the weight applied is the proportion of the day’s trading volume.
For example, assume the only trades for a security during the day are: At 10 am 100 shares trade at $12.11.
At 1 pm 300 shares trade at $12.00. At 2 pm 600 shares trade at $11.75.
The total number of shares traded is 1,000, so the VWAP is:
VWAP has shortcomings.
moving down, only execute buy transactions which will be at prices below VWAP. If prices are moving up for the day, only execute sales.
This is related to the more general problem that VWAP does not consider missed trades.
IMPLEMENTATION SHORTFALL
LOS 35.f: Calculate and discuss implementation shortfall as a measure of transaction costs.
CFA® Program Curriculum: Volume 6, page 24
Implementation shortfall (IS) is more complex but can address the shortfalls of VWAP. It is a conceptual approach that measures transaction costs as the difference in
performance of a hypothetical portfolio in which the trade is fully executed with no cost and the performance of the actual portfolio.
IS can be reported in several ways. Total IS can be calculated as an amount (dollars or other currency). For a per share amount, this total amount is divided by the number of shares in the initial order. For a percentage or basis point (bp) result, the total amount can be divided by the market value of the initial order. Total IS can also be subdivided into component costs, which will sum up to the total IS if additional reference prices are assumed.
Total IS is based on an initial trade decision and subsequent execution price. In some cases, a trade may not be completed in a manner defined as timely by the user or the entire trade may not be completed. For all of the IS components to be computed, revisions to the initial price when the order was originated and/or a cancellation price for the order will be needed. Key terms include:
Decision price (DP): The market price of the security when the order is initiated. Often orders are initiated when the market is closed and the previous trading day’s closing price is used as the DP.
Execution price (EP): The price or prices at which the order is executed. Revised benchmark price (BP*): This is the market price of the security if the order is not completed in a timely manner as defined by the user. A manager who requires rapid execution might define this as within an hour. If not otherwise stated, it is assumed to be within the trading day.
Cancellation price (CP): The market price of the security if the order is not fully executed and the remaining portion of the order is canceled.
For the Exam: The CFA text does not use consistent terminology or formulas in this section. Instead, you are expected to understand and be able to apply the concepts to the case specifics and questions. We do apply standardized terminology and formulas in our Notes to assist in learning the concepts, but you will need to work practice questions to develop the skills to apply the IS
approach.
Basic Concepts of Calculation
For a purchase:
An increase in price is a cost.
A decrease in price is an account benefit (a negative cost). For a sale:
An increase in price is an account benefit (a negative cost). A decrease in price is a cost.
Total IS can be computed as the difference in the value of the hypothetical portfolio if the trade was fully executed at the DP (with no costs) and the value of the actual portfolio.
Missed trade (also called opportunity, or unrealized profit/loss) is the difference in the initial DP and CP applied to the number of shares in the order not filled. It can generally be calculated as
|CP − DP| × # of shares canceled
Explicit costs (sometimes just referred to as commissions or fees) can be computed as: cost per share × # of shares executed
Delay (also called slippage) is the difference in the initial DP and revised benchmark price (BP*) if the order is not filled in a timely manner, applied to the number of shares in the order subsequently filled. It can generally be calculated as:
|BP* − DP| × # of shares later executed
Market impact (also called price impact or realized profit/loss) is the difference in EP (or EPs if there are multiple partial executions) and the initial DP (or BP* if there is delay) and the number of shares filled at the EP. It can generally be calculated as:
|EP − DP or BP*| × # of shares executed at that EP
EXAMPLE: Of implementation shortfall and decomposition
On Wednesday, the stock price for Megabites closes at $20 a share.
On Thursday morning before market open, the portfolio manager decides to buy Megabites and submits a limit order for 1,000 shares at $19.95. The price never falls to $19.95 during the day, so the order expires unfilled. The stock closes at $20.05.
On Friday, the order is revised to a limit of $20.06. The order is partially filled that day as 800 shares are bought at $20.06. The commission is $18. The stock closes at $20.09 and the order for the remaining 200 shares is canceled.
Answer:
The DP is $20.00. There was a delay, in this case due to the use of a limit order to buy below the market price. The BP* is $20.05. The increase of $0.05 is a cost in a buy order. The order is partially filled at an EP of $20.06 and there is missed trade cost. 200 shares were not filled and the CP is 20.09. Commissions were $18.00.
The gain or loss on the paper portfolio versus the actual portfolio gain or loss is the total implementation shortfall. The paper portfolio would have purchased all the shares at the decision price with no costs.
The investment made by the paper portfolio is 1,000 × $20.00 = $20,000.
The terminal value of the paper portfolio is 1,000 × $20.09 = $20,090. This is based on the price when the trade is completed, which in this case is when it is canceled.
The gain or loss on the real portfolio is the actual ending value of the portfolio versus the actual expenditures, including costs.
The investment made by the real portfolio is (800 × $20.06) + $18 = $16,066. The terminal value of the real portfolio is 800 × $20.09 = $16,072.
The gain on the real portfolio is $16,072 − $16,066 = $6.
Total implementation shortfall is the difference in results of the hypothetical and actual portfolio of $84.00. The smaller actual gain is a cost.
On a per share basis, this is allocated to the full order of 1,000 shares: $84 / 1,000 = $0.084 per share
As percentage and bp, this is allocated to the hypothetical portfolio cost of $20,000 (= 1,000 × $20.00):
$84 / $20,000 = 0.42% = 42 bp The IS components are:
Missed trade is the CP versus DP on 200 shares. The price increased, which is a cost on a purchase: |$20.09 − 20.00| × 200 = $18.00
$18 / 1,000 = $0.018 per share $18 / $20,000 = 0.09% = 9 bp Explicit costs are $18 and are a cost:
$18 / 1,000 = $0.018 per share $18 / $20,000 = 0.09% = 9 bp
Delay is BP* versus DP on 800 shares. The price increased, which is a cost on a purchase: |$20.05 − 20.00| × 800 = $40.00
$40 / 1,000 = $0.04 per share $40 / $20,000 = 0.20% = 20 bp
Price impact is EP versus DP or in this case versus BP* because there was a delay on 800 shares. The price increased, which is a cost on a purchase:
|$20.06 − 20.05| × 800 = $8.00 $8 / 1,000 = $0.008 per share $8 / $20,000 = 0.04% = 4 bp Verification of total versus components:
$84 = $18 + 18 + 40 + 8
$0.084 = $0.018 + 0.018 + 0.040 + 0.008 0.42% = 0.09% + 0.09 + 0.20 + 0.04 42bp = 9bp + 9 + 20 + 4
Adjusting for Market Movements
We can use the market model to adjust for market movements, where the expected return on a stock is its alpha, αi, plus its beta, βi, multiplied by the expected return on the market, E(RM):
E(Ri) = αi + βiE(RM)
implementation shortfall of 0.42% – 0.96% = –0.54%. With this adjustment, the trading costs are actually negative.
Negative cost means a benefit to the portfolio. The purchase was executed above the original benchmark price (DP) but, when the general increase in market prices is considered, the execution was more favorable than expected.
VWAP VS. IMPLEMENTATION SHORTFALL
LOS 35.g: Contrast volume weighted average price (VWAP) and implementation shortfall as measures of transaction costs.
CFA® Program Curriculum: Volume 6, page 28
As mentioned previously, VWAP has its shortcomings. Its advantages and
disadvantages, as well as those for implementation shortfall, are summarized as follows: Advantages of VWAP:
Easily understood. Computationally simple.
Can be applied quickly to enhance trading decisions.
Most appropriate for comparing small trades in nontrending markets (where a market adjustment is not needed).
Disadvantages of VWAP:
Not informative for trades that dominate trading volume (as described earlier). Can be gamed by traders (as described earlier).
Does not evaluate delayed or unfilled orders.
Does not account for market movements or trade volume. Advantages of Implementation Shortfall:
Portfolio managers can see the cost of implementing their ideas.
Demonstrates the tradeoff between quick execution and market impact. Decomposes and identifies costs.
Can be used in an optimizer to minimize trading costs and maximize performance. Not subject to gaming.
Disadvantages of Implementation Shortfall: May be unfamiliar to traders.
Requires considerable data and analysis. MODULE QUIZ 35.4
To best evaluate your performance, enter your quiz answers online.
1. Suppose there is an illiquid stock that has a limited market of buyers and sellers. In fact, the majority of trading in this firm’s stock is dominated by one trader.
Video covering this content is available online. 2. Use the following information to calculate the implementation shortfall and its
components as a percentage.
On Wednesday, the stock price closes at $50 a share.
On Thursday morning before market open, the portfolio manager decides to buy Megawidgets and transfers a limit order for 1,000 shares at $49.95. The order expires unfilled. The stock closes at $50.05. On Friday, the order is revised to a limit of $50.07. The order is partially filled that day as 700 shares are bought at $50.07. The commission is $23. The stock closes at $50.09 and the order is canceled.
3. Suppose a firm was concerned that its traders were gaming its trading costs analysis. Suggest a measurement of trading costs that is less susceptible to gaming.
MODULE 35.5: ECONOMETRIC MODELS AND
TRADING TACTICS
LOS 35.h: Explain the use of econometric methods in pretrade analysis to estimate implicit transaction costs.
CFA® Program Curriculum: Volume 6, page 30
Econometric models can be used to forecast transaction costs. Using market
microstructure theory, it has been shown that trading costs are nonlinearly related to: Security liquidity: trading volume, market cap, spread, price.
Size of the trade relative to liquidity.
Trading style: more aggressive trading results in higher costs.
Momentum: trades that require liquidity (e.g., buying stock costs more when the market is trending upward).
Risk.
The analyst would use these variables and a regression equation to determine the estimated cost of a trade.
The usefulness of econometric models is twofold. First, trading effectiveness can be assessed by comparing actual trading costs to forecasted trading costs from the model. Second, it can assist portfolio managers in determining the size of the trade. For
4% and the strategy is projected to return 3%, then the trade size should be decreased to where trading costs are lower and the strategy is profitable.
MAJOR TRADER TYPES
LOS 35.i: Discuss the major types of traders, based on their motivation to trade, time versus price preferences, and preferred order types.
CFA® Program Curriculum: Volume 6, page 32
The first type of traders we examine are information-motivated traders. These traders have information that is time sensitive, and if they do not trade quickly, the value of the information will expire. They therefore prefer quick trades that demand liquidity, trading in large blocks. Information traders may trade with a dealer to guarantee an execution price. They are willing to bear higher trading costs as long as the value of their information is higher than the trading costs. Information traders will often want to disguise themselves because other traders will avoid trading with them. They use market orders to execute quickly because these commonly used orders are less noticeable.
Value-motivated traders use investment research to uncover misvalued securities. They do not trade often and are patient, waiting for the market to come to them with security prices that accommodate their valuations. As such, they will use limit orders because price, not speed, is their main objective.
Liquidity-motivated traders transact to convert their securities to cash or reallocate their portfolio from cash. They are often the counterparts to information-motivated and value-motivated traders who have superior information. Liquidity-motivated traders should be cognizant of the value they provide other traders. They freely reveal their benign motivations because they believe it to be to their advantage. They utilize market orders and trades on crossing networks and electronic communication networks (ECNs). Liquidity-motivated traders prefer to execute their order within a day.
Passive traders trade for index funds and other passive investors, trading to allocate cash or convert to cash. They are similar to liquidity-motivated traders but are more focused on reducing costs. They can afford to be very patient. Their trades are like those of dealers in that they let other traders come to them so as to extract a favorable trade price. They favor limit orders and trades on crossing networks. This allows for low commissions, low market impact, price certainty, and possible elimination of the bid-ask spread.
A summary of the major trader types, including their motivations and order preferences, is presented in Figure 35.1.
Other trader types include day traders and dealers. Dealers were discussed earlier and seek to earn the bid-asked spread and short-term profits. Day traders are similar in that they seek short-term profits from price movements.
TRADING TACTICS
LOS 35.j: Describe the suitable uses of major trading tactics, evaluate their
relative costs, advantages, and weaknesses, and recommend a trading tactic when given a description of the investor’s motivation to trade, the size of the trade, and key market characteristics.
CFA® Program Curriculum: Volume 6, page 37
Most portfolio managers have different trading needs at different times. Few can pursue the same trading strategy all the time. In the material to follow, we discuss various trading tactics.
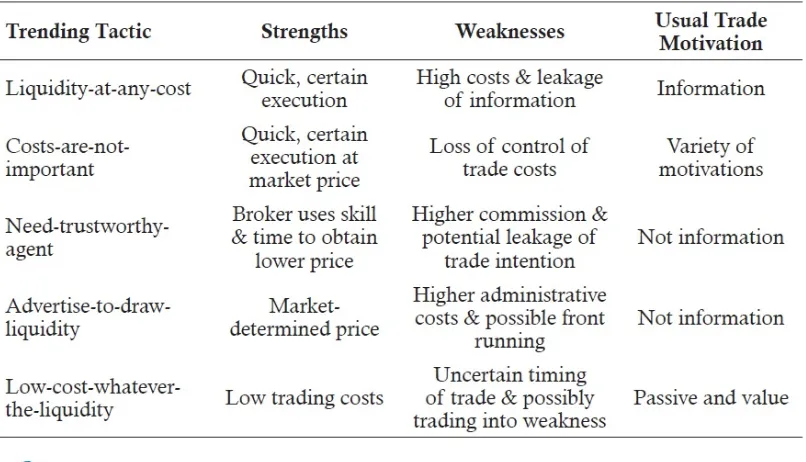
In a liquidity-at-any-cost trading focus, the trader must transact a large block of shares quickly. The typical trader in this case is an information trader but can also be a mutual fund that must liquidate its shares quickly to satisfy redemptions in its fund. Most counterparties shy away from taking the other side of an information trader’s position. The liquidity-at-any-cost trader may be able to find a broker to represent him though because of the information the broker gains in the process. In any event, this trader must be ready to pay a high price for trading in the form of either market impact,
commissions, or both.
In a costs-are-not-important trading focus, the trader believes that exchange markets will operate fairly and efficiently such that the execution price they transact at is at best execution. These orders are appropriate for a variety of trade motivations. Trading costs are not given consideration, and the trader pays average trading costs for quick
execution. The trader thus uses market orders, which are also useful for disguising the trader’s intentions because they are so common. The weakness of a market order is that the trader loses control over the trade’s execution.
order has executed. The weakness of this strategy is that commissions may be high and the trader may reveal his trade intentions to the broker, which may not be in the trader’s best interests.
In an advertise-to-draw-liquidity trading focus, the trade is publicized in advance to draw counterparties to the trade. An initial public offering is an example of this trade type. The weakness of this strategy is that another trader may front run the trade, buying in advance of a buy order, for example, to then sell at a higher price.
In a low-cost-whatever-the-liquidity trading focus, the trader places a limit order outside of the current bid-ask quotes in order to minimize trading costs. For example, a trader may place a limit buy order at a price below the current market bid. The strength of this strategy is that commissions, spreads, and market impact costs tend to be low. Passive and value-motivated traders will often pursue this strategy. Patience is required for this strategy, and indeed its weakness is that it may not be executed at all.
Additionally, if it is executed, the reason may be that negative information has been released. For example, a buy order of this type may only be executed when bad news is released about the firm.
A summary of trading tactics is presented in Figure 35.2. Note that the motivations for need-trustworthy-agent and advertise-to-draw-liquidity tactics are nonspecific but would exclude information-based motivations.
Figure 35.2: Summary of Trading Tactics
MODULE QUIZ 35.5
Video covering this content is available online. 2. Explain why momentum markets would be problematic for a
low-cost-whatever-the-liquidity trading focus.
MODULE 35.6: ALGORITHMIC TRADING
LOS 35.k: Explain the motivation for algorithmic trading and discuss the basic classes of algorithmic trading strategies.
CFA® Program Curriculum: Volume 6, page 40
Algorithmic trading is the use of automated, quantitative systems that utilize trading rules, benchmarks, and constraints. Algorithmic trading is a form of automated trading, which refers to trading not conducted manually. Automated trading accounts for about one-quarter of all trades, and algorithmic trading is projected to grow.
The motivation for algorithmic trading is to execute orders with minimal risk and costs. The use of algorithmic trading often involves breaking a large trade into smaller pieces to accommodate normal market flow and minimize market impact. This
automated process must be monitored, however, so that the portfolio does not become over-concentrated in sectors. This might happen if certain sectors are more liquid than others.
Algorithmic trading strategies are classified into logical participation strategies,
opportunistic strategies, and specialized strategies. Of logical participation strategies, there are two subtypes: simple logical participation strategies and implementation shortfall strategies. We examine these subtypes first.
Simple logical participation strategies break larger orders up into smaller pieces to minimize market impact. There are several subsets to this strategy.
As discussed earlier, a VWAP strategy seeks to match or do better than the day’s volume weighted average price. The historical daily volume pattern is used as the base to determine how to allocate the trade over the day; however, any given day’s actual daily volume pattern can be substantially different.
A time-weighted average price strategy (TWAP) spreads the trade out evenly over the whole day so as to equal a TWAP benchmark. This strategy is often used for a thinly traded stock that has volatile, unpredictable intraday trading volume. Total trading volume can be forecasted using historical data or predictive models.
A percent-of-volume strategy trades a set percentage of normal trading volume until the order is filled.
Implementation shortfall strategies, or arrival price strategies, seek to jointly
minimize market impact and opportunity (missed trade) cost. Logically and empirically, it has been demonstrated that the volatility of trading cost increases with delay in
therefore total trade cost. This variability tends to rise exponentially with the length of the time taken to execute, which has two implications. To minimize implementation shortfall (IS), the trade should generally be front-loaded and favor immediate execution. However, the decision also depends on risk aversion. Higher risk aversion will seek immediate execution for certainty of cost. It accepts greater market impact to minimize potential opportunity cost. Lower risk aversion will allow patient trading in an effort to lower market impact while risking higher opportunity cost and making total cost more variable. This trade-off decision is analogous to mean variance optimization and an efficient frontier. In this case, the two axes are expected trading cost and variability of trading cost.
Specialized algorithmic trading strategies include hunter strategies, where the size of the order or portion seeking execution is adjusted to take advantage of changing market liquidity; market-on-close, which targets the closing price as execution price; and smart routing, which monitors multiple markets and routes the order to the most liquid market.
CHOOSING AN ALGORITHMIC TRADING STRATEGY
LOS 35.l: Discuss the factors that typically determine the selection of a specific algorithmic trading strategy, including order size, average daily trading volume, bid–ask spread, and the urgency of the order.
CFA® Program Curriculum: Volume 6, page 45
The choice of strategy will be primarily driven by three factors:
Size of the order as a percentage of average daily trading volume. Bid-asked spread.
Urgency of the trade.
Large trade size versus trading volume and high bid-asked spread indicate that the market impact of trading quickly is more likely to drive up the price paid to buy or drive down the price paid to sell. Therefore, more patience in trading and some form of
logical participation strategy to break up the order is appropriate. Low urgency would also support breaking up the order and trading over time.
In a more complex situation, an implementation shortfall strategy to minimize expected total IS may be more appropriate. The trader or manager can specify whether to
emphasize speed (and accept higher market impact) or accept higher risk (and take more time to complete the order at the risk that delay and missed trade costs may increase). All else the same, an IS strategy will tend to emphasize speed because over time the market price can move by a larger amount, increasing the risk of high delay and missed trade costs.
A broker or a crossing network can be appropriate if size and spread are high, but the trader can be patient and take the time to try to minimize market impact by seeking out a counterparty to the trade.
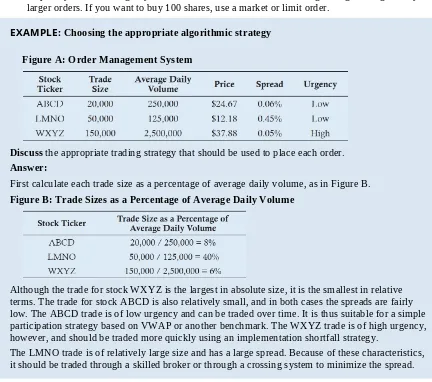
Hopefully it is occurring to you this entire section is advanced trading strategies for generally larger orders. If you want to buy 100 shares, use a market or limit order.
EXAMPLE: Choosing the appropriate algorithmic strategy
Figure A: Order Management System
Discuss the appropriate trading strategy that should be used to place each order.
Answer:
First calculate each trade size as a percentage of average daily volume, as in Figure B.
Figure B: Trade Sizes as a Percentage of Average Daily Volume
Although the trade for stock WXYZ is the largest in absolute size, it is the smallest in relative terms. The trade for stock ABCD is also relatively small, and in both cases the spreads are fairly low. The ABCD trade is of low urgency and can be traded over time. It is thus suitable for a simple participation strategy based on VWAP or another benchmark. The WXYZ trade is of high urgency, however, and should be traded more quickly using an implementation shortfall strategy.
The LMNO trade is of relatively large size and has a large spread. Because of these characteristics, it should be traded through a skilled broker or through a crossing system to minimize the spread.
MODULE QUIZ 35.6
To best evaluate your performance, enter your quiz answers online.
1. A market observer notices that a particular trading firm tends to execute its trades early in the day, with volume falling off later in the day. What type of algorithmic trading system is the firm likely using?
Video covering this content is available online.
MODULE 35.7: BEST EXECUTION
LOS 35.m: Explain the meaning and criteria of best execution.
CFA® Program Curriculum: Volume 6, page 47
Best execution is an important concept because it impacts the client’s
portfolio performance. The CFA Institute has published Trade Management Guidelines for pursuing best execution.2 The Institute compares best execution to prudence.
Prudence refers to selecting the securities most appropriate for an investor, whereas best execution refers to the best means to buy or sell those securities. They are similar in that they both attempt to improve portfolio performance and meet fiduciary responsibilities. The Institute report specifies four characteristics of best execution:
1. Best execution cannot be judged independently of the investment decision. A strategy might have high trading costs, but that alone does not mean the strategy should not be pursued as long as it generates the intended value.
2. Best execution cannot be known with certainty ex ante (before the fact); it depends on the particular circumstances of the trade. Each party to a trade determines what best execution is.
3. Best execution can only be assessed ex post (after the fact). While cost can be measured for any single trade, quality of execution is assessed over time. The cost of a single trade execution is very dependent on the reference or decision price used in its calculation. There can always be distortions. But over time and multiple trades, those costs can be used to indicate the quality of execution. 4. Relationships and practices are integral to best execution. Best execution is
ongoing and requires diligence and dedication to the process.
EVALUATING TRADING PROCEDURES
LOS 35.n: Evaluate a firm’s investment and trading procedures, including processes, disclosures, and record keeping, with respect to best execution.
CFA® Program Curriculum: Volume 6, page 49
The CFA Institute’s Trade Management Guidelines are split into three parts: processes, disclosures, and record keeping. These guidelines are meant to assist investment
management firms in achieving best execution and maximum portfolio value for their clients.
In regard to processes, firms should have policies and procedures that have the intent of maximizing portfolio value using best execution. These policies and procedures should also help firms measure and manage best execution.
Investment management firms should also provide disclosure to their clients and
In regard to record keeping, investment management firms should maintain the documentation supporting (1) the firm’s compliance with its policies and procedures and (2) disclosures made to its clients. In doing so, the firm also provides evidence to regulators as to how the firm pursues best execution for its clients.
LOS 35.o: Discuss the role of ethics in trading.
CFA® Program Curriculum: Volume 6, page 49
Trading is based on word of honor. Buy-side and sell-side traders must honor their verbal agreements or they will quickly find that no one wants to take the opposite side of their trade. The development of complex trading techniques and the decline in explicit commissions have increased the opportunity and temptation to act unethically. Regardless of these developments, buy-side traders should always act in the best interests of their clients. Buy-side traders and portfolio managers have a fiduciary duty to maximize the value of their client’s portfolio. The buy-side trader’s relationships with sell-side traders must never come before the interests of the trader’s clients.
MODULE QUIZ 35.7
To best evaluate your performance, enter your quiz answers online.
1. Are econometric models used as ex ante (before the fact) or ex post (after the fact) investment tools?
2. John Booker is a manager at a trading firm. He is quite upset because yesterday a junior trader had excessive trading costs. Critique Booker’s perspective.
KEY CONCEPTS
LOS 35.a
A market order is an order to execute the trade immediately at the best possible price. If the order cannot be completely filled in one trade which offers the best price, it is filled by other trades at the next best possible prices. The emphasis in a market order is the speed of execution. The disadvantage of a market order is that the price it will be executed at is not known ahead of time, so it has price uncertainty.
A limit order is an order to trade at the limit price or better. For sell orders, the execution price must be higher than or equal to the limit price. For buy orders, the execution price must be lower than or equal to the limit price. If not filled on or before the specified date, limit orders expire. A limit order emphasizes the price of execution. It however may not be filled immediately and may even go unfilled or partially unfilled. A limit order thus has execution uncertainty.
LOS 35.b
The effective spread is compared against the quoted spread to evaluate the cost of trading. It captures both price improvements and the costs of market impact:
effective spreadbuy order = 2 × (execution price − midquote) effective spreadsell order = 2 × (midquote − execution price) LOS 35.c
Quote-driven markets: Investors trade with dealers.
Order-driven markets: Investors trade with each other without the use of intermediaries. There are three main types:
a. In an electronic crossing network, orders are batched together and crossed (matched) at fixed points in time during the day at the average of the bid and ask quotes.
b. In auction markets, trader orders compete for execution.
c. Automated auctions are computerized auction markets and provide price discovery.
Brokered markets: Investors use brokers to locate the counterparty to a trade. This service is valuable when the trader has a large block to sell, when the trader wants to remain anonymous, and/or when the market for the security is small or illiquid. A hybrid market is a combination of the other three markets. For example, the New York Stock Exchange has features of both quote-driven and order-driven markets.
LOS 35.d
In a transparent market, investors can, without significant expense or delay, obtain both pre-trade information and post-trade information. If a market does not have
transparency, investors lose faith in the market and decrease their trading activities. When markets have assurity of completion, investors can be confident that the
counterparty will uphold their side of the trade agreement. To facilitate this, brokers and clearing bodies may provide guarantees to both sides of the trade.
LOS 35.e
The explicit costs in a trade are readily discernible and include commissions, taxes, stamp duties, and fees. Implicit costs are harder to measure, but they are real. They include the bid-ask spread, market or price impact costs, opportunity costs, and delay costs (i.e., slippage costs).
LOS 35.f
Implementation shortfall is the difference between the actual portfolio’s return and a paper portfolio’s return.
For a purchase:
An increase in price is a cost.
A decrease in price is an account benefit (a negative cost). For a sale:
An increase in price is an account benefit (a negative cost). A decrease in price is a cost.
Total IS can be computed as the difference in the value of the hypothetical portfolio if the trade was fully executed at the DP (with no costs) and the value of the actual portfolio.
Missed trade (also called opportunity, or unrealized profit/loss) is the difference in the initial DP and CP applied to the number of shares in the order not filled. It can generally be calculated as:
|CP − DP| × # of shares canceled
Explicit costs (sometimes just referred to as commissions or fees) can be computed as: cost per share × # of shares executed
Delay (also called slippage) is the difference in the initial DP and revised benchmark price (BP*) if the order is not filled in a timely manner applied to the number of shares in the order subsequently filled. It can generally be calculated as:
|BP* − DP| × # of shares later executed
Market impact (also called price impact or realized profit/loss) is the difference in EP (or EPs if there are multiple partial executions) and the initial DP (or BP* if there is delay) and the number of shares filled at the EP. It can generally be calculated as:
|EP − DP or BP*| × # of shares executed LOS 35.g
Computationally simple.
Can be applied quickly to enhance trading decisions.
Most appropriate for comparing small trades in nontrending markets (where a market adjustment is not needed).
Disadvantages of VWAP:
Not informative for trades that dominate trading volume. Can be gamed by traders.
Does not evaluate delayed or unfilled orders.
Does not account for market movements or trade volume. Advantages of Implementation Shortfall:
Portfolio managers can see the cost of implementing their ideas.
Demonstrates the tradeoff between quick execution and market impact. Decomposes and identifies costs.
Can be used in an optimizer to minimize trading costs and maximize performance. Not subject to gaming.
Disadvantages of Implementation Shortfall: May be unfamiliar to traders.
Requires considerable data and analysis. LOS 35.h
Econometric models can be used to forecast transaction costs. Using market
microstructure theory, it has been shown that trading costs are nonlinearly related to: Security liquidity: trading volume, market cap, spread, price.
Size of the trade relative to liquidity.
Trading style: more aggressive trading results in higher costs.
Momentum: trades that require liquidity [e.g., buying (selling) when the market is trending upward (downward)].
Risk.
The analyst uses these variables and a regression equation to forecast the estimated cost of a trade.
The usefulness of econometric models is twofold. First, trading effectiveness can be assessed by comparing actual trading costs to forecasted trading costs from the model. Second, it can assist portfolio managers in determining the size of the trade.
LOS 35.i
Information-motivated traders trade based on time-sensitive information; thus, they prefer market orders because their trades must take place quickly. Their trades demand liquidity, and they are willing to bear higher trading costs.
Liquidity-motivated traders transact to convert their securities to cash or reallocate their portfolio from cash. They utilize market orders and trades on crossing networks and electronic communication networks (ECNs). Liquidity-motivated traders prefer to execute their order within a day.
Passive traders trade for index funds and other passive investors. They favor limit orders and trades on crossing networks. This allows for low commissions, low market impact, price certainty, and possible elimination of the bid-ask spread.
LOS 35.j
In a liquidity-at-any-cost trading focus, the trader must transact a large block of shares quickly. The typical trader in this case is an information trader but can also be a mutual fund that must liquidate its shares quickly to satisfy redemptions in its fund. This trader must be ready to pay a high price for trading in the form of market impact,
commissions, or both.
In a costs-are-not-important trading focus, the trader believes that exchange markets will operate fairly and efficiently such that the execution price they transact at is at best execution. The trader thus uses market orders.
In a need-trustworthy-agent trading focus, the trader employs a broker to skillfully execute a large trade in a security, which may be thinly traded. The weakness of this strategy is that commissions may be high and the trader may reveal his trade intentions to the broker.
In an advertise-to-draw-liquidity trading focus, the trade is publicized in advance to draw counterparties to the trade. The weakness of this strategy is that another trader may front run the trade, buying in advance of a buy order.
In a low-cost-whatever-the-liquidity trading focus, the trader places a limit order outside of the current bid-ask quotes in order to minimize trading costs. Passive and value-motivated traders will often pursue this strategy.
LOS 35.k
Algorithmic trading is the use of automated, quantitative systems that utilize trading rules, benchmarks, and constraints to execute orders with minimal risk and costs. Algorithmic trading strategies are classified into logical participation strategies (simple logical and implementation shortfall strategies), opportunistic strategies, and specialized strategies.
Simple logical participation strategies seek to trade with market flow so as to not become overly noticeable to the market and to minimize market impact.
Implementation shortfall strategies, or arrival price strategies, minimize trading costs as defined by the implementation shortfall measure or total execution costs.
Opportunistic participation strategies trade passively over time but increase trading when liquidity is present.
Specialized strategies include passive strategies and other miscellaneous strategies. LOS 35.l
Algorithmic strategies when all three are low (e.g., VWAP strategy). Implementation shortfall for low size and spread but with high urgency.
A broker or crossing network when size and spread are high but urgency is low. LOS 35.m
CFA Institute compares best execution to prudence. Prudence refers to selecting the securities most appropriate for an investor, whereas best execution refers to the best means to buy or sell those securities. They are similar in that they both attempt to improve portfolio performance and meet fiduciary responsibilities.
Four characteristics of best execution:
1. It depends on the value added of the trade versus cost. 2. Best execution and value added cannot be known ex ante.
3. Best execution and cost can only be calculated ex post. Assessing value added may take even longer to evaluate if the idea works out.
4. Relationships and practices are integral to best execution. Best execution is ongoing and requires diligence and dedication to the process.
LOS 35.n
The CFA Institute’s Trade Management Guidelines are split into three parts: 1. Processes: Firms should have policies/procedures that have the intent of
maximizing portfolio value using best execution. These should help firms determine and manage best execution.
2. Disclosures: Investment management firms should provide disclosure to their clients and potential clients regarding (1) general information on their trading techniques, markets, and brokers and (2) their conflicts of interest related to trading. This information should be provided periodically to clients.
3. Record Keeping: Investment management firms should maintain the
documentation supporting (1) the firm’s compliance and (2) disclosures made to its clients. In doing so, the firm also provides evidence to regulators as to how the firm pursues best execution for its clients.
LOS 35.o
Trading is based on word of honor. Buy-side and sell-side traders must honor their verbal agreements or they will quickly find that no one wants to take the opposite side of their trade. The development of complex trading techniques and the decline in explicit commissions have increased the opportunity and temptation to act unethically. Regardless of these developments, buy-side traders should always act in the best interests of their clients. Buy-side traders and portfolio managers have a fiduciary duty to maximize the value of their client’s portfolio. The buy-side trader’s relationships with sell-side traders must never come before the interests of the trader’s clients.
1 The terminology utilized in this topic review follows industry convention as presented in Reading 35 of the 2019 Level III CFA curriculum.
ANSWER KEY FOR MODULE QUIZZES
Module Quiz 35.1, 35.2, 35.3
1. A limit order has execution uncertainty because it is not known when the order will be filled, if at all. If the limit price cannot be satisfied in the current market, the order will go unfilled. Because limit orders have an expiration date, the limit may go unfilled or partially unfilled if it cannot be satisfied prior to expiration. (Module 35.1, LOS 35.a)
2. The quoted spread for each order is the difference between the ask and bid prices:
The average quoted spread is a simple average of the quoted spreads: ($0.08 + $0.10 + $0.12) / 3 = $0.10.
The effective spread for a sell order is twice the midquote of the market bid and ask prices minus the execution price.
The midquote for each trade is calculated as:
The effective spread for each sell order is:
The average effective spread is ($0.04 + $0.04 + $0.18) / 3 = $0.0867.
In the first and second trade, there was price improvement because the sell orders were executed at bid prices higher than the quoted prices. Hence, the effective spread was lower than the quoted spread. In the last trade, the trade size was larger than the bid size. The effective spread in this case was higher than that quoted due to the market impact of the large order.
Overall, the simple average effective spread was lower than the average quoted spread, reflecting the price improvement in the first two trades. The weighted-average effective spread was higher than the weighted-average quoted spread, reflecting the market impact of the last trade, which was larger than either of the first two trades. (Module 35.2, LOS 35.b)
3. The market probably most suitable is a brokered market. A broker can place the order without revealing his client’s identity. He can discreetly shop the stock and find the necessary liquidity. He may even take a position in the stock with his own capital.
An electronic crossing network might be another possibility because traders usually do not know the identity of their counterparty or their trade size. The question states, however, that the stock is an emerging market stock for which brokered markets are particularly suited. Brokered markets are important in countries where public capital markets are not well developed. (Module 35.3, LOS 35.c)
4. Market A is of higher quality. The larger the bid and ask sizes (the number of shares offered by a dealer or trader at a specified price), the greater the market depth and the greater the liquidity. (Module 35.3, LOS 35.d)
Module Quiz 35.4
1. The trader who makes up the majority of the trading volume will dominate the determination of VWAP. That trader’s execution prices will, on average, be close to VWAP, so the trader’s execution will appear as high quality. Evaluation of the other trader’s results will be random versus VWAP. (LOS 35.g)
2. First, organize the information. The trade decision was made while the market was closed, making DP the previous close of 50.00. There was a one-day delay in execution making BP* 50.05. There was an unexecuted trade portion and a CP of 50.09. EP was 50.07. Total explicit costs are given as $23. (Note that a limit price is not a direct part of IS calculations, though it may affect EP and create delays.)
Explicit cost—the commission as a percentage of the paper portfolio investment is $23 / $50,000 = 0.05%.
Realized profit and loss is EP – DP (or BP*). This is divided by the DP and weighted by proportion of the order filled. It is (700 / 1,000) × ($50.07 – $50.05) / $50.00 = 0.03%.