RECOVERING A COLLAPSED MEDIEVAL FRESCO BY USING 3D MODELING
TECHNIQUES
F. Chiabrandoa, F. Rinaudob,*
a
Politecnico di Torino - DIATI - Corso Duca degli Abruzzi 24, 10129 Torino, Italy- [email protected] b
Politecnico di Torino - DAD - Viale A. Mattioli 39, 10125 Torino, Italy- [email protected]
Commission V, WG V/2
KEY WORDS: 3D modelling, Internal Calibration, LIDAR, Old images, Restoration
ABSTRACT:
The paper presents the results of a reconstruction of the 3D model of a dome and of a medieval fresco, collapsed after an earthquake and now reconstructed in significant portions, to offer to the visitors a possible reconstruction of the lost masterpiece of medieval art. After the earthquake the collapsed dome was replaced by means of a concrete sphere connected with the survived portions of the old dome’s timber. The old dome shape and the fresco were virtually reconstructed thanks to a set of historical pictures obtained by Italian, USA and German archives; those images have been calibrated and oriented by using modern digital photogrammetric approach and a realistic 3D model of the old inner surface of the dome has been realised. By using a LiDAR survey the 3D model of the apse and of the dome, has been set up and the boundaries between original and new structures have been reconstructed by visual evidences.The new dome has been virtually erased and the old dome with the fresco 3D model inserted allowing the reconstruction of the apse as it was before the earthquake. This virtual 3D model has been used to realise a 1:1 scale model of the old dome where the restorers fit some parts of the old fresco fragments recovered just after the earthquake, cleaned and classified. The fresco images correctly oriented inside the reconstructed dome have been projected on plane surfaces by using azimuthal orthographic projections of small portions of the dome in order to reduce the geometric deformations and to allow the mosaicking of these small planes onto a spherical surface.
1. INTRODUCTION
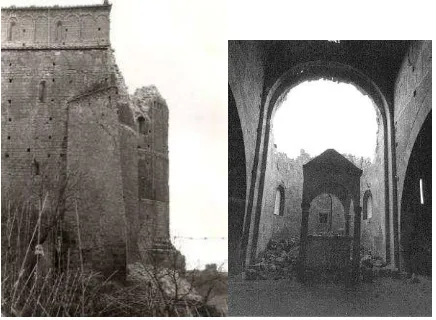
In 1971 an earthquake in the central part of Italy partially destroyed the old Basilica of San Pietro in Tuscania (100 km North of Rome).
The structural elements of the church were not damaged but the apse’s dome with a precious medieval fresco was completely destroyed (see Figures 1).
Figure 1. Outside (left) and inside (right) view of the dome after the earthquake in 1971.
Just after the earthquake all the recognizable fragments of the fresco were extracted from the ruins and preserved after a cleaning and first classification procedure.
Unfortunately in the last 70 years before the earthquake the church was completely abandoned and some parts of the fresco was yet lost (see Figure 2).
In the last 10 years, by using some enlargements of the old pictures of the fresco, some parts of it were reconstructed to allow a possible restoration and/or a replica of some details.
Figure 2. The fresco as it was in 1925 (left –courtesy of ICCD), 1954 (centre – courtesy of ICCD) and 1969 (right – made by Hutzel Max. Courtesy of Research Library, The Getty Research
Institute, Los Angeles - 86.P.8)
After the earthquake the Italian authorities financed a simple protection of the ruins by inserting a concrete spherical dome to protect the apse and started a series of restorations of the whole complex of the Basilica (the church, the bishop’s palace, two medieval towers. See Figure 3).
In 2006 the Italian authorities started a big valorisation project which aims were the restoration of the medieval fresco: the final decision was to remake all the possible details of the fresco by using original fragments inserted in a realistic 3D model which will be placed inside the apse in order to allow a realistic reproduction of the lost masterpiece of medieval painting art. Therefore, it was pointed out the necessity to define the real shape of the apse’s dome and the virtual replication of the fresco by using the best images acquired before the earthquake. ISPRS Annals of the Photogrammetry, Remote Sensing and Spatial Information Sciences, Volume II-5, 2014
Actually the San Pietro site is composed by different structures with heterogeneous architectural styles realized over some centuriesfor historical reasons: the Basilica, two medieval towers and a palace used in the past as Bishop main site. The Basilicais a Romanic style building with three naves: the most ancient nucleus (XI cent. a. C.) is represented by the crypt, whichwas realized under the actual settlement of the basilica, the apse and the first part of the naves. It is surrounded by the ruins of the ancient Bishop citadel and it is placed on the top of the Civita Hill (Figure 3 left) in a rural area outside thecurrent urban area of Tuscania; the Basilica was the religious center before the gradual abandonment of the area. In theXIII century the Basilica reached the actual shape: the three naves were protracted and the main façade was realized byusing a monumental decorative apparatus (Figure 3 right).
Figure 3: A view of the Civita Hill (left) and the main facade of the Basilica di San Pietro (right).
2. DOME’S SHAPE RECOVERING
The only possible way to recover the old shape of the apse’s dome is the photogrammetric approach by using old stereoscopic images (Salma,1980); in fact no other metric documentation was available in national archives and university libraries.
In the last 20 years all the photographic Cultural heritage pictures (both glass and film pictures) of the official Italian Institutions have been digitized and documented, therefore it was easy to find out all the documented pictures present in Italy about the fresco before the earthquake. The main results were obtained from the Italian Centre of Restoration (ISCR) and Italian Centre of Cataloguing and Documentation (ICCD) archives. Some other international private institutions were involved in order to find out possible stereoscopic images of the fresco: in particular the Library of the Getty Research Institute (Los Angeles - U.S.A.) and the Hirmer photographic archive (Munich – Germany) sent interesting pictures realised some years before the earthquake (see Figure 2).
The photographic documentation of Cultural Heritage in Italy and the results of old archived photographic surveys rarely offer images suitable for photogrammetric measurements. This is clearly associated to the aim of the photographer usually not connected to the photogrammetric point of view . Today thanks to the development of digital photogrammetry and the possibility to use also images with extreme taking conditions (not useful when photogrammetry used analogical or analytical plotters) allow to find out, among the 54 collected images, the useful pictures to solve the problem.
2.1 Image selection and calibration
In order to fit the goals of the work the images to be used have to fit some basic properties.
The images have to offer in a stereoscopic view all the collapsed parts of the dome and all the elements still present in the apse today. These conditions have to be fitted in a strict way because they will allow a complete reconstruction of the
collapsed dome, the possibility to locate the Ground Control Points (GCPs, necessary both to calibrate the images and to estimate their exterior orientation parameters) on the elements still present in the apse today, and the possibility to understand, also from a geometric point of view, the original parts of the apse that were not moved during the restorations in the 70’s. In addition the selected images have to be digitized at a minimum metric resolution of 600 dpi in order to fit the minimum requirement of digital photogrammetry. These minimum requirements are justified by considering that only the images acquired before 1954 will be used due to the high loss of fresco’s details registered in the more recent pictures.
At that epoch all the pictures were acquired just by using black and white films and usually the resolutions of the used films were not so high; metric resolutions higher than 600 dpi and radiometric depth higher than 8 bit can cause just noise to the digital algorithms.
Among all the images dating before 1954 just two of them fit all the requirements above expressed (see Figure 4).
The selected pictures were originally recorded on b/w film 4.5cm x6 cm: those pictures were digitized more than 10 years ago with a metric resolution of 300 dpi that was not judged sufficient to the aims of the works.
The ISCR kindly allowed a new digitisation of the original films by using a photogrammetric scanner: a 600 dpi resolution has been used.
In the ISCR’s archive it is not possible to find any information about the used camera, therefore, a complete self-calibration by using GCPs has been planned.
The GCPs have been surveyed by using a multi forward intersection survey scheme and a total station LEICA TS06 (the coordinate of the points were estimated with a millimetric precision).
The self-calibration was performed for each image also if it was clear that both the images were acquired by using the same camera; the lack of information about the focus used and the possible different deformation occurred for the two original films, suggested this approach.
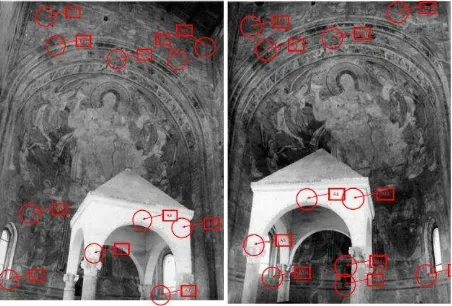
Figure 4. ISCR’s images 6172 – 6174 with GCP’s used for the self-calibration
For each image 11 GCPs were available but for each image a different set of GCPs was selected by considering the appearance of the points for a good collimation.
The calibration model has been selected by using different set of distortion parameters and adopting the solution which gave the minimum discrepancies on GCPs.
Table 1 shows the results of image calibrations that was estimated by using a simple model for residual distortionslimited to a radial distortion, modelled by a 5th degree polynomial.
IMAGE 6172 IMAGE 6174
Table 1. Calibration parameters of the used images
The calibration has been performed by using a software developed by the authors (Malan, 1993) based on resection with additional parameters (Salma, 1980).
The decision to calibrate first the images and then to estimate their exterior orientation parameters was adopted after some trial of self-calibration (interior and exterior orientation parameters) by using the Leica Photogrammetric Suite platform (LPS): in these cases the results were always worst then the one obtained by separating the calibration of the images and their exterior orientation.
2.2 Image orientation
By using the obtained calibration parameters described in the previous paragraph the exterior orientation parameter estimation was performed by using the LPS software.
The GCPs were selected among all the points surveyed for the calibration of the images: obviously the selected points are visible and well represented for a consistent stereoscopic collimation on both the images. The number of the GCPs was limited to 6 in order to obtain a correct estimation of the exterior orientation parameters by using the least squares approach (a number of solving equations equal to the double of the unknowns). The remaining stereoscopic points on the images was then used as Control Points (CPs) to estimate also the accuracy of the exterior orientation parameters estimation. Figure 5 show the spatial distribution of the GCPs and CPs used in this step.
Figure 5. GCPs (left) and CPs (right) used for exterior orientation parameter and accuracy estimations (showed on the
6172 ISCR’s image)
Table 2 shows the results obtained: the residuals on GCPs and the discrepancies between the surveyed coordinates of CPs and the ones obtained by a traditional plotting.
By considering that the taking distance is of about 10 m it is possible to appreciate the obtained results as a good
photogrammetric solution also by using non metric images and a not an optimal spatial distribution of the GCPs.
The exterior orientation parameter estimation has been defined inside the coordinate system used during the LiDAR survey in order to be able in the following steps of the work in a coherent reference system.
Residual’s m.s.e. 0.002 0.006 0.013
CPs rX [m] rY [m] rZ [m]
Tabel 2. Discrepancies on GCPs and CPs after exterior orientation parameters estimation
2.3 Old dome modelling
Using the obtained results it was possible to plot the old dome shape by using matching procedures with a huge integration of manual plotting to integrate the results of automatic 3D recovering (Figure 6) (approx.1 point each 5 mm).
The resulting point cloud is of about 4000 points and by using their coordinates a least square interpolation allowed the estimation of the radius of the interpolating sphere and the estimation of the discrepancies of the known points coordinates by considering the sphere ad the reference surface(Kalisperakis, 2003; Lerma, 2005).The results can be summarized in that way: the surveyed points of the old dome can be interpolated by means of a sphere with a radius of 3.35 m.
Figure 6. The two oriented images and the graphical results of the plotting of the old surface of the dome
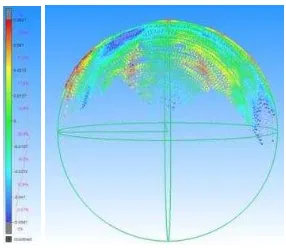
Figure 7. Coloured graphical representation of the discrepancies between the interpolated sphere and the surveyed points. ISPRS Annals of the Photogrammetry, Remote Sensing and Spatial Information Sciences, Volume II-5, 2014
By checking the distances between the surveyed points and the interpolated sphere the values of the discrepancies range from -0.051 m up to 0.054 m with a standard deviation of about 0.024 m (Figure 7).
Some points located near the line of the vertical wall have not been considered because they could be modified during the restoration to connect the new spherical dome.
The amount of the discrepancies can be interpreted as measurement residual errors and not perfect sphericity of the original plaster, therefore for the practical use of the recovered model (to build up some 1:1 scale model of the interesting portion of the dome) the restorers judged sufficient to adopt the sphere as the inner surface of the apse’s basin.
3. APSE 3D MODEL RECONSTRUCTION
The last planned step is the insertion of the old dome model texturized with the old photos inside the model of the existing apse after the virtual elimination of the concrete dome today present.
The model of the existing apse has been surveyed by means LiDAR techniques (see Figure 8) during the documentation process of the church.
The LiDAR acquisitions were performed by using the RIEGL LMS-Z420 scanner.
Each scan was previously verified in terms of overlaps between adjacentscans in order to reach an overlap of at least 30%, which is necessary to guarantee an accurate registration of the scans.
Theregistration of the recorded point clouds was realized by using the RISCAN PRO software in order to reach anapproximate 3D model of all the acquired surfaces (Bohletr, 2005; Bonora et al., 2005; El Hakim et al., 2008). During this phase all the visible reflective targets were employed togive a preliminary solution, than an ICP approach (Bae, 2004; Del Pizzo, 2011; Shutz, 2002; Sharp, 2002) was used to refine the registration. The most accurate survey was performed in the apse part in order to rebuild the shape of this actual part (Figure 8) of the Basilica and moreover for the extraction of the information usable for the reconstruction purpose (Figure 9).
Figure 8. The apse and his surrounding actual shape
After this first step, following a traditional modelling approach (Lo Turco, 2009) , by superimposing the old dome’s model to the today’s model it was possible to evaluate the parts of the apse that can be considered originals and the ideal line of intersection between the dome and the vertical walls (see Figure 9).
This 3D line definition has been performed by generating several sections of the two models (positioned in the same
coordinate system) and by judging where the old model can be replaced instead the existing one (see Figure 10 and 11). Once the border between old structures and new structures has been defined it was possible to eliminate the concrete dome and the reconstructed parts and to insert the original 3D information coming from the historical images as described in the previous paragraphs (see Figure 12).
Figure 9. Shaded and textured 3D model of the existing apse
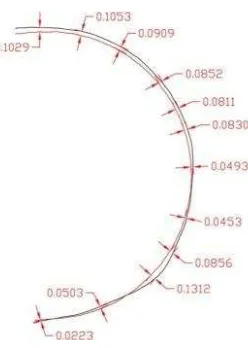
Figure 10. Graphical representation of the differences between LiDAR model and the recovered shape of the dome
Figure 11. One of the sections used to define the borders of the original parts of the apse and the new dome
Finally the images used for the geometric recovering of the old shape has been used to realize a textured 3D model in order to be able to proceed towards the realisation of the 1:1 scale model ISPRS Annals of the Photogrammetry, Remote Sensing and Spatial Information Sciences, Volume II-5, 2014
of the old dome and to allow the restorers to reproduce some of the possible pieces of the original fresco (see Figure 13).
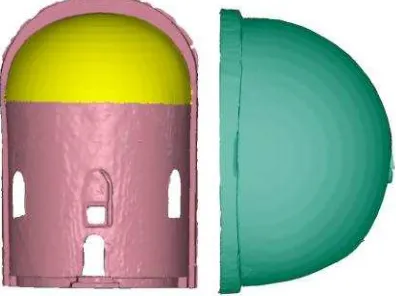
Figure 12. Front view of the existing apse (pink) and historical shapes (yellow) inside the virtual 3D model of the original apse
before the earthquake (left), top view (right)
Figure 13. 3D model with texture extracted from the images acquired in 1954 used for the geometric recovering of the no
more existing dome.
4. FRESCO REAL MODEL
The restorers decide to realise some portions of the dome where the collected fragments allow a possible real reconstruction of the destroyed fresco.
Therefore they realized hard structures reproducing spherical portions and ask for 1:1 scale reproduction of the old fresco on which they will paste the print of the fresco’s portion. On these
pictures they will fix the fragments in the correct place trying to offer to the visitors the complete view of the fresco and of the recovered parts of it.
The prints will be realized on a special paper therefore by considering the requirements fixed by the restorers, plane representations of the 3D texturized model of the fresco have to be realized.
It is well known that this problem can be solved by using the cartographic approach by selecting, among the infinite possibility of representing a double curved surface on a plane, the best one for the purposes to be reached.
The orthographic projection has been selected by considering that is one possible projection present in all the software used to manage 3D models.
4.1 Orthographic projection
The orthographic projection of spherical surfaces was used in the past by Hipparchus (2nd century B.C.) and by Vitruvius (14 B.C.) and used in the 16th century A.C. to represent the first globes. The use of this kind of projection in cartography was mainly due to its simplicity to transform geographic coordinates into plane coordinates but, if the portion of the sphere to be projected is huge, a lot of geometric distortions (both in distance, area and angle) do not allow a correct representations of the shapes of the spherical surface (Carlson, 2013; Fenna,2007; Governi, 2013).
Figure 14. Geometric interpretation of the orthographic projection of a sphere
From the mathematics of this projection it is possible to extract that the linear deformation in a specific point P’ can be expressed by means of the following relation:
(1)
where O is the point where the projection plane touch the spherical surface.
In the specific case of the problem faced in this paper the goal is to reduce this scale factor to a limit that can be neglected by considering the certain approximation of the mosaicking the fragments which are by sure different from the original size. In order to consider the depth of the plaster, a 2 cm of enlargement of the radius of the obtained sphere has been adopted and a reduced dimension of the portion of the sphere to be treated each time has been adopted.
Therefore high resolution images (1200 dpi) of the fresco have been projected on a sphere of 3.37 m of radius and one single projection will be realized for each 60 cm x 60 cm portion of the sphere’s surface. In each projection the plane is considered tangent to the sphere in the middle point of the selected area, therefore the maximum OP distance is of 0.3 m. The latitude φ results as:
(2)
and therefore the maximum linear deformation (by using the (1)) is 0.9990 that means 3 mm of reduction over a 0.3 m distance.
This systematic error of the projection has been accepted by the restorers and then used to produce all the panels needed to reproduce the portion of the fresco of interest.
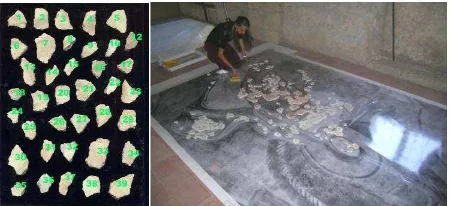
Figure 15. The catalogued fragments and the first mosaicking on enlarged photo (courtesy of ISCR and Werner Matthias
Schmid)
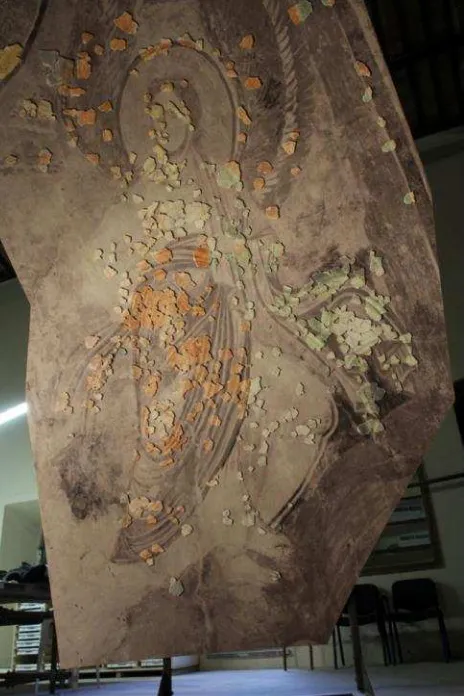
The following figures show the fragments after the classification, during the first mosaicking trials by using simple enlargement of the pictures and the 3D 1:1 scale model realized and in the future offered to the visitors to appreciate the old fresco never documented inside the church after the earthquake.
Figure 16. Result of the first mosaiking on enlarged photo and the 3D model at 1:1 scale (courtesy of ISCR and Werner
Matthias Schmid)
4.2 Test area
By following the results of previously described analysis the test was performed in a portion of the dome.
Since many fragments of the old fresco were a part of the angel in the left part of the Pantocrator Christ, this area was analyzed and processed.
First of all the part was textured with an high resolution image according to the well-known methodology(Rusinkiewicz, 2000; Vu, 2009) (Figure 17 left).
After that thecomplete angel was divided in 12 parts (Figure 17 right) with a sizeof 60 cm x 60 cm in order to limit the deformation in the boundary.
For each portion of the sphere the tangent plane equation was estimated; this procedure has been performed by using the automatic plane extraction command of 3DReshaper (Figure 18 above).Finally, for each portion, the orthographic projection was realized (Figure 18 below).
All the theoretical formulation about the orthographic projection confirms, as stated in the previous paragraph, that the results of the process could be achieved without appreciable errors for the mosaicking of the fragments, but overlapping the single orthoprojected panels some little mismatch were obviously encountered (Figure 19).
The final prints were realized using the TATTOOWALL®system. Some of the afore mentioned mismatches during the final stick on the spherical support were solved and moreover thanks to the masterly hand of the painting restorersthe final result appears totally uniform without any error in the parts where two or more areas were connected (Figure 19).
Figure 17 Texturing phase (left) and the 12 different orthoprojected parts (right).
Figure 18. Two views of the extracted planes (above) and orthoprojection of part III (below).
Figure 19. Mismatch during the first attempt ISPRS Annals of the Photogrammetry, Remote Sensing and Spatial Information Sciences, Volume II-5, 2014
5. CONCLUSIONS
The experience described in this paper cannot be considered as an ordinary application of metric survey techniques to Cultural Heritage documentation (Eppich, 2007; Yastikli, 2007; Pieraccini, 2001; Remondino, 2006; Remondino, 2011) but at the same time cannot be considered as so uncommon in Cultural Heritage restoration and management (Lensh, 2003). The solutions to this specific problem has been defined by merging traditional and update techniques and knowledge and by using primary data not always reachable for all the possible cases. Only the possibility to access historical photo archives gave the necessary primary data and only the modern solutions of LiDAR survey and automatic digital photogrammetry allow reaching, in acceptable times, the desired results. Finally a basic knowledge about theory of maps allows finding a correct and documented technique to solve the last part of the problem. But the problems encountered and solved during the described work underline also other considerations.
First of all the importance that Cultural Heritage object would be documented by saving not only 3D model and/or 2D drawings but mainly by original image possibly well documented and acquired also by taking into consideration possible photogrammetric uses. This is not an innovative idea: all the international charters on Cultural heritage mention the necessity to make a photographic documentation and CIPA-HD more than 20 years ago promoted the so called “3X3 rules” which describes how to take photos able to help in future metric uses (Waldhäusl, 1994).
Figure 20. Thecomplete final 1:1 scale 3D model of a significant part of the old dome ready to be presented to the
visitors. (Courtesy of ISCR and Werner Matthias Schmid)
Just few papers dealing with 3D modelling of Cultural Heritage by using imaging techniques (e.g. photo-modelling, digital photogrammetry, LiDAR with radiometric recording) today mention in which way the original pictures have been archived and in which way it is possible to have a copy of them. All the attention is pushed on the final results (e.g. the 3D model, the 3D print, etc.) like in the past all the attention was pushed on the drawings.
Figure 21. A part of the model where is possible to notice the perfect conformity between the little piece of the destroyed
frescos and the achieved support. (Courtesy of ISCR and Werner Matthias Schmid)
A second, but not less important, consideration is the fact that to solve a problem similar to the one described in this paper requires a complete knowledge about the metric survey techniques.
Today we are attending to the growing up of a new generation of surveyors able to realize a 3D model by using photo-modelling, automated digital photogrammetry software and LiDAR techniques.
The high level of automation of the modern instruments and software do not ask for specific knowledge about the traditional metric survey techniques, how to manage old photos and how it is possible to obtain 3D information also by using only two pictures and basic knowledge about cartography from a theoretical point of view, etc.
Those last two considerations do not have to be interpreted as a wish of coming back to the origins but as the necessity to understand the new potentialities offered by IT solutions and new instruments without forgetting the learned lessons from the past.
6. REFERENCES
References from Journals:
Chiabrando, F., Piatti, D., Rinaudo, F., 2011. Multi-scale modeling of the basilica of San Pietro in Tuscania (Italy). From 3D data to 2D representation. Geoinformatics, vol 6, ISSN: 1802-2669, pp. 300-306
Governi, L., Furferi, R., Palai, M.,Volpe, Y., 2013. 3D geometry reconstruction from orthographic views: A method based on 3D image processing and data fitting. Computers in Industry, 64(9), pp.1290-1300.
Lensch, H. P. A., Kautz, J., Goesele, M., Heidrich, W., Seidel, H.-P., 2003. Image-based reconstruction of spatial appearance and geometric detail. ACM Transaction on Graphics, 22(2), 234–257
Malan, G., Rinaudo, F., 1993. Calibrazione di immagini non metriche: esperienze e prospettive. Bollettino della Società Italiana di Topografia e Fotogrammetria, vol.4, ISSN: 0392-4424, pp. 81-105
Yastikli N., 2007. Documentation of cultural heritage using digital photogrammetry and laser scanning ,Journal of Cultural Heritage,Volume 8, Issue 4, September–December 2007, pp. 423–427
Pieraccini, M.,Guidi,G.,Attzeni, C., 2001.3D digitizing of cultural heritage.Journal of Cultural Heritage, 2 (2001), pp. 63– 70
Remondino, F., 2011. Heritage recording and 3D modeling with photogrammetry and 3D scanning. Remote Sensing, 3(6): pp 11041138.
Remondino F., ElHakim, S.,2006. Imagebased 3d modelling: a review. The Photogrammetric Record, 21(115), pp. 269-291.
References from Books:
Böhler, W., 2005. Comparison of 3D scanning and other 3D measurement techniques. In Recording, Modeling and Visualization of Cultural Heritage , E.Baltsavias, A.Gruen, L.VanGool, M.Pateraki (Eds), Taylor & Francis / Balkema, ISBN 0 415 39208 X, pp. 89-99.
Eppich, R., Chabbi, A., 2007. Recording, Documentation, and Information Management for the Conservation of Heritage Places, Volume II: Illustrated Examples, The Getty Photogrammetry pp. 300-339. Taylor & Francis
Salma, C. C., 1980.Manual of Photogrammetry, 4th ed., American Society of Photogrammetry, Falls Church, Virginia
References from Other Literature:
Bae, K.H., Lichti, D.D.,2004. Automated registration of unorganised point clouds from terrestrial laser scanners. In Proceedings of the 20 th ISPRS Congress,Istanbul, pp. 222– 227.
Bonora, V., Tucci, G., Vaccaro, V., 2005.3D data fusion and multi-resolution approachfor a new survey aimed to a complete model of Rucellai Chapel by Leon Battista Alberti in Florence, Proceedings of CIPA International Symposium, Torino. Carlson, K. L., 2013. U.S. Patent No. 8,358,317. Washington, DC: U.S. Patent and Trademark Office.
Del Pizzo, S., Troisi, S. Automatic orientation of image sequences in Cultural Heritage. Int. Archives of Photogrammetry, Remote Sensing and Spatial Information Sciences , 2011, 38(5/W16), on CD-ROM. ISPRS Int. Workshop 3D-ARCH 2011, Trento, Italy.
El-Hakim, S., Beraldin, J.-A., Remondino, F., Picard, M., Cournoyer, L., Baltsavias, M., 2008. Using terrestrial laser scanning and digital images for the 3D modelling of the
Erechteion, Acropolis of Athens. Proc. of "Digital Media and its Applications in Cultural Heritage" (DMACH) Conference, Amman, pp. 3-16.
El-Hakim, S.F., et al, 2003.Visualization of highly texturedsurfaces, Proc. VAST 2003, Brighton, UK, Nov., pp. 231-240
Kalisperakis, I., Rova, M., Petsa, E. Karras, G.E., 2003. On multi-image reconstruction from historic photographs. The International Archives of the Photogrammetry, Remote Sensing, and Spatial Information Sciences. Antalya, Turkey, Vol. XXXIV-5/C15, ISSN 1682-1750, pp. 216-219
Karras, G. E., Patias, P., Petsa, E., Ketipis, K., 1997. Raster projection and development of curved surfaces. International Archives of Photogrammetry and Remote Sensing, Göteborg, Sweden, Vol. XXXII-5C1B, ISSN 1682-1750, pp. 179-185.
Lerma, J.L., Garcia, A., Pérez, C., 2005. 3D reconstruction and modelling of architectural domes. The International Archives of the Photogrammetry, Remote Sensing, and Spatial Information Sciences. Turin, Italy. Vol. XXXVI-5/C34, ISSN 1682-1750, pp. 216-219
Lo Turco , M., Sanna, M., 2009. Digital modelling for architectural reconstruction. The case study of the ChiesaConfraternitadellaMisericordia in Turin. Proceedings of CIPA 2009, Kyoto, pp.101-106.
Waldhäusl, P., Ogleby, C., 1994. 3x3-Rules for Simple Photogrammetric Documentation of Architecture. International Archives of Photogrammetry and Remote Sensing, Volume XXX, Part 5, Melbourne, Australia, ISSN 1682-1750. pp. 426-429. Rusinkiewicz, S.,Levoy, M.,2000.QSplat. A multiplesolution point rendering system for large meshes, in Proc. 27th annual conference on computer graphics and interactive techniques, pp. 343-352.
Schutz, C.,Jost, T., Hugli, H.,2002.. Multi-featurematching algorithm for free-form 3D surface registration. InProceedings of the 14th International Conference on Pattern Recognition, volume 2, pp982–984.
Sharp, G., Lee, S. and D.K., W., 2002. ICP registration usinginvariant features. IEEE Transactions on Pattern Analysis and Machine Intelligence 24(1), pp. 90–102
Vu, H.H., Keriven, R., Labatut, P., Pons, J.P. Towards highresolution large-scale multi-view stereo. Proc. Computer Vision & Pattern Recognition, 2009, Kyoto, Japan
References from Websites:
http://www.tattoowall.it/digitalmurals/home.asp (06 March 2014)
7. AKNOWLEDGEMENTS
ISCR (High Institute for Conservation and Restoration – Italy), Dr. Werner Matthias Schmid (Rome – Italy), The Getty Research Institute (Los Angeles – USA), Hirmer photographic Archive (Munich – Germany).