(B.Sirmacek, R.C.Lindenbergh)@tudelft.nl
Commission III, WG III/2
KEY WORDS: Mobile mapping, big data, classification, trees, cloud computing, web-based visualization
ABSTRACT:
Current 3D data capturing as implemented on for example airborne or mobile laser scanning systems is able to efficiently sample the surface of a city by billions of unselective points during one working day. What is still difficult is to extract and visualize meaningful information hidden in these point clouds with the same efficiency. This is where the FP7 IQmulus project enters the scene. IQmulus is an interactive facility for processing and visualizing big spatial data. In this study the potential of IQmulus is demonstrated on a laser mobile mapping point cloud of 1 billion points sampling∼10 km of street environment in Toulouse, France. After the data is uploaded to the IQmulus Hadoop Distributed File System, a workflow is defined by the user consisting of retiling the data followed by a PCA driven local dimensionality analysis, which runs efficiently on the IQmulus cloud facility using a Spark implementation. Points scattering in 3 directions are clustered in the tree class, and are separated next into individual trees. Five hours of processing at the 12 node computing cluster results in the automatic identification of 4000+ urban trees. Visualization of the results in the IQmulus fat client helps users to appreciate the results, and developers to identify remaining flaws in the processing workflow.
1. INTRODUCTION
Urban management has many geospatial and geometric aspects. Every street contains different street furniture like lamp posts and street signs, while many streets are flanked by trees that occur in a variety of sizes and shapes. Collecting information on the state of street furniture and street trees can be very time consuming and therefore costly. In recent years however it has been demonstrated that mobile mapping systems equipped with cameras and laser scanners are able to densely sample the geometry of the street surroundings. Indeed, resulting point or pixel densities are in the order of millimetre to centimetre. This high sampling density causes a new problem: how to efficiently and accurately extract information at centimetre level from dense point clouds covering tens of kilometres of urban street surroundings?
The IQmulus project is a FP7 project with the aim of creating a high-volume fusion and analysis platform for geospatial point clouds, coverages and volumetric data sets. In this work we will report on how the IQmulus platform can be used to efficiently process a mobile mapping point cloud of 83 GB sampling∼10 km of streets in the city of Toulouse. It will be demonstrated how the point cloud data is stored, processed and visualized. The goal of the processing is to extract and visualize the location of all individual trees as sampled by the point cloud.
To obtain this goal the following steps are followed. The input *.ply data from the mobile mapping system is tiled and stored as a collection in a Hadoop Distributed File System (HDFS). Next, a workflow is defined in a workflow editor that creates a pro-cessing chain of several consecutive algorithms with appropriate
∗Corresponding author
parameters. Key algorithms are developed that can profit opti-mally from the available cloud infrastructure, for example using parallel Spark implementations. The computational performance of the algorithms is automatically evaluated using a scalability testing framework. The results of the processing chain, including quality parameters and intermediate outcomes are stored again on the HDFS to make them available to the visualization processing. To be able to efficiently visualize the point cloud in a stream-ing fashion the data is processed into a suitable structure. This structure is used to interactively access the point cloud to provide a view-dependent level of detail to a WebGL based point cloud renderer running in a standard web-browser.
Several alternative workflows are still being compared in terms of computational performance and quality, but one main work-flow processes the point cloud data as follows: so-called dimen-sionality features are determined for each point that expresses its amount of linearity, planarity or scattering. In either a simple rule based or a more sophisticated random forest classification, basically points with high scattering are collected in a tree class. Next, tree points may separated into individual trees by analysing local point density variations. The final result is again a point cloud, but with an extra label for each point indicating whether it belongs to a tree, and if so, to what tree. At the current state of affairs, the point cloud of∼10 km, consisting of 1500 mil-lion points is processed in 5 hours using 12 nodes at the IQmulus infrastructure.
2. METHODS
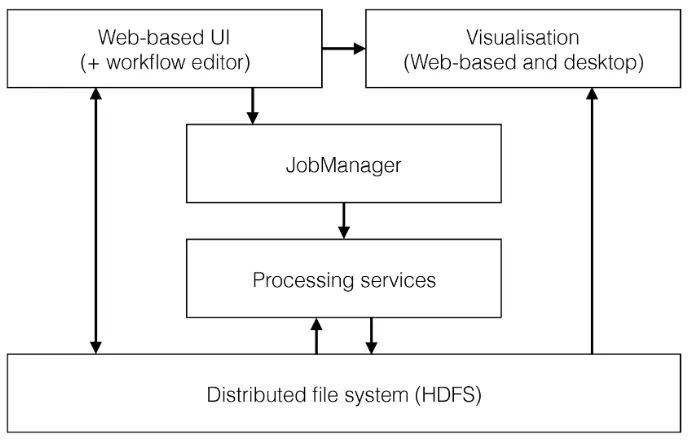
infras-Figure 1. IQmulus architecture
tructure is discussed, next, different algorithms and their efficient implementations to extract information from points clouds, fol-lowed by a explanation of the visualization methodology.
2.1 The IQmulus infrastructure
IQmulus is a research project funded by the European Commis-sion running from November 2012 to October 2016. Within this project we have developed a software architecture for the pro-cessing of very large geospatial data. Figure 1 shows the main components of the IQmulus architecture.
The users (typically GIS experts) use the web-based user inter-face to upload data to the distributed file system (HDFS). They define a workflow using a Domain-Specific Language (DSL). The workflow for the use case presented in this paper is described be-low. When the users press the Execute button the workflow is transferred to the JobManager, a component managing the infras-tructure and the execution of workflows. The JobManager selects the compute nodes in the Cloud on which the workflow should be executed. It then spawns the processing services on these com-pute nodes and oversees their execution. The JobManager can manage complex workflows in which processing services depend on the results from others. It employs a sophisticated rule-based scheduling algorithm to control the execution, (Kr¨amer and Sen-ner, 2015).
The processing services load the data previously imported by the users from the distributed file system, process it, and then save the results back to the HDFS. Finally the users can view the results in the web-based visualisation client or a desktop client. The following sections focus on the processing services used in this use case.
2.2 Dimensionality features
The first step in the pipeline is to perform a local dimensionality analysis of the point cloud which performs a scale-adaptive Prin-cipal Component Analysis (PCA) on the point cloud in order to extract the most relevant radius of analysis for each point. From the PCA, a number of dimensionality features may be derived such as linearity, planarity, scattering, omnivariance, anisotropy, eigenentropy and change of curvature, (Demantke et al., 2011).
This step is embarrassingly parallel, as the new features of each input point may be computed independently. However, the data access pattern of these computations is overlapping, as the com-putation of each point needs to read the positions of its K nearest neighbors for some content-adaptive value K.
The alternatives for distributing these computations are to either (i) introduce an approximation by processing the input lidar tiles independently, thus possibly introducing edge effects, or (ii) en-suring that while independently processing each tile, its neigh-boring tiles are also accessible on the same machine. For sim-plicity, or if tile adjacencies are not available, tiles may be pro-cessed independently as the scale-adaptive property of (Deman-tke et al., 2011) has the nice tendency of reducing the optimized scale of analysis so that it is fully contained in the current tile, thus minimizing the edge effects. Alternatively, if tile adjacen-cies are known, or if the dataset is re-partitioned into tiles (e.g. grid tiling), then it is easy to list the few number of tiles that may be read while computing the dimensionality features of a given tile.
The proposed method when the dataset is sorted in sequential acquisition order (either because it has not been shuffled by a preprocess or because per-point acquisition timestamps are avail-able) is to simply process each tile with a read access to the immediately preceding and succeeding tiles. This has the com-bined advantage of (i) not requiring any retiling or shuffling as raw datasets are actually acquired and stored in time-sequential chunks rather than spatial partitions and (ii) that the processing is then almost insensitive to georeferencing issues, as georeferenc-ing typically drifts in a way such that relative positiongeoreferenc-ing errors are negligible within the short timespan of a few consecutive tiles. This last property is actually very important as the PCA is very sensitive to slight misalignments of lidar point clouds due for in-stance to repeated scans of the same street.
2.3 Tree classification
Figure 2. Spark processing steps
performed independently on each point, adding a boolean tree attribute.
Point classification using Spark Apache Spark has been the most popular cluster computing framework attracting lots of at-tention from both the industry and academia, (Apache Spark, 2016). Besides the nature of scalability, Spark also supports fault tolerance and in-memory computing which significantly enhances its performance. This method addresses the point classification problem in a big data context. Apache Spark is employed to fulfill the parallelization of our method in the cloud. As the primary ab-straction in Apache Spark, the resilient distributed dataset (RDD) plays a key role to organize data and achieve parallel computa-tion. Our implementation can be summarized as a series of ma-nipulations of RDDs including creating new RDDs, transforming existing RDDs, and performing operations on RDDs to generate results as shown in Figure 2.
The input data is a point cloud with seven attributes, linearity, planarity, scattering, omnivariance, anisotropy, eigenentropy, and change of curvature, (Demantke et al., 2011). The output is point cloud data where each point got a class Id, indicating whether it is classified as belonging to the class ‘tree‘ or the class ‘non-tree‘.
The first RDD, RDD 1, is initialized from a list of file name strings through the operationparallelize. RDD 1 is parti-tioned and is distributed over cluster nodes. Point cloud data is loaded as RDD 2 by applyingflatmapon RDD 1. RDD 2 can be regarded as a list of point elements and each element is a 3D vector representing the point coordinate. Features for learning are computed from RDD 2 and saved as RDD 3, and then pre-dicted results are generated by applying a pre-trained model on RDD 3. The classification results are outputted to the file system by performinggroupByKeyandforeachon RDD 5 which is a combination of RDD2 and RDD4. Details are described in (Liu and B¨ohm, 2015).
termediate step towards individual tree parameter estimation like diameter at breast height (DBH), compare e.g. (Lindenbergh et al., 2015).
Tree separation based on local 2D point densities. The first algorithm for tree individualization implemented in IQmulus starts by generating a 2D raster covering the tile considered. For each 2D raster cell the number of 3D points are counted whose xy locations belong to it. The resulting raster is expected to show high values on the tree trunk locations, that is, tree trunk loca-tions are expected to correspond to local maxima that are simply extracted by a moving window. Next, the original 3D tree points are assigned to that tree trunk that is on minimal horizontal dis-tance. To avoid false commissions from for example isolated tree like points from small vegetation on balconies the 3D distances between points assigned to one tree are checked for outlying val-ues.
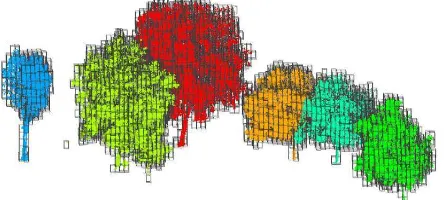
The revised version of the algorithm considers the 3D locations of the points. The algorithm clusters 3D points by applying an newly designed unsupervised classification method that considers the 3D Euclidean distance from a point to its closest neighbors. The new algorithm is computationally more expensive, however it allocates less memory than the 2D raster approach. The lat-ter approach suffered from crashes when the allocated raslat-ter ap-peared too big. After the individual trees are separated by this clustering approach, a bounding box is used to identify the tree points which might be mislabeled as non-tree earlier, because their dimensionality value of e.g. planarity was bigger than scat-ter. Examples of such points can be found on tree trunks. Finally, the location of the highest point of the tree points in a bound-ing box correspondbound-ing to one tree is taken to determine the tree xy-location. Some results are shown in Figure 3.
Tree separation using the VoxTree algorithm. The VoxTree algorithm is an alternative way of separating clusters of tree points into individual trees. As a starting point, the bounding box of a given data tile is subdivided into voxels of a preset size, of, say, 15 cm. Only voxels containing tree points are considered next. Processing a limited number of voxels rather than a huge number of individual points is yet another strategy to speed up process-ing. First, tree voxels are clustered and voxels standing out at the top of a cluster are initiated as seed voxels. If more than one sufficiently prominent seed voxel is found in a cluster, each seed is used to grow a tree by traversing the different horizontal voxel layers in the cluster and deciding for each voxel to which tree it should belong according to a local adjacency analysis.
Figure 3. Left: input point cloud. Middle: points whose scatter surpasses their linearity and planarity; Right: individual tree separation results.
individualization was considered successful by the algorithm. A result of the processing of a small part of the Toulouse data is shown in Figure 4. At the time of this writing, the full description of this method is under review.
2.5 Interactive visualization
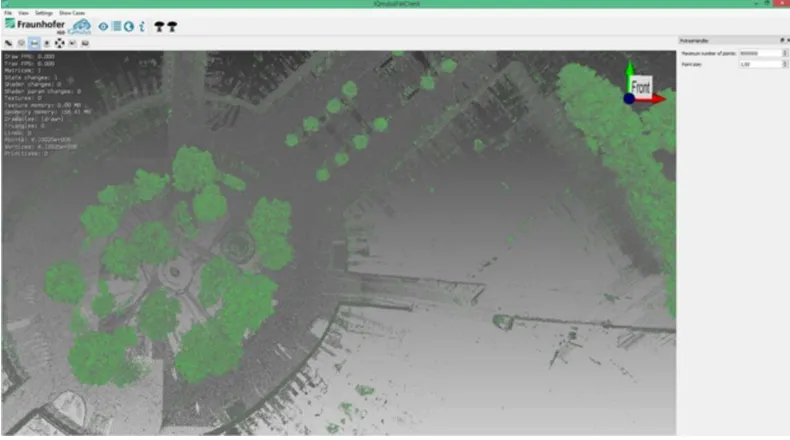
Large point clouds like the processed results of the presented workflow may be visualized interactively using one of two visual-ization clients connected to the IQmulus infrastructure: the Thin Client, which utilizes modern web-based technologies to display processing results directly in a web browser, or the Fat Client, which is a desktop application exploiting OpenGL for rendering with access to the latest features of current graphics hardware. However, visualizing large point data interactively is difficult due to limited client-side resources (CPU memory, graphics / GPU memory, harddisk space, and local compute power). Therefore the visualization clients require additional information on, and preprocessing of, the raw data sets in order to be able to effi-ciently identify the visible subset of the data as well as retrieving the data at different precisions (levels of detail) to provide high information resolution near the current viewing position and pos-sibly decreased resolution in more distant areas.
Data preparation for visualization Both visualization clients use a similar approach to data preparation of point clouds. They utilize and additive octree which is generated from the raw data set by utilizing the Potree converter, (Schuetz, 2014). This con-verter has been extended to support the point cloud attributes re-quired by the workflow. The conversion itself is wrapped into a post-processing service running on the IQmulus infrastructure and the output data is stored in the HDFS. The data access to the post-processed data is different for the Thin and Fat Client and outlined below.
Figure 4. tree separation by the VoxTree algorithm (Image: Jinhu Wang)
Data access of the Thin Client The entry point for the Thin Client visualization is a JSON file available through the HTML-based IQmulus Data Access Service. The request is routed to the webVis/instant3Dhub platform, (Behr et al., 2015), which uses out-of-core rendering, making it possible to visualize very large data-sets. The web client sets appropriate memory limits both on CPU and GPU, and streams data from the server as necessary to generate an image from a given viewpoint. If the amount of data surpasses the available memory, it will iteratively refine the ren-dered image. In such cases, the web application is still responsive at all times. The user may move around the data set, in which case the available data is rendered and the refinement will restart when the navigation stops. The webVis framework provides a solution for embedding 3D visualization of structured data in web applica-tions with minimal effort. Based on JavaScript, it runs on modern web browsers without the need for external plug-ins. The webVis API offers all the functionality needed for accessing, visualizing and manipulating data originating from the instant3Dhub infras-tructure.
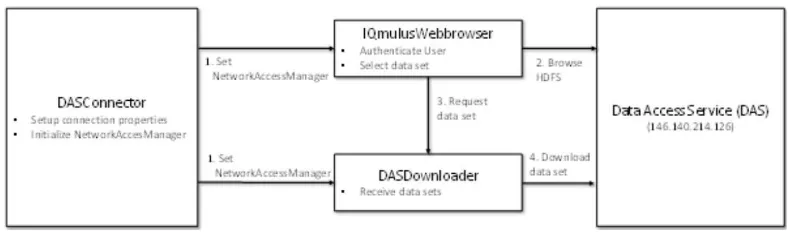
Data access of the Fat Client In order to access the data pro-vided by the processing services of the IQmulus infrastructure, we developed a data access module for the IQmulus Fat Client. The module utilizes Qt 5 for user authentication and data access via the web-based interface to the HDFS of the IQmulus infras-tructure. More specifically, we developed a connection manager to establish secure communication with the IQmulus Data Ac-cess Service (DAS) and adapted the Webkit-based HTML engine provided by Qt (QWebView) to download and visualize data sets from the HDFS. The main components involved in HDFS data access in the IQmulus Fat Client are shown in Figure 5.
In the following we provide a short overview of the functionality of the components of the data access module:
IQmulusWebbrowser The IQmulusWebbrowser is an exten-sion of the HTML engine provided by Qt (QWebView). It is the front end the user utilizes to submit authentication information to the IQmulus Data Access Service, browse the HDFS and initiate the download and visualization of a data set.
3. RESULTS
3.1 Data description
The workflow has been applied to a 10km-long mobile mapping dataset acquired by IGN’s stereopolis vehicle, (Paparoditis et al., 2021) acquired within an hour of operation in downtown Toulouse, France using a multi-return Riegl VQ-250 lidar scanner. Once georeferenced with all attributes this lidar dataset is constituted of 1 012 160 278 lidar points and 83GB.
Figure 9. The workflow editor in the IQmulus main user interface can be used to edit processing workflows in a Domain-Specific Language (DSL)
3.2 The workflow in the IQmulus user interface
In the main user interface developed in the IQmulus project users can edit processing workflows using a Domain-Specific Language (DSL). A DSL is a lean programming language that is targeted to a specific application domain or use case. We have developed a method to specify the grammar and syntax of such a DSL so that it is readable and understandable by domain experts. The method encompasses a domain analysis step to make sure the DSL uses the vocabulary and terminology known to the domain experts, cf. (Kr¨amer, 2014). Figure 9 shows a screenshot of the workflow ed-itor from the IQmulus main user interface. The screenshot shows the DSL script for the workflow described in this paper.
3.3 Results, tree extraction
A main result of the processing of the workflow is shown in Fig-ure 7. The figFig-ure shows over 4000 tree locations identified around the trajectory of the Stereopolis mapping system. Although this figure gives a good overview of the challenge addressed by the use case, it doesn’t allow the user to assess the final correctness of the assignment of one of the billion points to an individual tree. For this purpose the IQmulus visualization is used.
3.4 Visualization results.
For the purpose of visualization of the resulting data set using the Fat Client, we developed a category viewer which performs a distinct color mapping of the points of different trees. Trees may be highlighted based on their ID and colors as well as point rendering parameters may be manually specified (see Figure 10).
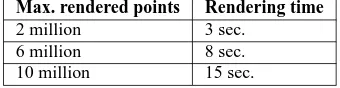
The visualization of the Toulouse data set allows for interactive navigation through the data. Due to the incremental refinement of the visualization (asynchronous download of additional data and subsequent rendering using an adjustable maximum number of rendered points) and the different constraints imposed by client-side hardware as well as network connection properties, it is hard to come up with general performance data. The performance of rendering the Toulouse data set using the Fat Client from local harddisk with different upper boundaries for rendered points is shown in Table 1. The test machine was a medium range desktop PC (Intel Core i5-6400 CPU @ 2.70 GHz, 8 GB Ram, Geforce GTX 960).
Figure 6 shows two example views on the data set for 2 million points used for rendering (left) and 5 million points (right). The color coding visualizes the scattering attribute of the points. The asynchronous refinement procedure is illustrated in Figure 8. The right side of the image already shows a higher point density since the required octree cells were already loaded, while additional detail for the left side of the image is asynchronously fetched and not yet available for rendering.
Figure 6. Toulouse trees visualized using a rendering budget of 2 million points (left) and 5 million points (right).
Figure 7. 4000+ tree locations automatically identified by the IQmulus US2 workflow overlaid as KML layer on Google Earth imagery of Toulouse.
At the current state of affairs, the full use case is implemented and running in the IQmulus infrastructure. A next step is to actu-ally exploit the IQmulus visualization possibilities to analyze the geometric quality of the results in an interactive way. Simultane-ously the computational performance of the workflow as a whole for different settings is under study using the implemented auto-mated scalability testing framework. To verify the portability of the platform, the use case will also be evaluated on different mo-bile mapping data sets obtained by different systems in different road environments.
4. CONCLUSIONS
In this paper we have presented results from the FP7 IQmulus project. The general infrastructure for storing, processing and vi-sualizing big spatial data has been described and demonstrated on the so-called urban showcase. This showcase considers the efficient processing of a huge lidar mobile mapping data set con-sisting of 1 billion points sampling 10 km of urban streets in Toulouse. IQmulus is able to efficiently extract and visualize all points sampling the 4000+ individual trees sampled by the point cloud. More information on and results from the IQmulus project can be found on the IQmulus website, http://www.iqmulus.eu.
ACKNOWLEDGMENTS
This paper reports on results of the FP7 project IQmulus, A high
volume fusion and analysis platform for geospatial point clouds, coverages and volumetric data set enabled by the FP7 grant with
number FP7-ICT-2011-318787.
Kr¨amer, M., (2014). Controlling the processing of smart city data in the cloud with domain-specific languages. In Proceedings of the 2014 IEEE/ACM 7th International Conference on Utility and Cloud Computing (pp. 824–829).
Kr¨amer, M. and Senner, I., (2015). A modular software architec-ture for processing of big geospatial data in the cloud. Computers & Graphics, 49, pp.69–81.
Lindenbergh, R.C., Berthold, D., Sirmacek, B., Herrero-Huerta, M., Wang, J. and Ebersbach, D., (2015). Automated large scale parameter extraction of road-side trees sampled by a laser mobile mapping system. The International Archives of Photogrammetry, Remote Sensing and Spatial Information Sciences, 40(3), p.589.
Liu, K. and B¨ohm, J., (2015). Classification of Big Point Cloud Data Using Cloud Computing. The International Archives of Photogrammetry, Remote Sensing and Spatial Information Sci-ences, 40(3), p.553.
Paparoditis, N., Papelard, J.P., Cannelle, B., Devaux, A., Soheil-ian, B., David, N. and Houzay, E., (2012). Stereopolis II: A multi-purpose and multi-sensor 3D mobile mapping system for street visualisation and 3D metrology. Revue franc¸aise de pho-togramm´etrie et de t´el´ed´etection, 200(1), pp.69–79.
Sch¨utz, (2014), Potree. http://potree.org, accessed 2016-04-13