ESTIMATING THE ATMOSPHERIC PHASE DELAY FOR QUANTIFYING
CO-SEISMIC DEFORMATION USING REPEAT PASS DIFFERENTIAL SAR
INTERFEROMETRY: OBSERVATIONS FROM 20
thAPRIL 2013 LUSHAN (CHINA)
EARTHQUAKE
John Mathew*,1 Ritwik Majumdar, K. Vinod Kumar
National Remote Sensing Centre, Indian Space Research Organization (ISRO), Balanagar, Hyderabad, India. PIN 500037 - (john_mathew, ritwik_m, vinodkumar_k)@nrsc.gov.in
KEY WORDS: Differential SAR Interferometry, Co-seismic deformation, Atmospheric Phase Delay
ABSTRACT:
Atmospheric phase contribution significantly influences co-seismic surface deformation estimates from repeat pass Differential Synthetic Aperture Radar Interferometry (DInSAR). Present study investigates the contribution of the atmosphere in co-seismic deformation estimation associated with the 20th April 2013 Lushan (China) earthquake. The Lushan Earthquake occurred in the south-western segment of the Longmenshan fault zone, on the eastern margin of the Qinghai-Tibetan Plateau. Using pre- and post-earthquake Radarsat-2 interferometric pair, the co-seismic deformation of the Lushan post-earthquake has been estimated. The tropospheric phase delay component has been estimated using tropospheric models in conjunction with surface temperature and pressure data from MODIS atmospheric products. The ionospheric phase component has been computed using the Total Electron Content (TEC) data. The net atmospheric path addition in the study area varies from 3.022 m to 4.621 m for the pre-earthquake SAR acquisition and from 2.687 m to 4.199 m for the post-event data acquisition. Comparison of the Line of Sight (LOS) displacement values computed using un-corrected and corrected interferometric data shows that the atmospheric phase component has introduced considerable contribution in the LOS displacement values. The uncorrected LOS displacement values vary from 0.902 m to -0.157 m where as those from the phase-corrected interferometric data are in the range of 0.052 m and -0.062 m. The corrected LOS displacement values show close agreement to a few GPS based co-seismic surface deformation components from published literature. Thus removal of atmospheric phase contribution is a necessary step in using repeat pass DInSAR for co-seismic surface deformation estimation.
* Corresponding author
1. INTRODUCTION
Differential SAR interferometry is one of the cost effective techniques in quantifying surface deformations associated with various tectonic or anthropogenic processes. Interferograms generated using SAR acquisitions that temporally spread across the deformation events reveal the phase changes brought by these events. By synthesising the phase component contribution of the topography from surface elevation data, the phase contribution of the of the topography can be quantified and subtracted from the composite phase to derive the phase change contribution of inter-acquisition deformation.
There are also extraneous factors that often bring about phase changes amongst multiple SAR acquisitions. These are variations of atmospheric conditions, coherence variations associated with temporal variations of the targets and de-correlation caused by baseline changes. In case of atmospherically induced phase discrepancies which are un-related to the surface changes, it is very likely that the quantified surface deformations have undesirable contributions from these atmospheric interactions. The troposphere and the ionosphere are the two segments that cause significant path errors in repeat pass DInSAR based measurements. The troposphere causes propagation delay for the SAR signals. The state of the atmosphere in terms of the pressure, temperature and water vapour, which influence the refractive index of the medium are the prime factors in determining the tropospheric path delay (Ding, 2008). The ionosphere causes propagation
advancement of the signals and depends on the total electron content (TEC) in the ionosphere. In both the cases, the path delay is influenced by the wavelength of the signals also.
The present study evaluates the influence of atmosphere (troposphere and ionosphere) in introducing path delay during SAR acquisitions and thereby causing additional component in the co-seismic displacement values estimated using repeat pass DInSAR technique.
1.1 Previous work
Researchers had long been working on the problem of range correction for radio waves transmitted through atmosphere. Saastamoinen (1972) formulated the range correction for radio waves through atmosphere based on the refractivity of the atmosphere and related it with the atmospheric pressure, temperature and partial pressure of water vapour. Using the refractivity of air (Smith and Weintraub, 1953, Thayer, 1974) and appropriate mapping function, the wet (due to water vapour) and dry (due to gases except water vapour), have been combined in empirical models by researchers to account for the tropospheric delay. For example Ifadis (1986) and Niell (1996) defined mapping functions for the tropospheric delay models to derive the wet and dry tropospheric delay components. The mapping functions were defined using variables which are related to the surface temperature, pressure and latitude.
One of the early works which considered atmospheric effects on repeat pass DInSAR studies was done by Goldstein (1995) who observed path delay in repeat pass interferograms generated for Mojave desert. Massonnet and Fiegl (1995) demonstrated pair-wise comparison of interferograms to understand the errors in the interferograms caused by atmospheric effects while studying the Landers Earthquake using ERS-1 interferometric images. Zebker et al. (1997) observed that the errors in ground deformation estimation due to the influence of atmosphere, based on C band DInSAR, are to the order of 10 to 14 cm for about 20% change in relative humidity. Hanssen and Feijt (1996) used Saastamoinen's tropospheric model for estimating the range change. Tarayre and Massonnet (1994) modelled the tropospheric and ionospheric components of errors introduced during the wave propagation through these media. Danklmayer et al. (2009) identified the ionospheric and tropospheric effects in Terrasar-X images. Delacourt et al. (1998) integrated ground meteorological data along with models for their vertical gradients and tropospheric delay models for correcting interferograms. Tropospheric delays from GPS observations could also be used for calibrating and correcting atmospheric effects in InSAR measurements (Bonforte et al., 2001; Li et al., 2006; Williams et al., 1998; Onn and Zebker, 2006 etc.). Most of the times, due to the sparse distribution of available GPS network for the areas of study, interpolation techniques had to be used (Janssen et al., 2004) for correcting the atmospheric effects using GPS derived delay measurements.
Interferometric tropospheric delays are also corrected using the estimated delays from Global Atmospheric Models (GAM) which provide temporal; spatial, vertical distribution of temperature, pressure and partial pressure of water vapour. Doin (2009) quantitatively compared the empirical corrections and global atmospheric model based output. Jolivet et al. (2011) developed systematic correction tool using global atmospheric models. Jolivet et al (2014) compared three global atmospheric models for tropospheric corrections. The accuracy of the corrections again depends on the atmospheric model used to generate the meteorological data profiles.
The water vapour product from Moderate Resolution Imaging Spectroradiometer (MODIS) onboard Terra/Aqua satellites has also been used for InSAR atmospheric error correction (Li et al., 2003; 2005). Precipitable water vapour from Medium Resolution Imaging Spectrometer (MERIS), a passive spectrometer onboard the ENVISAT satellite could also be used for atmospheric delay calculation (Li et al., 2006a; 2006b; Li et al., 2012). Correction of atmospheric effects using the temperature and pressure products from MODIS data also had been proposed by researchers (Balaji, 2013; Kamarajugedda, 2013). The present study uses the approach adopted by Balaji (2013) and Kamarajugedda (2013).
1.2 Study area and Data used
The present study focuses on the co-seismic deformation caused by the Lushan earthquake of 20th April 2013. Lushan Earthquake occurred in the Longmenshan fault zone on the eastern margin of the Qinghai-Tibetan Plateau and is an intra-plate seismic zone of about 500 km long and 50 km wide. The epicentre of the 20th April earthquake was in the SW end of this fault zone, close to the Shuangshi-Dachuan thrust (Mathew et al., 2015). The ongoing deformation across this fault zone had been revealed by GPS records to be about 3 to 7 mm/year (Hubbard and Shaw, 2009; Wang et al., 2002). The topography varies from the gently undulating Sichuan basin with moderate
relief and elevation (about 500m) on the east of the Longmenshan fault zone to very rugged Longmenshan mountain ranges with average elevation of about 6000m on the west of the fault zone.
The interferometric data used in the study comprised of a pair of RADARSAT-2 ascending mode scenes of 10th January and 10th May, 2013, in wide-swath, VV polarization. The incidence angle varies from about 19 degrees (near-range) to 30 degrees (far-range). The perpendicular baseline for this interferometric pair is 183.85 m, whereas the temporal separation is 120 days which includes the seismic event of 20th April 2013. The January 2013 data was the closest pre-event scene available. The digital elevation model (DEM) data from Shuttle Radar Topography Mission (SRTM, Version 4.3, 3 arc-second resolution) was used as input for topography.
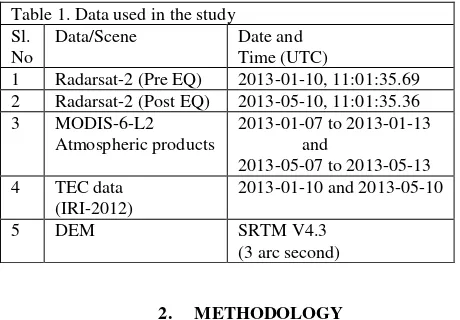
Atmospheric products from MODIS data available at http://modis-atmos.gsfc.nasa.gov/MOD06_L2/acquiring.html have been used as source of the temperature and pressure data for the study area, in order to derive the tropospherically induced path length of the radar signal during the pre- and post-earthquake SAR acquisitions and to calculate the phase delay associated with these additional path lengths. The Total Electron Content data from International Reference Ionosphere 2012 model have been used for assessing the influence of ionosphere in the DInSAR results. The data used in the study are listed in table 1.
Table 1. Data used in the study Sl.
No
Data/Scene Date and Time (UTC)
1 Radarsat-2 (Pre EQ) 2013-01-10, 11:01:35.69 2 Radarsat-2 (Post EQ) 2013-05-10, 11:01:35.36 3 MODIS-6-L2 an external DEM. The sequence involved co-registration, interferogram generation, flattening, filtering, coherence estimation, topographic and atmospheric phase component removal, phase unwrapping and phase to displacement conversion.
The troposphere induced path addition has been estimated using the model proposed by Askne and Nordius (Askne and Nordius, 1987). This model uses refractivity of air as the basic cause of path addition during the wave propagation through troposphere. Thayer (1974) represented refractivity of air in terms of temperature, partial pressure of water vapour and that of dry air, with the help of empirical constants. The troposphere introduced delay consists of a hydrostatic term (dry delay, which depends on the surface pressure) and a wet delay which depends on the partial pressure of water vapour. The wet delay depends on the humidity and temperature profiles. Using the temperature lapse rates and water vapour decrement, Askne and
Nordius (1987) proposed the expression for the net, 2-way tropospheric path addition as:
The values of for the study area latitude and for the data season has been extracted based on Smith (1966) as 3.6 for January and 2.98 for May; the pre- and post-event data months. The temperature lapse rate for the study area latitude is based on the values used by Collins et al. (1996). Buck (1981) related the surface temperature with the partial pressure of water vapour as:
In equation 1, the first term denotes the hydrostatic delay and the second term represents the wet delay. The vertical path addition has been converted that along the range using the off-nadir angle of imaging.
The second aspect is the path reduction (phase advancement) introduced by the ionosphere. This is estimated as:
3. ANALYSIS AND RESULTS
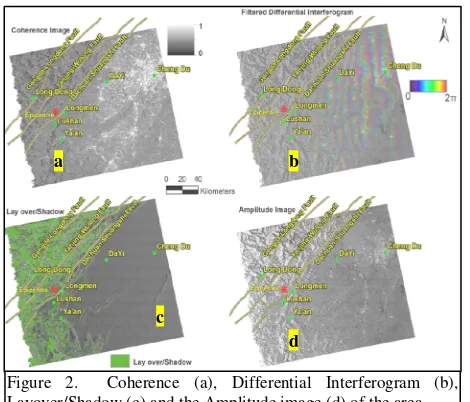
The processing was carried out in SARSCAPE v5.0 module within ENVI. The interferogram was generated from the co-registered (sub-pixel level) data pair and the flat earth's contribution had been subtracted from it. Filtering reduces the phase noise and improves signal to noise ratio and hence filtering was applied on the flattened interferogram. In order to assess the reliability of phase measurements, the complex correlation coefficient (coherence) between the interferometric pair was estimated. Receiver noise, variation of scatterers’ response and longer geometric baseline etc. reduce the coherence. Due to the non-availability of an interferogram from SAR data of short temporal spacing, excluding the seismic event, external DEM (SRTM V.4.3, 3-arc-second) was used to remove the topographic phase so that the residual phase is due to the co-seismic deformation. The amplitude image, filtered differential interferogram, coherence image, lay-over/shadow images are shown in figure 2.
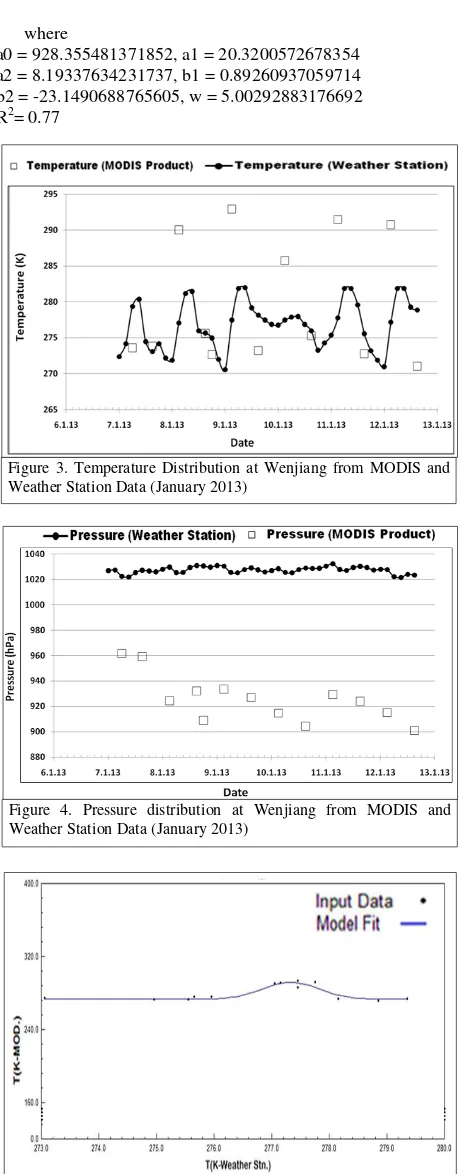
In order to estimate the tropospheric effects on radar propagation, the path addition that affected pre- and post-event acquisitions have been computed separately. These are again modified by incorporating the effects of ionosphere. Thus the net troposphere-ionosphere effects have been computed separately for both the acquisitions and then the difference has been calculated as the resultant path change in the interferometric pair. The path change has then converted to corresponding phase change using the wavelength of the SAR sensor. The input needed for the tropospheric path delay model are the surface temperature and pressure. MODIS atmospheric products did not cover the time of acquisitions of the pre- and post-earthquake SAR acquisitions. As proposed by Kamarajugedda (2013), the indirect way is to build up a relation between the P/T values from MODIS products and data from ground meteoritic station so that the relation can be used to calibrate the MODIS P/T product for the time the SAR data had been acquired. For the pre-earthquake SAR data acquisition of 10th January 2013, available MODIS Atmospheric Product's data from 7th January to 12th January 2013 and ground meteorological data (3 Hourly) of Wenjiang station (30.75N, 103.866E, west of Chengdu) available from National Climatic Data Centre (NCDC) have been downloaded. The ground based temperature and pressure data corresponding to the acquisition period of the MODIS Atmospheric products (13 data for the period from 7th-12th January 2013) have been extracted (figure 3 and 4) and subjected to regression to derive the relation between both the observations. The temperature data from MODIS and weather station showed best fit (figure 5) for a Gaussian Model as given below:
y= a1*exp(-((x-b1)/c1)^2) + a2*exp(-((x-
b2)/c2)^2 --- (4) where
a1 = 3708121624.05149, a2 = 18.5696442186331 b1 = -2205955.5868450, b2 = 277.330911027626 c1 = 544397.993363879, c2 = 0.694226518973787 R2 = 0.89
The Pressure data from both the sources showed best fit (figure 6) using Fourier model as shown below:
y = a0 + a1*cos(x*w) + b1*sin(x*w) +
a2*cos(2*x*w) + b2*sin(2*x*w) --- (5) Figure 2. Coherence (a), Differential Interferogram (b), Layover/Shadow (c) and the Amplitude image (d) of the area
a b
c
d
Figure 3. Temperature Distribution at Wenjiang from MODIS and Weather Station Data (January 2013)
where
a0 = 928.355481371852, a1 = 20.3200572678354 a2 = 8.19337634231737, b1 = 0.89260937059714 b2 = -23.1490688765605, w = 5.00292883176692 R2= 0.77
After establishing the relationship between the MODIS P/T products’ temperature and pressure values and those from weather station data, from the weather station's data closest to the SAR acquisition time of 11:00 Hrs UTC, the modelled temperature and pressure data have been estimated as 284.9 degK and 918.1 hPa. Using this observation for the latitude of the weather station, the MODIS atmospheric product of 10th January 2013, 03:00 Hrs UTC has been interpolated by
subtracting the temperature difference of 0.84deg K and adding the pressure difference of 3.4hPa to obtain the P/T spatial data which can be considered closest to the time of acquisition of the SAR data.
Similar procedure has been adopted for the post-earthquake data of 10th May 2013, where the MODIS products for the duration 7th May2013 to 12th May 2013 have been used. The regression models for temperature and pressure were the same form as the respective models described in equation 4 and 5, but with different coefficients. The coefficients for the temperature model for May 2013 are given below:
a1 = 259.289436667776, a2 = 60.1871002046553 b1 = 308.522903145292, b2 = 296.382924844186 c1 = 58.2252530386573, c2 = 15.9762212396032 R2 = 0.98
Similarly, the coefficients for the pressure model for May 2013 are:
a0 = 905.320642810387, a1 = -12.0467440675825 a2 = 6.79045717002944, b1 = 6.04118653336805 b2 = 13.1784274418057, w = 4.99634427704652 R2= 0.74
Using these relations, and the temperature and pressure data of the weather station closest to the SAR acquisition time of 11:00 Hrs UTC on 10th May 2013, the modelled temperature and pressure data have been estimated as 308.03 degK and 913.47 hPa. From these estimations, the temperature and pressure data of MODIS product of 03:00 Hrs UTC has been interpolated by adding 0.47degK and 7.17hPa respectively to derive the spatial distribution of temperature and pressure data for the study area closest to the time of acquisition of SAR data on10th May 2013.
After deriving the spatial distribution of temperature and pressure for both the acquisitions, the next step was computation of path addition due to the troposphere. This was achieved separately for January 2013 data and May 2013 data with the help of Equation 1 and 2. This was implemented in ENVI 5.0 by using the spatial layers of temperature and pressure (interpolated MODIS P/T data), constants and coefficients mentioned under equations 1 and 2. Vertical path addition has been converted to along the range using the off nadir incidence angle for the scene used in the study. The output comprises of the path addition of SAR acquisition in Figure 4. Pressure distribution at Wenjiang from MODIS and
Weather Station Data (January 2013)
Figure 5. Relation between temperature from MODIS and Weather station data (January 2013)
Figure 6. Relation between pressure from MODIS and Weather station data (January 2013)
January 2013 and May 2013 due to tropospheric effect. The tropospheric path addition for January 2013 acquisition time is in the range of 3.312 m and 4.911 m with mean value of 4.325m. For the May 2013 acquisition, the corresponding values are 3.364 m, 4.876 m and 4.322 m respectively.
The next process is to estimate the effect of ionosphere in the path of microwave pulses during the acquisitions. The TEC data available at http://omniweb.gsfc.nsasa.gov/vitmo/iri2012_ vitmo.html using International Reference Ionosphere 2012 model have been extracted for the study area (9.5 and 21.9 TECU for pre- and post-event data acquisition time respectively) used for computing ionospheric path reduction during the pre- and post-earthquake acquisitions. The values obtained are -0.294 m and -0.678 m (negative sign indicates phase advancement/path reduction) for the pre- and post-events’ SAR acquisitions times, respectively. The tropospheric path additions have then been recomputed by adjusting the respective ionospheric path reductions and the resultant path addition (the ionospheric effect is only of the order of 6 to 10% of the tropospheric effects in both the acquisitions) for 10 January 2013 and 10 May 2013 SAR acquisitions have been shown in figure 7.
The path addition for the pre-event SAR acquisition shows that the values range between 3.0223 and 4.62146 meters. Similarly the path addition for the May 2013 acquisition ranges between 2.68702 and 4.19851 meters. This addition is significant as sometimes the actual co-seismic deformation measurable on the surface may be of the order a few centimetres. The corresponding phase change can be obtained by using the wavelength of the SAR signal used. It can be seen that for longer wavelengths the resultant phase effects become smaller as compared to shorter wavelengths.
The differential path addition during the interferometric acquisition is computed by subtracting the path addition during the May 2013 acquisition from that during the January 2013 SAR acquisition. This path delay is converted to interferometric phase delay (due to atmosphere) using the wavelength of the SAR system used in the study (5.6 cm). The atmospheric phase delay component has been subtracted from the interferometric phase (after decomposing the Differential SAR interferogram to phase and module components) and the resultant phase has been combined back with the module component to generate the atmospheric phase delay corrected differential interferogram (figure 8).
In order to compare the effect of atmospheric phase delay, phase unwrapping using minimum cost flow (MCF) method was carried out to account for the modulo 2π ambiguity in the differential interferograms with and without atmospheric phase delay correction and the unwrapped phase values have been converted to LOS displacement. Due to the lay over and foreshortening problems in western Longmenshan ranges, conditional selection has been done to extract areas devoid of layover and shadow. Further, areas of low coherence (<0.3) have also been excluded from those for quantitative interpretation. The co-seismic displacement maps of the study area generated from interferograms with and without atmospheric phase delay correction have been given in figure 9.
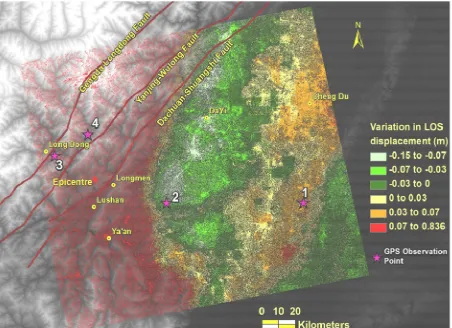
Examination of the LOS displacement map with atmospheric phase delay correction shows that the displacement values are in the range of 0.052 m and -0.062 m with dominant distribution in the range of 0.03 m and -0.04 m. The LOS displacement values from the DInSAR analysis without atmospheric phase delay correction shows that the values are in the range of 0.902 m and -0.157 m with predominant distribution in the range of 0.08 m and -0.10 m. Thus it is clear that there is significant path addition introduced due to the atmosphere during the SAR acquisitions that resulted in enhanced LOS displacement values. The differential LOS displacement map (figure 10, generated by subtracting the LOS displacement with atmospheric phase delay correction from the Figure 9. Comparison of LOS displacement from uncorrected and corrected interferograms
Figure 7. Net atmospheric path addition during January 2013 and May 2013 SAR acquisition
Figure 8. Atmospherically corrected filtered differential interferogram
LOS displacement without correction) shows that the atmospheric effects are far more dominant in the Longmenshan range region compared to the Sichuan basin. In the Sichuan basin the difference between both the values are mainly in the range of 7cm where as in the Longmenshan range region, this difference goes to 84 cm.
4. DISCUSSION AND CONCLUSION
This study reveals quantitatively that the atmospheric conditions during SAR acquisitions significantly influence the LOS displacement values derived using repeat pass DInSAR technique as the path distractions for the radar signals are distinct in time and space. The troposphere and the ionosphere behave differently to the signals. The troposphere introduces delay in the propagation of the waves through it where as ionosphere enhances the propagation. More significantly, the influence of ionosphere is of the order a tenth of that can be caused by the troposphere which causes a wet delay due to the water vapour and dry delay due to the influence atmospheric gases other than that of water vapour. Amongst different approaches used for estimating and correcting the tropospheric delay or the path addition, the combined use of tropospheric models with satellite derived surface weather parameters is advantageous due to the spatial coverage of satellite meteorological data, as compared to ground based meteorological observations. Global atmospheric models have the advantage of spatial and vertical distribution of various atmospheric parameters, but the validity of the models for local applications covering a few tens of kilometres in length and breadth may have to be established beyond ambiguity for definite application for DInSAR based deformation assessment.
The present study utilised satellite derived meteorological parameters available from the MODIS atmospheric products in combination with tropospheric model of Askne and Nordius (1987) for computing the tropospheric path addition during the SAR acquisitions. One difficulty in utilising the MODIS products for DInSAR application is possible mismatch in the timing of both acquisitions. In case of ENVISAT SAR data, the accompanying MERIS water vapour product can be used for from MODIS products. With the help of the developed models (Gaussian and Fourier respectively for the temperature and pressure data) using the weather station data of a time closest to the both the SAR acquisitions, the MODIS equivalent P/T values have been derived and then the MODIS data of that day have been interpolated using the corresponding P/T value differences.
The tropospheric path addition in the January 2013 acquisition is more than that in the May 2013 acquisition. The reason is that the temperature values are relatively higher during the May acquisition as compared to the January 2013 acquisition (winter period). In addition, the pressure values are relatively higher during the time of January 2013 data acquisition as compared to the May 2013 data. The ionosphere induced path distraction is relatively smaller as compared to the tropospheric component and is of opposite influence causing phase advancement rather than delay. The net influence of troposphere and ionosphere caused significant addition to the LOS displacement values. The effects are very much enhanced in the hilly region which have drastic P/T variations across winter and summer seasons as compared to the plain areas. Thus the atmospheric phase delay influence is more prominent in the Longmenshan mountain region as compared to the Sichuan basin.
The LOS displacement values computed from the differential interferograms generated with and without atmospheric phase delay correction have been compared with published GPS results (Wu et al., 2013) of co-seismic deformation. For 4 such locations (figure 10), the comparison is shown in table 2. It clearly indicates that the atmospheric phase delay correction has improved the LOS displacement values to reach within realistic limits as revealed by the GPS results. The deviations of the corrected LOS displacement values from the GPS derived co-seismic deformations values are within 1cm where as the uncorrected LOS displacement values vary up to 60cm. The unaccounted component in the corrected LOS displacement values might be the result of ongoing deformation (of the order of about 3-7mm /year across the Longmenshan fault; Hubbard and Shaw, 2009; Wang et al., 2002) that accumulated during the time interval between the acquisitions (in addition to the co-seismic component) and from the noise component.
Thus this study reveals that atmospheric effects can introduce significant variations in DInSAR derived deformation values and it emphasises the need for estimating and removing the tropospheric and ionospheric effects on radar signal propagation to derive reliable quantitative estimations of co-seismic deformation values.
Figure 10. Difference between and uncorrected and corrected LOS displacement values
ACKNOWLEDGEMENT
The authors thank Dr. V. K. Dadhwal, Director, NRSC for his encouragement to pursue this study. They also acknowledge the guidance of Dr. P. G. Diwakar, Deputy Director, NRSC. The data support from the NRSC/ISRO’s DMS Programme is thankfully acknowledged.
REFERENCES
Askne, J. and Nordius, H., 1987. Estimation of tropospheric delay for microwaves from surface weather data. Radio Science, 22(3), pp. 379-386.
Balaji, P. M., 2011. Estimation and Correction of Tropospheric and Ionospheric Effects on Differential SAR Interferograms. Unpublished M.Sc. Dissertation, ITC, The Netherlands.72p.
Bonforte, A., Ferretti, A., Prati, C., Puglisi, G. and Rocca, F., 2001. Calibration of atmospheric effects on SAR interferograms by GPS and local atmosphere models: first results. J. Atmos. Terr. Phys. 63, pp. 1343-1357.
Buck, A. L., 1981. New equations for computing vapour pressure and enhancement factor. Journal of Applied Meteorology, 20(12), pp. 1527-1532.
Collins, P., Langley, R. and LaMance, J., 1996. Limiting factors in tropospheric propagation delay error modelling for GPS airborne navigation. In Proceedings of The Institute of Navigation 52nd Annual Meeting, 19-21.
Danklmayer, A., Doring, B. J., Schwerdt, and Chandra, M., 2009. Assessment of Atmospheric Propagation Effects in SAR Images. IEEE Transactions on Geoscience and Remote Sensing, 47(10), pp. 3507-3518.
Delacourt, C., Briole, P. and Achache, J., 1998. Tropospheric corrections of SAR interferograms with strong topography: application to Etna. Geophysical Research Letters, 25, pp. 2849-2852.
Ding Xiao-li., Li Zhi-wei, Zhu Jian-jun, Feng Guang-cai and Long Jiang-ping, 2008. Atmospheric effects on InSAR measurements and their mitigation. Sensors, 8, pp. 5426-5448.
Doin, M. P., Lasserre, C., Peltzer, G., Cavalié, O. and Doubre, C., 2009. Corrections of stratified tropospheric delays in SAR interferometry: Validation with global atmospheric models. Journal of Applied Geophysics, 69(1), pp. 35-50
Goldstein R., 1995. Atmospheric limitations to repeat-track radar interferometry. Geophysical research letters. 22 (18), 2517-2520.
Hanssen, R. and Feijt, A., 1996. A first quantitative evaluation of atmospheric effects on SAR interferometry, Fringe '96 workshop, ERS SAR Interferometry.
Hubbard, J. and Shaw, J. H., 2009. Uplift of the Longmen Shan and Tibetan plateau and the 2008 Wenchuan (M = 7. 9) earthquake. Nature, 458, pp. 194–197.
Ifadis, I.M., 1986. The atmospheric delay of radio waves: modelling the elevation dependence of a Global scale.
Licentiate Thesis, Technical report No. 38L, Chalmers University of Technology, Gothenburg, Sweden.
Janssen, V., Ge, L.L. and Rizos, C., 2004. Tropospheric correction to SAR interferometry from GPS observations. GPS Solut.,8, pp. 140-151.
Jolivet, R., Agram, P. S., Lin, N. Y., Simons, M., Doin, M. P., Peltzer, G. and Li, Z., 2014. Improving InSAR geodesy using global atmospheric models. Journal of Geophysical Research: Solid Earth, 119(3), pp. 2324-2341.
Jolivet, R., Grandin, R., Lasserre, C., Doin, M. P. and Peltzer, G., 2011. Systematic InSAR tropospheric phase delay corrections from global meteorological reanalysis data. Geophys. Res. Lett., 38, L17311, doi:10.1029/2011GL048757
Kamarajugedda, S.A., 2013. Atmospheric correction of DInSAR phase for land subsidence measurements using an integrated approach. Unpublished M.Sc. Dissertation, ITC, The Netherlands.68p.
Li, Z. H., Muller, J. P., Cross, P., Albert, P., Fischer, J. and Bennartz, R., 2006a. Assessment of the potential of MERIS near-infrared water vapour products to correct ASAR interferometric measurements. Int. J. Remote Sens. 27, pp. 349-365.
Li, Z. W., Xu, W. B., Feng, G. C., Hu, J., Wang, C. C., Ding, X. L. and Zhu, J. J., 2012. Correcting atmospheric effects on InSAR with MERIS water vapour data and elevation‐dependent interpolation model, Geophysical Journal International, 189(2), pp. 898–910.
Li, Z. W., Ding, X.L, Huang, C., Wadge, G. and Zheng, D.W., 2006. Modeling of atmospheric effects on InSAR measurements by incorporating terrain elevation information. J. Atmos. Terr. Phys., 66, pp. 1189-1194.
Li, Z.H., Fielding, E.J., Cross, P. and Muller, J.P., 2006b. Interferometric synthetic aperture radar atmospheric correction: Medium Resolution Imaging Spectrometer and Advanced Synthetic Aperture Radar integration. Geophys. Res. Lett., 33, L06816.
Li, Z.H., Muller, J.P. and Cross, P., 2003. Tropospheric correction techniques in repeat-pass SAR interferometry. Proceedings of the FRINGE 2003 workshop, ESA ESRIN,
Frascati, Italy, 1-5, December 2003.
Li, Z.H., Muller, J.P., Cross, P. and Fielding, E.J., 2005. Interferometric synthetic aperture radar (InSAR) atmospheric correction: GPS, Moderate Resolution Imaging Spectroradiometer (MODIS) and InSAR integration, J. Geophys. Res., 110, B03410, doi:10.1029/2004JB003446.
Massonnet, D. and Fiegl, K. L., 1995. Discrimination of geophysical phenomena in satellite radar interferograms. Geophysical Research Letters, 22 (12), pp. 1537-1540.
Mathew, J., Majumar R. and Vinod Kumar, K., 2015. SAR interferometry and optical remote sensing for analysis of co-seismic deformation, source characteristics and mass wasting pattern of Lushan (China, April 2013) earthquake. International Journal of Applied Earth Observation and Geoinformation. 35, pp. 338-349.
Niell, A. E., 1996, Global mapping functions for the atmosphere delay at radio wavelengths. J. Geophys. Res., 100, pp. 3227– 3246.
Onn, F. and Zebker, H. A., 2006. Correction for interferometric synthetic aperture radar atmospheric phase artefacts using time series of zenith wet delay observations from a GPS network. Journal of Geophysical Research: Solid Earth, 111, B09102, doi:10.1029/2005JB004012
Saastamoinen, J., 1972. Atmospheric Correction for the Troposphere and Stratosphere in Radio Ranging of Satellites. Geophysical Monograph Series: The use of artificial satellites for Geodesy, 15, pp. 247-251.
Smith, E. K., and Weintraub, S., 1953. The constants in the equation for atmospheric refractive index at radio frequencies. Proceedings of the IRE, 41(8), pp. 1035-1037.
Tarayre, H. and Massonnet, D., 1994. Effects of a Refractive Atmosphere on Interferometric Processing. In Geoscience and Remote Sensing Symposium, 1994. IGARSS'94. Surface and Atmospheric Remote Sensing: Technologies, Data Analysis and Interpretation., International, 2, pp. 717-719 IEEE.
Thayer, G. D., 1974. An improved equation for the radio refractive index of air. Radio Science, 9(10), pp. 803-807.
Wang, P., Zhang, Niu, Z., Freymueller, J. T., Xi’an Lai, Yanxin Li, et. al., 2002. Present-day crustal movement and tectonic deformation in China continent. Science in China, Series D: Earth Sciences, 45(10), pp. 865-874.
Williams, S., Bock, Y. and Fang, P., 1998. Integrated satellite interferometry: Tropospheric noise, GPS estimates and implications for interferometric synthetic aperture radar products. J. Geophys. Res., 103(B11), 27051–27067, doi:10.1029/98JB02794.
Wu, Y. Q., Jiang, Z. S., Wang, M., et al., 2013. Preliminary results pertaining to co-seismic displacement and pre-seismic strain accumulation of the Lushan MS 7.0 earthquake, as reflected by GPS surveying. Chinese Science Bulletin, doi: 10.1007/s11434-013-5998-5.
Zebker, H. A., Rosen, P. A. and Hensley, S. 1997. Atmospheric effects in interferometric synthetic aperture radar surface deformation and topographic maps. J. Geophys. Res., 102, pp. 7547-7563.