KEY WORDS: Image processing, Atmospheric correction, ATCOR, validation, aerosol retrieval, RapidEye, Landsat
ABSTRACT:
Atmospheric correction of satellite images is necessary for many applications of remote sensing, i.e. computation of vegetation indices and biomass estimation. The first step in atmospheric correction is estimation of the actual aerosol properties. Due to the spatial and temporal variability of aerosol amount and type, this step becomes crucial for an accurate correction of satellite data. Consequently, the validation of aerosol estimation contributes to the validation of atmospheric correction algorithms. In this study we present the validation of aerosol estimation using own sun photometer measurements in Central Europe and measurements of AERONET-stations at different locations in the world. Our ground-based sun photometer measurements of vertical column aerosol-optical thickness (AOT) spectra are performed synchronously to overpasses of the satellites RapidEye, Landsat 5, Landsat 7 and Landsat 8. Selected AERONET data are collocated to Landsat 8 overflights. The validation of the aerosol retrieval is conducted by a direct comparison of ground-measured AOT with satellite derived AOT using the ATCOR tool for the selected satellite images. The mean uncertainty found in our experiments is ΔAOT550nm ≈ 0.03±0.02 for cloudless conditions with cloud+haze fraction below 1%. This AOT uncertainty approximately corresponds to an uncertainty in surface albedo of Δρ≈ 0.003. Inclusion of cloudy and hazy satellite images into the analysis results in mean ΔAOT550nm ≈ 0.04±0.03 for both RapidEye and Landsat imagery. About
of samples perform with the AOT uncertainty better than 0.02 and about perform with AOT uncertainty better than 0.05.
* Corresponding author.
1. INTRODUCTION
Atmospheric correction of satellite data is required for many applications of remote sensing, like computation of vegetation indices, biomass estimation and plant health studies. It reduces effects of scattering and absorption by gases and aerosols in the atmosphere between the Earth’s surface and the sensor and minimizes the influence of solar illumination and topography on the registered signal. However, application of atmospheric correction algorithms requires knowledge about the uncertainty of the correction process. This study provides an estimation of correction uncertainty of the atmospheric correction tool ATCOR (Richter, 1996, Richter et al., 2006) using ground-based sun photometer measurements. We used RapidEye and Landsat satellite data for comparative exercise.
Atmospheric correction includes correction of molecular absorption, molecular scattering and aerosol effects. The largest uncertainties for atmospheric correction procedures arise out of aerosol correction due to spatial and temporal variation of aerosol amount and type. Therefore, we investigate the uncertainty of atmospheric correction by validation of aerosol estimation. Kaufman et al. (1997) showed that an uncertainty in aerosol retrieval ∆AOT550nm is linked to an uncertainty in surface reflectance ∆ρ by the relation of:
∆ρ = ∆AOT550nm / 10. (1)
In this study we make use of easy available and frequently used satellite data and widely known tools for their pre-processing to
provide experimental estimates of uncertainty in aerosol-optical thickness (AOT) retrieval and thus surface reflectance calculation. Our findings may help to recognize the influence and assess the effects of atmospheric correction uncertainty for RapidEye and Landsat multispectral data for environmental applications.
2. DATA
2.1 Test sites
The proposed validation of atmospheric correction requires ground-based measurements of vertical column AOT-spectra synchronously to satellite overpasses. Validation is performed by direct comparison of aerosol retrieval from ATCOR with ground-based results.
2.2 Satellite data
Landsat satellites have observed Earth from space since 1972. Landsat 5 Thematic Mapper (TM) was launched in 1984 and was operational imaging until November 2011, for over 27 years (USGS, 2014a). TM had 6 spectral bands in the visible, near infrared, and short wave infrared portions of the spectrum and 1 thermal band. Currently, both Landsat 7 and Landsat 8 collect data. They were launched in 1999 and 2013 (USGS, 2014b, 2014c). Each of both satellites has a 16-day revisit cycle with an 8-day offset between Landsat 7 and Landsat 8. Landsat 7 Enhanced Thematic Mapper Plus (ETM+) was constructed with the same bands like Landsat 5 TM and an additional panchromatic band. One of the improved features of ETM+ is the on-board calibration capability. The Landsat 8 payload consists of 2 sensors – the Operational Land Imager (OLI) and the Thermal Infrared Sensor (TIRS). OLI collects data in the heritage Landsat multispectral bands with refined bandwidth and improved radiometric performance. Additionally OLI has 2 new bands – one in the deep blue for coastal zone observations and one tailored especially for detecting cirrus clouds. All 3 Landsat satellites follow a near-polar, sun-synchronous orbit at a nominal altitude of 705 km covering the entire earth every 16 days. Common to all 3 Landsat sensors is also the swath width of 185 km resulting in scene size of 170 km x 185 km with pixel size of 30 m. Landsat Level-1 data products are geometrically and radiometrically corrected images.
RapidEye is a constellation of 5 satellites equipped with identical sensors and located in the same orbit plane (RapidEye AG, 2012). The satellites are equal distributed along sun-synchronous orbit in 630 km altitude. The RapidEye satellites have a revisit time of 5.5 days at nadir and a daily revisit capability with off-nadir observations. RapidEye’s Multi-Spectral Imager (MSI) sensors have 5 spectral bands (RapidEye AG, 2012) in the visible to near-infrared spectral range with a swath width of 77 km. Ground sampling distance of 6.5 m at nadir results in 5 m pixel size of the ortho-rectified images. This study is based on Level 3A tiles (RapidEye Ortho Product) provided with radiometric, sensor and geometric corrections. The size of RapidEye tiles is 25km x 25km.
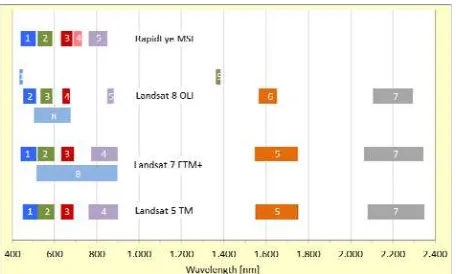
Figure 2 shows the distribution of Landsat and RapidEye spectral bands in the spectrum. The main difference between
the Landsat and RapidEye sensors with respect to atmospheric correction applications is the existence of a spectral band around 2.2 µm for Landsat instruments.
2.3 Sunphotometer data
Ground-based measurements were performed with 2 Microtops II Instruments: an Ozonometer and a sunphotometer. Both instruments have a field of view angle of 2.5°. Channel specifications are given in Table 1. Radiation captured by collimators and bandpass filters radiates onto the photodiodes. Silicon photodetectors are used for the visible and near infrared (NIR) channels. In the first three channels GaP photodetectors (Gallium Phosphate) are used due to their sensitivity in the UV region, low noise level and low sensitivity above 500 nm. Signals from the photodiodes are processed in series with 20 conversions per second so that results can be treated as if the photodiodes were read simultaneously.
Optical channels
Table 1. Channel specifications of Microtops instruments
Measurements were performed at each time with both instruments in a close sequence; first few scans with one Microtops and immediately afterward few scans with the other. Thus, the data characterize the atmosphere at the same time and can be analyzed coupled. Measuring multiple scans with each instrument allows excluding some scans with imperfect orientation to the sun.
AERONET stations are equipped with CIMEL CE-318 instruments (Holben et.al., 1998). The CIMEL spectral radiometer is a robotically pointed sun and sky spectral radiometer with a 1.2° full angle field of view. The instruments measure direct solar radiation and radiance of the solar aureole and the sky. Eight interference filters serve for spectral band selection between 340 nm and 1640 nm. Standard bands are 440 nm, 670 nm, 870 nm, 940 nm and 1020 nm. UV enhanced silicon detectors with sufficient signal-to-noise are used for spectral observations between 300 nm and 1020 nm. Other detectors like InGAs are used for the longer wavelengths. A direct sun measurement for all 8 bands takes approximately Figure 1. Location of test sites used for these investigations.
Red squares mark locations of AERONET sites (global data set) and blue triangles mark locations of own sunphotometer measurements (regional data set).
that published by Kaufman for processing of MODIS data (Kaufman and Sendra, 1988; Kaufman et.al., 1997). Landsat data have a spectral channel around 2.2 µm, which can be easily used for detection of dense dark vegetation (DDV) pixels. The influence of aerosols at 2.2 µm can be neglected and the signal measured at satellite can be interpreted as surface reflectance. Empirical correlations of reflectance of DDV-pixels between the shortwave infrared (SWIR) and the red band, and between the red and blue band are used for aerosol retrieval. RapidEye data cannot be processed with that algorithm, because of lack of SWIR channel. The algorithm applied for sensors like RapidEye relies on multiple thresholds for determination of DDV-pixels in the red part of the spectrum (Richter et.al., 2006) and uses only the empirical correlation between the red and blue band.
Atmospheric correction module ATCOR2 (software version 8.3.1, 2014) for flat terrain conditions was used for processing satellite data. Adjustable parameters had been set to variable aerosol optical thickness (visibility) over the scene, haze removal over land and no shadow removal. Haze removal is switches off automatically by ATCOR if the percentage of haze pixels is below 2%. Rural aerosol type was selected with the atmospheric model corresponding to the latitude zone and season. Adjacency range was set to 1 km and number of adjacency zones to 1.
Selection of rural (continental) aerosol type is generally a convenient choice for processing atmospheric correction with ATCOR. The selected aerosol type determines the initial wavelength behavior of the path radiance. ATCOR adapts the wavelength course of the path radiance to the current situation during processing. This adaptation provides spectral bands exist in the blue-to-red- region and the scene contains reference areas of known reflectance behavior. Both conditions are satisfied for the Landsat- and RapidEye satellite images under consideration, with exception of the AbuDhabi image. The fix choice of rural aerosol model was tested for part of the regional data set running ATCOR with three of the four aerosol type models available in ATCOR: maritime, rural, and urban. The aerosol model for desert condition is not representative for the regional test sites. Processing with maritime and rural aerosol models give nearly identical results in the visible/NIR. Urban aerosol type gives very different results, with lower agreement with the ground-truth data.
3.2 Processing of sunphotmeter measurements
Microtops sunphotometer measurements are processed using a coupled analysis of sunphotometer and ozonometer measurements (Pflug, 2013). First ozonometer data are used for computation of vertical column ozone content [cmSTP]. Actual vertical column ozone content is necessary for computation of
Direct Sun Algorithm makes use of satellite observations as input for NO2 and O3 total column concentrations (AERONET, 2008).
4. RESULTS AND DISCUSSION
4.1 Results of Microtops-sunphotometer measurements
Reliable ground-truth data are crucial precondition for accurate validation of atmospheric correction procedures. Compilation of the data set to be finally used for the validation therefore required a rigorous cloud screening of in-situ data. As a result 2 datasets collocated with satellite images were discarded from analysis.
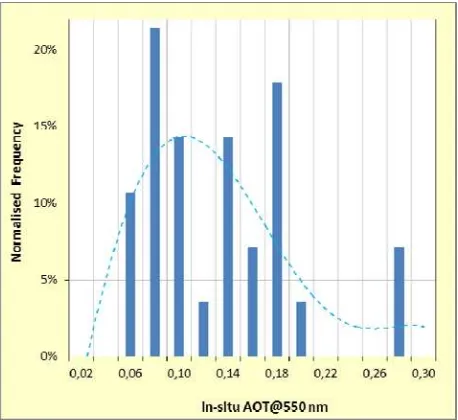
The final, cloud-screened regional dataset contains 28 samples. 20 of these samples are located in the Potsdam/Berlin area and 6 are located at the Baltic Sea coast. The final regional dataset covers very low to high vertical column aerosol content (Figure 3). The in-situ AOT at 550 nm ranges from 0.05 to 0.28 with a mean value of 0.12. With the global data set (AERONET) this range is extended to AOTmax of 0.42. The data set covers all seasons, mostly from spring to fall. It is representative for a wide variation of different solar zenith angles. More than 80% of the data samples have an Ångstrœm-exponent above 1, indicating the dominance of continental aerosols.
4.2 Results of ATCOR processing
ATCOR processing is applied for Landsat Level-1 products and RapidEye Level-3A tiles. These top-of-atmosphere (TOA) data are geometrically and radiometrically corrected. Main output of ATCOR is atmospherically corrected Bottom-of-atmosphere (BOA) reflectance for all sensor spectral bands. Optional outputs are a haze-cloud-water mask, an AOT image and a DDV classification image. DDV classification image shows the spatial distribution of DDV reference pixels classified for the AOT estimation.
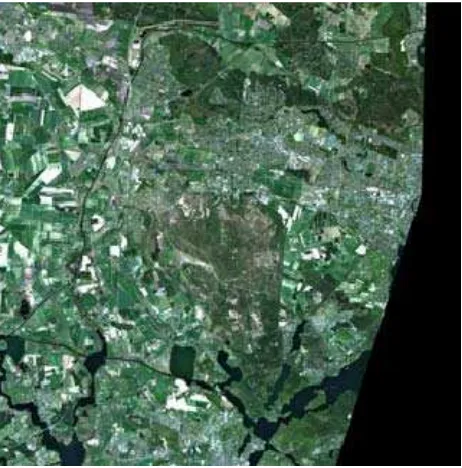
One validation example for the RapidEye sensor is presented on Figure 4. The upper left image is a RGB-composite of Level-3A TOA data representing the input to ATCOR. Processing was executed with default settings (rural aerosol type and the fall/spring atmosphere). Fall/spring atmosphere was selected regarding the acquisition time in April. The upper right image represents the atmospherically corrected BOA output image of ATCOR. The haze/cloud/water mask at the lower left corner contains 0.1% cloudy (grey) and 5.1% water pixels (deep blue). ATCOR classified thin haze over water or sun glint for some lakes (light blue) for 4.2% of the pixels. Majority of the pixels were classified as land surface (orange), with 12.6% of DDV pixels (lower center, green) well distributed over the tile. Classified DDV pixels match forest areas in the image. AOT image at the lower right shows little variation of AOT over the tile from 0.28 (black) to 0.30 (white). Mean AOT within the 5x5 pixel vicinity of sunphotometer location (red circle) is 0.30 and mean AOT over the full tile is 0.29 ±0.005. Ground-truth AOT from Microtops measurements is 0.27 ±0.002. The Ångstrœm-exponent of 1.66 indicates presence of continental aerosols.
4.3 Comparison of ATCOR results with ground-truths
4.3.1 AOT retrieval uncertainty for cloudless images of the regional data set is analyzed by comparison of AOT550 retrieved with ATCOR from satellite data with ground-truth values. Cloudless images are defined for this analysis by having cloud+haze cover below 1% in the ATCOR haze/cloud/water mask. Mean AOT over 3x3 Landsat pixels and over 5x5 RapidEye pixels around the location of sunphotometer measurements was used for the comparison exercise, shown in Table 2 and Figure 5.
Mean uncertainty of ATCOR aerosol retrieval for atmospheric correction is about 0.03±0.01 for AOT at 550 nm. This corresponds to uncertainty of surface reflectance of about 0.003 following equation (1). The trendline in Figure 5 indicates a tendency of ATCOR for overestimating AOT550 in very clear atmospheres and for underestimating AOT550 in turbid atmospheres.
Number of samples
Mean of AOTdifferences
Maximum of AOTdifferences
Landsat 5 0.036 ± 0.021 0.072
7 ETM 2 0.046 ± 0.037 0.072
8 OLI TIRS 3 0.029 ± 0.008 0.038
Rapid Eye 8 0.028 ± 0.010 0.043
All together 13 0.031 ± 0.015 0.072
Table 2. AOT retrieval uncertainty (NxN area mean) for cloudless images of the regional data set.
Figure 4. Example for processing RapidEye data
Upper left: RGB composite of input image (top of atmosphere) Red circle marks the sunphotometer location. Upper right: RGB composite of corrected image (BOA) Lower left: haze/cloud/water mask
Lower center: DDV classification map Lower right: AOT-image
Figure 5. AOT estimated from satellite data using ATCOR compared with in situ-AOT for the regional data set.
The grey, long-dashed line is the linear trend through the data points.
Both Landsat 8 and RapidEye sensors perform similar good. Although Landsat and RapidEye data are processed with different algorithms within ATCOR, this gives evidence, that both algorithms provide equivalent results. The worse results for Landsat 7 may originate from the very low number of samples.
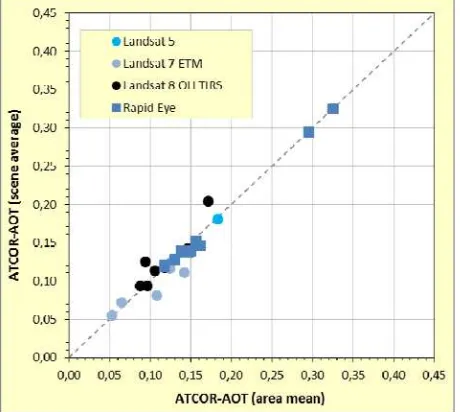
4.3.2 Mean of NxN pixel area compared with scene average: Next question addressed is about spatial variability of AOT over the satellite images. This is investigated on basis of ATCOR-AOT, which is the AOT estimated from satellite images using ATCOR. Figure 6 shows a plot of scene average ATCOR-AOT over area mean of NxN pixel vicinity around sunphotometer location. NxN is 5x5 pixels for RapidEye and 3x3 pixels for Landsat data. We found a good agreement between scene average and area mean, both for Landsat and
average for Landsat is 0.03, which is comparable with the ATCOR-AOT difference to the ground-truth (Table 2). Validation of Landsat data performed better for area mean than a full scene. Landsat images should be processed with variable AOT.
4.3.3 AOT retrieval uncertainty for cloudless images of the global data set: Global and regional data sets provide comparable results. Figure 7 indicates the same trend for global data as found for the regional data set (Figure 5). ATCOR is overestimating low turbidity and underestimating high turbidity. Mean uncertainty of ATCOR aerosol retrieval for Landsat 8 data and the global data set is about 0.04±0.03 for AOT at 550 nm. The uncertainty for the global data set is little higher than for the regional data set due to the occurrence of higher AOT-values. Processing desert image from AbuDhabi gives a large AOT-difference of 0.11 between ATCOR retrieval and ground-truth.
4.3.4 AOT retrieval uncertainty for cloudy images: Previous results are limited to conditions with cloud cover less than 1%. Cloudless scenes are marked in Figure 5 with unfilled data points and data points with some clouds present in the images are filled. There are no remarkable differences in the processing results for cloudless and little cloudy images. Aerosol retrieval in ATCOR provides accurate results even with some clouds are present in the satellite image.
Figure 6. Scene average of ATCOR-AOT over area mean around sunphotometer location.
Figure 7. AOT estimated from satellite data using ATCOR compared with in situ-AOT for the global data set.
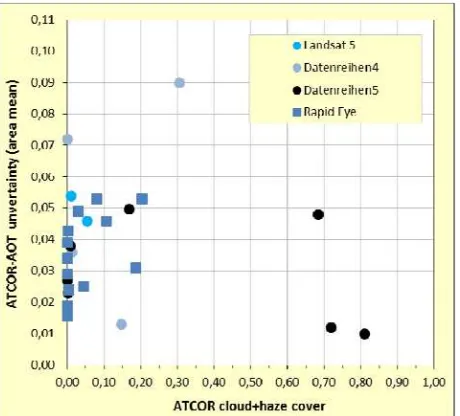
Figure 8. ATCOR-AOT estimation difference to ground-truth values as function of cloudiness.
Number of samples
Mean of AOTdifferences
Maximum of AOTdifferences
Landsat 31 0.040 ± 0,029 0.109
5 TM 2 0.048 ± 0.004 0.051
7 ETM 5 0.042 ± 0.028 0.064
8 OLI TIRS 24 0,038 ± 0,031 0,109
Rapid Eye 14 0,035 ± 0,018 0,078
All together 45 0,038 ± 0,026 0,109
Table 3. AOT retrieval uncertainty for cloudless and cloudy images of the regional and global data set.
Dependency of AOT uncertainty on cloudiness is plotted in Figure 8. We found Landsat 8 images with up to 80% clouds providing excellent aerosol retrieval, if the test area around the sunphotometer is cloudless. Cloudless 20% of the Landsat images obviously can provide sufficient information for successful atmospheric correction processing.
Unfortunately, there is only one example of a dataset with images from 2 overpassing satellites at the same day and test site (September 6, 2011). The RapidEye image is covered by 11% clouds and haze and the Landsat 5 image by 6%. Processing the Landsat 5 image and the RapidEye tile for this day gave identical results in the vicinity of the location of sunphotometer measurements. Mean AOT values over full images were not compared due to high cloud contamination over the RapidEye tile.
Finally, overall retrieval uncertainty is given in Table 3 . Mean AOT retrieval uncertainty both for cloudless and cloudy images is 0.04±0.03 for AOT at 550 nm. This corresponds to uncertainty of surface reflectance of about 0.004 following equation (1). Figure 9 shows that about 33% of the images are processed with aerosol retrieval uncertainty less or equal to 0.02. AOT retrieval performs better than AOT uncertainty of 0.05 for about 70% of scenes. Only 10% of images are processed with AOT differences larger than 0.07 between ATCOR retrieval from satellite data and ground truth.
5. SUMMARY AND CONCLUSIONS
Atmospheric correction algorithm ATCOR was validated on the level of aerosol retrieval uncertainties for regional samples of test sites in middle Europe and a global test site with AERONET stations around the world. ATCOR has shown a very nice performance. Mean uncertainties of aerosol retrieval with ATCOR are ΔAOT550 ≈ 0.04 corresponding approximately to surface reflectance uncertainty Δρ ≈ 0.004. ATCOR AOT retrieval shows a tendency for underestimating the AOT for high atmospheric turbidity and overestimating for low turbidity. Landsat and RapidEye data are processed with different algorithms within ATCOR. Both algorithms are working precise and comparable. Aerosol retrieval in ATCOR provides accurate results even with some clouds present in the satellite image. More satellite overpasses synchronous to atmospheric ground-truth measurements would allow performing a more detailed and significant statistical analysis.
The present study is limited to validation of aerosol estimation, which is a crucial issue for validation of atmospheric correction. Additional studies to validate surface reflectance and other processes and effects in atmospheric correction are required and forthcoming.
ACKNOWLEDGEMENTS
We sincerely thank BlackBridge AG for providing data from the RapidEye Science Archive (RESA) and USGS for providing Landsat data. We thank Tymon Zielinski from the IOPAS for assistance organizing the measurements at the Polish Baltic Sea Coast and we thank Helge Witt for performing some of the Microtops measurements. We thank the PIs and their staff for establishing and maintaining the AERONET sites used in this investigation.
atmospheric corrections to visible and near-IR satellite imagery. International Journal of Remote Sensing 9(8), pp. 1357-1381.
Kaufman, Y. J., Wald, A. E., Remer, L.A., Gao, BC., Li, RR. and Flynn, L., (1997). The MODIS 2,1-µm Channel-Correlation with Visible Reflectance for Use in Remote Sensing of Aerosol. IEEE Transactions on Geoscience and Remote Sensing 35(5), pp. 1286-1298
Pflug, B., (2013). Ground based measurements of aerosol properties using Microtops instruments. AIP Conf. Proc. 1531, pp. 588-591 ;
doi: 10.1063/1.4804838, http://dx.doi.org/10.1063/1.4804838
RapidEye AG, 2012. Satellite Imagery Product Specifications, Version 4.1, September 2012, Brandenburg, Germany
Richter, R., 1996. A spatially adaptive fast atmospheric correction algorithm. International Journal of Remote Sensing 17(6), pp. 1201–1214;
http://dx.doi.org/10.1080/01431169608949077
Richter, R., Schläpfer, D. and Müller, A., 2006. An automatic atmospheric correction algorithm for visible / NIR imagery. International Journal of Remote Sensing 27(10), pp. 2077– 2085; doi:10.1080/01431160500486690
Shaw, G.E., 1983. Sun photometry. Bull. Am. Meteorol. Soc. 64(1), pp. 4-11
USGS, 2014a. U.S.Geological Survey. http://landsat.usgs.gov/about_landsat5.php
USGS, 2014b. U.S.Geological Survey. http://landsat.usgs.gov/about_landsat5.php