REVIEW OF PUBLIC TWEETS OVER TURKEY WITHIN A PRE-DETERMINED TIME
A. G. Gulnerman a*, N. E. Gengec b, H. Karaman a
a ITU, Civil Engineering Faculty, 34469 Maslak Istanbul, Turkey - (gulnerman, karamanhi)@itu.edu.tr b Here Maps, Cankaya Ankara, Turkey – (necipenesgengec)@gmail.com
KEY WORDS: VGI, Social Media, Twitter, Pedestrian Route
ABSTRACT:
Spatial data by using public knowledge is the most popular way to gather data in terms of social media within the last decade. Literature defines, public or volunteers are accepted bionic sensors detecting their surroundings and share what they detect in terms of their social media applications or microblogs. Besides being cheapest and fastest and easy way of spatial data acquisition, public or volunteers provides not only spatial data but also attribute data which makes the data more valuable. To understand and interpret those data have some difficulties according to locality. Although some difficulties like difference of languages, society structure and the time period would affect tweets depending on locality, gathering public knowledge or volunteered data contribute many scientific or private researches like Urban, Environmental, and Market side. To extract information, data should be reviewed locally according to main aim of research. In this study, our aim is to draw a perspective for a PhD research about volunteered data in the case of Turkey.
* Corresponding author
1. INTRODUCTION
This study aims to interpret the social media data and spatial data to develop a volunteered geographic information based on a pre-determined time interval, using spatial and semantic analyses. To accomplish the aim of this study, a spatial database was developed to integrate the twitter API’s and java libraries in an application Geo Tweets Downloader. Advent of internet technology foster many researches in the last decade but in the geospatial study field it creates a main branch to gather data in addition to surveying, photogrammetry and remote sensing, called as in some different name; “social media” or “volunteered geographic information” (VGI) or “public participation geographic information systems” (PPGIS). Goodchild (2007) declare that there are 6 billion sensors around the world, he intends that people living all around the world would sense and provide data without any motivation factor. On the other hand, people do not only provide data as they are, they interpret all the things as their inner or outer visions. Moreover, they prefer to manipulate all those data that they interpret. According to (Ball, 2002), PPGIS projects may produce biased results due to the benefits of the participants. The main concern in PPGIS concept is the contradiction between the regional benefits and the personal benefits of the study area, while entering data into the system by the use of public participation. VGIs advantage may arise at this point. Participants of VGI do not know the aim of the project while they were contributing the process, that’s why, the conflict of interests situation does not appear and manipulation can be avoided in the case of VGI. Sakaki et al. (2010) noted that social media applications like Twitter, Tumblr and Plurk are micro-blogging services that provide platforms to their members to send brief text updates or multimedia such as photographs and audio clips with the locations of them.
Turner (2006) define a new term as neogeographers as; “people using and creating their own maps, on their own terms, by combining elements of an existing toolset” and neogeography as; “sharing location information with friends and visitors, helping shape context, and conveying understanding through knowledge of place”. If the neogeographic applications and their contributors were classified, three different classes may arise. The first class can be explained as the “deliberate volunteered” actions like Open Street Map. The second class can be marked out as “unconscious volunteers” acting in applications like foursquare (Foursquare, 2016). The third class can be classified as the public actions like in PPGIS projects (Gulnerman and Karaman, 2015). Apart from the classification above, Hecht and Shekhar (2014) classify the VGI into 3 categories as; Social Media VGI, Peer-Production VGI, and Citizen Science VGI.
tweet, second one is about the position of the query word within a tweet, and the last one is about the words in a tweet and the words before and after the query word.
The language is arising as another issue while considering about the words within the tweets, because of the difference in semantic between the languages.
As the literature review widens, it can be easily recognized that due to the popularity of the twitter usage, many VGI studies have focused on the twitter data. Another advantage of twitter data is the volume of it with an average of 307 million monthly active users as sensors within the third quarter of 2015 (Statista, 2016). As Statista (2016) declared, at the beginning of the 2014, Twitter had exceed 255 million monthly active users per microblogging application should be interpreted based on which circumstances according to what kind of topics, which time periods, within which society and language, and other local differences. In other words, the interpretation of twitter data should be analysed locally. The local word could be understood as the neighbourhood, district, city, region, country even continent with respect to the aim of study.
In this study, our aim is to understand the twitter data of Turkey within the car free days and our main question is that could we monitor or define the path of pedestrians and route of cars by using real time data within emergency period in Turkey within the PhD research.
2. METHODOLOGY
Using social media on spatial applications first requires the spatial definitions for the posts. There are some applications that can be used to handle the posts spatially, however most of them are for specific subjects or for projects. That’s why, the first part of this paper is designed to explain the methodology of the development of the data acquisition technique from the social media with their spatial information.
Data acquisition is carried out with a desktop application which gathers public Tweets by Twitter to a spatial database (Gengec, 2015). Twitter has a RESTful API (Twitter, 2015a) and StreamingAPI (Twitter, 2015b) for public use, to manage, use and query Twitter functions and to use special API methods within. Those methods are implemented into Java programming language by an open source Java Library called Twitter4j (Yamamoto, 2015). With the use of Twitter4j, users can use implemented RESTful and StreamingAPI functions of Twitter with their own authentication parameters to their Java applications.
As it was indicated above, there was no such application to define the spatial location, time and the text of the posts at the same time and classifying them based on the mentions. In this study, an application is developed in Java programming language using Twitter4j. This application listens Twitter’s tweet stream using StreamingAPI methods using Twitter4j library, which consist of instantaneous tweets by users who let their tweets to be public. Geo Tweets Downloader filters the
tweets from the stream, which have geographic coordinates in a boundary defined by the user with upper left and lower right corners of the area. Following the filtering process, the application sends the filtered tweets to the PostgreSQL database supported with the PostGIS extension. Then, these data converted to a point base vector shape file including the attributes of “twitter_username”, “tweet_text”, “tweet_time” and geographic coordinates as soon as the application detects a tweet within the user defined boundary area. With the help of the Geo Tweets Downloader application a twitter user can collect tweets from the Twitter’s public stream in specific time intervals based on the user defined boundaries, according to their research needs. After collection of these tweets into PostgreSQL database, user can connect to database and export the tweet data into another spatial vector data format.
Second title focused on the general information about acquired data in the context of what kind of data has been acquired, when that data has been acquired, what is included within data. The time interval for the data acquisition were selected to receive multiple events within the study area. During the data acquisition period there were, World Car free Network, Veteran Soldier Day for Turkey, Political rally, RunIstanbul, AdımAdım, and Greater Eid. The importance of these dates are to receive as much different subjects as possible within a limited time interval and to determine the difference between the subject and users. To detect and classify the tweets of different events “hashtag”s were used. The second step after the data tweets and the valuation of the results. Based on three classes of the acquired data, the spatial distribution of the tweets was compared with the population distribution of Turkey. As it can be seen from Figure 3 and 4, although, there are visual similarities on the distribution maps, it has also been recognized that the analyses should include the age distribution with respect to cities. Semantic contents of the tweets were also taken into consideration. Based on the hashtags within the tweets, the tweets were also classified to relate the tweets with the events mentioned on title 2. Following the classification, the queries were run, which are composed of different notation of keywords like bike and Bicycle, dogumgunu and doğumgünü which means birthday in Turkish or nişan means engagement as it can be seen below.
Hashtag ID Hashtag Hashtag Query
7 Table 1. Semantic Classification and Queries for Tweets
3. CASE STUDY
Case study can be divided to four sub titles, which are data acquisition technique, general information about acquired data and review of acquired data and valuation. Turkey has been chosen as the study area and the time interval of the study has been chosen based on the previously declared activities in Turkey.
3.1 Data Acquisition Technique
For data acquisition of this study, Geo Tweets Downloader application developed (Figure 1) and used to collect Tweets in the user defined boundary that surrounds Turkey country border between 18th and 20th of September 2015.
Figure 1. User interface of the Geo Tweets Downloader
3.2 General Information About Acquired Data
Case Study Data had been acquired between 18th and 20th September 2015. The chosen date coincides with a very busy weekend with many activities. Acquired data has stored and recorded both spatially within the user defined boundary and non-spatially. The non-spatial part of the data is composed of id, twitter user name, tweet text, latitude, longitude, insert-time columns. Another important information about the acquired data within this study is the usage wrights of personal information. Twitter data can be classified into two categories based on the publicity of the contents. The first category consists of the tweets that cannot be seen, downloaded and used by the third party users and the second category consists of the tweets that can be seen, downloaded and used by the public. Before the interpretation of the tweet data, the publicity of the data has been controlled from the twitter stream and only the data that have public usage rights were downloaded. Based on this criterion totally 35 thousand tweet data were downloaded.
3.3 Review of Tweets Over Turkey
The distribution of the 35 thousands of tweets over Turkey can be seen from the Figure 2. These tweets belong to the time intervals defined in section 3.2. Following the acquisition of the general information for the tweets, the data were interpreted under three sub-titles. The first one is based on the number of tweets and their spatial distribution and relation to population density to decide if the number of the tweets are related to the population. The second sub-title is consisting of semantics of tweets as non-spatial contents like hashtags and their spatial reflections. The third sub-title is for the relation of the twitter-user and their path or route interpretation to investigate the
possibilities for the route generation from the actual twitter users for several purposes including the emergency management.
Figure 2. Public Tweets between 18th and 20th of September 2015
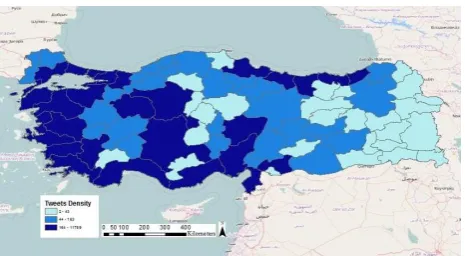
3.3.1 Spatial Distribution of Tweets: Turkey population distribution data according to Turkish Statistical Institute (TUIK, 2014) within the 2015 has been mapped thematically by three quantile class to determine, if the distribution of random tweets similar to population density or not (Figure 3). In other words, tweets distribution may show spatial distribution of population for activities as sample statistics. As seen in Figure 4, tweets distribution intersecting city boundary has also been mapped by three quantile class, is not the same but, it looks similar with the population distribution. It has been determined from this study with some advanced information from the twitter user like age the correlation with the population data may be increased. Based on this result the distribution of the age may be more similar to the tweets distribution.
Figure 3. Population Distribution of Turkey (2015)
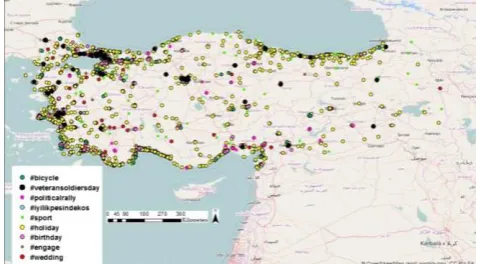
3.3.2 Semantic Content of the Tweets: The use of social media for spatial applications does not only depends on the location data but also requires the semantic information that can be used as the attributes for the records. Based on this approach, textual contents of the tweets were used to classify the events. involves World Car Free Day which is celebrated every year on or around 22nd of September and organized 20th of September in 2015 to eliminate by receiving attention car dominancy through city environment (WorldCarfreeNetwork, 2012). Another event within the interval was, Veteran Soldier Day for Turkey in 19th of September, which is national Memorial Day (TürkiyeMuharipGazilerDerneği, 2013). Third event was a political rally on 20th of September. The fourth event was an intercontinental run festival between Asian and European side of Istanbul and some relief agencies join that organization to gather financial aid (AdımAdım, 2015; RunIstanbul, 2015). Fifth event was the combination of several sport competitions like football and basketball match days. Sixth event was the eve of the Greater Eid which is a religious holiday celebrated by the Muslim Communities (GeneralDirectorateofReligiousServices, 2015). The other three event categories are related with special day events like birthdays, engagements and weddings. Approximately, 8300 tweets on main hashtag topics which are mentioned above, has been grouped within ArcMap Software by using specific keywords to be able to catch every related tweet within the composed queries (Figure 5). As it can be seen from the Table 2 below, the queries are not just composed of keywords, they are composed of different notation of keywords like bike and Bicycle, dogumgunu and doğumgünü which means birthday in Turkish or nişan means engagement but ‘nişantaşı’ was removed from selection because it is popular district in Istanbul and not related with the hashtag subject. The other tweets cannot be grouped as hashtags but each hashtags includes their spatial distribution within the related area.
Figure 5. Categorized Hashtag Distribution
Hashtag IDs &
# of Tweets Hashtags from Tweets
1 #beach #sea #fish #diving #dive #güneş #gunes #yaz #bahar
3.3.3 Path of Tweets: The main purpose of this study was to determine the paths or routes of the twitter users by using their tweets’ location information and review the availability of the tweets within the extraction of the real time public routes from the trace of the tweets. Based on the acquisition, spatial and semantic analysis of the twitter data, 5774 path and route were determined by sorting insert time of tweets from each user within 35000 tweets (Figure 6). First results highlights that, interval from one point to other. The paths and routes like that as in Figure 7 accepted as the flight distance.
The second fastest travel speed was attained to the twitter users that were assumed to be driving within a car or motor vehicle. The time interval represented by those tweets have shown good match to a car travel time in Istanbul. The time interval derived from the starting and ending nodes of the tweets can be seen in the Figure 8.
Figure 8. Driver Travel Length within a Reliable Time
The third class of route determination is based on a pedestrians speed. Those tweets can be separated by their fit on the real road network. Some of those paths generated just on the road within short length of path and time, path provides more information about road network as pedestrian like in the Figure 9. Even though, the assumptions on the pedestrian paths from the tweets fits good on the road network, the assumptions about pedestrian could be wrong if the traffic at the route were taken into consideration. That’s why a traffic map can be used for future studies to increase the determination method. As a result of this study, it has been understood that, another outlier detection algorithm about that kind of data is required to increase the accuracy.
Figure 9. Pedestrian Travel Length within a Short Time
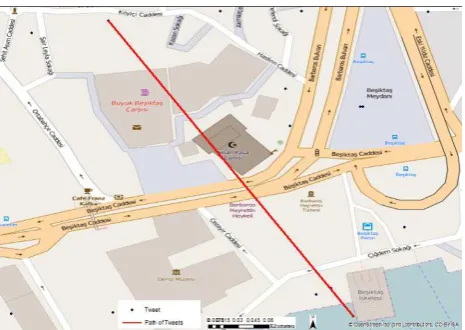
There were also some other route examples, which were not on the road. But, from start to end times and distances between the nodes of the tweets, they can be estimated as the pedestrian routes like in Figure 10.
.
Figure 10. Pedestrian Travel Path Estimation Case
Tweets location in Figure 10, have been used as the starting and ending locations to navigate from one to another using the HEREmap navigation application (HEREMap, 2016). Two alternatives were determined from HEREmap as it can be seen from Figure 11, in consideration of travel time as pedestrian with 9 or 10 minutes. Therefore, by using time difference and tweets locations, the path of twitter user could be estimated. Also the same tweets’ locations were used within GoogleMap application webpage too and it was also resulted with a 10 minute of travel time for a pedestrian (GoogleMap, 2016). However, GoogleMap showed just one route for a pedestrian as it can be seen in Figure 11. Most probably the second possible alternative would have been eliminated because of the passage inside the park on the possible path.
Figure 11. Pedestrian Travel Path Navigation within HEREmap
Figure 12. Pedestrian Travel Path Navigation within GoogleMap
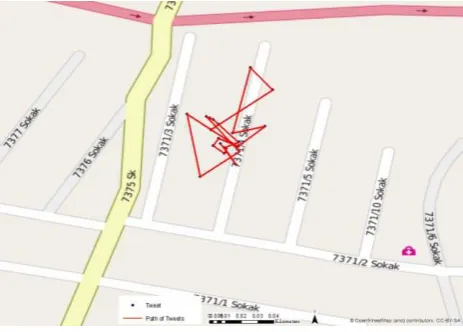
may be confusing to extract paths like in Figure 13. The user may be a tourist guide or may have another mission to cover area. But those kinds of tweet data may have the potential to disarray the path or route detection algorithms in applications like emergency management.
Figure 13. Over Tweets Path
3.4 Valuation
The applicability of a technique depends on the validation of the proposed method. To evaluate the applicability and find out the vulnerabilities of the method, twitter data as a product of microblogging services, counted as VGI and it has been examined in three points. Those were the concept of data distribution, semantics of data and spatial path of data. In the first concept, total data showed proper distribution with the population distribution of Turkey which validate the acquired data and the results of it, as real and credible. Second concept focused on the semantics of words, which are crucial to understand what people really wished to share. In case of more than one language usage within an area, hashtags would be different even in the same view or subject and hashtags could look like the same but the topic would not be the same. Third evaluation concept was based on the path of tweets, which could define different ways of transportation as pedestrian, terrestrial motor vehicle, nautical vehicle or plane. As it was mentioned in section 3.3, if the generally accepted speeds for the transportation types taken into consideration, the results can be easily classified based on the transportation times. Another result would be similarity of road path if it is within reliable time limits according to speed limits. Moreover, data would mean exactly a part of road network and it could be detected with a short time interval between first and second tweet. It may also presumable under same condition within a short time limit from one point to another if there are more than one alternatives for the road network path. The most vulnerable part could be the redundant tweets within a limited time interval that could create meaningless linear combinations to create a path or a route, as it can be seen from Figure 13.
4. RESULTS & QUESTIONINGS
Data extraction from VGI requires prerequisites to evaluate data. The aim of study should be considered to frame those meaningless. Under the spatial circumstances, the distribution of data gathering is necessary and according to aim, evaluation of spatial data should be analysed within their algorithm. Spatial data algorithm would require attribute data or metadata for evaluation before the extraction.
Within the context of this study, extraction of roads required five main algorithms which were mentioned in the valuation part. In further studies, algorithms should be examined with attribute data and its semantics. And the idea creating algorithm over one user’s tweets would be developed by the other user’s tweets who are close to each other. Moreover, those algorithms should be tested within a big data archive and tests results may provide some clues to develop the idea.
Even though, the memory of the network knowledge may not be permanent within the engineering or geographical concept, the social media enables to store the memory spatially both as driver and pedestrian mode users. The importance of VGI increases as a solution on the ongoing argument about the memory of network knowledge about cities on the salient feature of urban space that reveal corresponding to transportation mode as driver and as pedestrian as mentioned by Manley et al. (2015).
All the results based on the assumption of the twitter user’s tweet at the exact time of arrival and departure to the related spatial location. The reliability of the exact time and location of the tweets may not be as it was assumed in this study. However, as the number of tweets increase, the reliability also increases at the average time and location data. As Ghilani (2010)
Ball, J., 2002. Towards a methodology for mapping ‘regions for sustainability’ using PPGIS. Progress in Planning 58, 81-140.
Borau, K., Ullrich, C., Feng, J., Shen, R., 2009. Microblogging for Language Learning: Using Twitter to Train Communicative and Cultural Competence, in: Spaniol, M., Li, Q., Klamma, R., Lau, R.W.H. (Eds.), Advances in Web Based Learning – ICWL 2009: 8th International Conference, Aachen, Germany, August
19-21, 2009. Proceedings. Springer Berlin Heidelberg, Berlin,
Heidelberg, pp. 78-87.
Ebner, M., Schiefner, M., 2008. Microblogging - more than fun? Proceedings of IADIS Mobile Learning Conference 2008, 155-159.
Foursquare, 2016. About Us, https://foursquare.com/about, 04 February.
GeneralDirectorateofReligiousServices, 2015. List of Public
Holiday for the Year of 2015,
falar/2015Y%C4%B1l%C4%B1ResmiTatilG%C3%BCnleri.asp x, 2015 September.
Gengec, N.E., 2015. Geo Tweets Downloader, 1 ed, github, p. Spatial Tweets Downloader.
Ghilani, C.D., 2010. Adjustment computations : spatial data
analysis, 5th ed. JOHN WILEY & SONS, INC, United States of
America.
Goodchild, M.F., 2007. Citizens as sensors: the world of volunteered geography. GeoJournal 69, 211-221.
GoogleMap, 2016. Google Map.
Gulnerman, A.G., Karaman, H., 2015. PPGIS Case Studies Comparison and Future Questioning, Proceedings - 15th International Conference on Computational Science and Its
Applications, ICCSA 2015, pp. 104-107.
Hecht, B., Shekhar, S., 2014. From GPS and Google Maps to Spatial Computing, 2014 ed. Coursera Inc.
HEREMap, 2016. HERE Map.
Manley, E.J., Addison, J.D., Cheng, T., 2015. Shortest path or anchor-based route choice: a large-scale empirical analysis of minicab routing in London. Journal of Transport Geography 43, 123-139.
Naaman, M., Boase, J., Lai, C.-H., 2010. Is it really about me?: message content in social awareness streams, Proceedings of the 2010 ACM conference on Computer supported cooperative work. ACM, Savannah, Georgia, USA, pp. 189-192.
Paul, M.J., Dredze, M., 2011. You Are What You Tweet: Analyzing Twitter for Public Health.
RunIstanbul, 2015. Nike Run Istanbul 2015 10K, https://www.nike.com/events-registration/event?id=18599, 2015 September.
Sakaki, T., Okazaki, M., Matsuo, Y., 2010. Earthquake shakes Twitter users: real-time event detection by social sensors, Proceedings of the 19th international conference on World
wide web. ACM, Raleigh, North Carolina, USA, pp. 851-860.
Statista, 2016. Number of monthly active Twitter users worldwide from 1st quarter 2010 to 3rd quarter 2015 (in millions), http://www.statista.com/statistics/282087/number-of-monthly-active-twitter-users/, 31 January.
TUIK, 2015. 2014 Address Based Census System Registration (ADNKS), http://tuikapp.tuik.gov.tr/adnksdagitapp/adnks.zul, August 2015.
TürkiyeMuharipGazilerDerneği, 2015. Gaziler Günü, http://muharipgaziler.org.tr/gaziler-gunu/, 2015 November.
Twitter, 2015a. REST APIs.
Twitter, 2015b. The Streaming APIs.
WorldCarfreeNetwork, 2015. World Carfree Network - Global Network, http://www.worldcarfree.net/about_us/global/.