RECONSTRUCTION OF BUILDING FOOTPRINTS USING SPACEBORNE TOMOSAR
POINT CLOUDS
M. Shahzad a , X. X. Zhu a,b *
a
Helmholtz Young Investigators Group "SiPEO", Technische Universität München, 80333 Munich, Germany - [email protected]
b
Remote Sensing Technology Institute (IMF), German Aerospace Center (DLR), Oberpfaffenhofen, 82234 Weßling, Germany - [email protected]
Commission VI, WG VI/4
KEY WORDS: TerraSAR-X/TanDEM-X, tomographic SAR (TomoSAR) inversion, 3-D point cloud, building footprint, clustering
ABSTRACT:
This paper presents an approach that automatically (but parametrically) reconstructs 2-D/3-D building footprints using 3-D synthetic aperture radar (SAR) tomography (TomoSAR) point clouds. These point clouds are generated by processing SAR image stacks via SAR tomographic inversion. The proposed approach reconstructs the building outline by exploiting both the roof and façade points. Initial building footprints are derived by applying the alpha shapes method on pre-segmented point clusters of individual buildings. A recursive angular deviation based refinement is then carried out to obtain refined/smoothed 2-D polygonal boundaries. A robust fusion framework then fuses the information pertaining to building façades to the smoothed polygons. Afterwards, a rectilinear building identification procedure is adopted and constraints are added to yield geometrically correct and visually aesthetic building shapes. The proposed approach is illustrated and validated using TomoSAR point clouds generated from a stack of TerraSAR-X high-resolution spotlight images from ascending orbit covering approximately 1.5 km2 area in the city of Berlin, Germany.
*
Corresponding author
1. INTRODUCTION
Modern very high resolution (VHR) spaceborne SAR sensors such as TerraSAR-X/ TanDEM-X and COSMO-SkyMed can deliver data beyond the inherent spatial scales of buildings. These VHR data are particularly suited for detailed urban mapping. Among advanced SAR interferometric methods, TomoSAR is the most general 3-D SAR imaging principle, because of its layover separation capability. Geocoding high density of scatterers, retrieved from TomoSAR, into world coordinates enable the generation of high quality TomoSAR point clouds, containing not only the 3D positions of the scatterer location but also estimates of seasonal/temporal deformation, that are very attractive for generating 4-D city models from space.
Object reconstruction from spaceborne TomoSAR point cloud has been recently started (D’Hondt et al., 2013)(Shahzad and Zhu, 2015a) (Fornaro et al., 2014). These point clouds have point density in the range of 600,000 ~ 1,000,000 points/km2 and are associated with some characteristics that are worth to mention (Zhu and Shahzad, 2014):
1) TomoSAR point clouds deliver moderate 3D positioning accuracy on the order of 1 m;
2) Few number of images and limited orbit spread render the location error of TomoSAR points highly anisotropic, with an elevation error typically one or two orders of magnitude higher than in range and azimuth (Zhu and Bamler, 2012); 3) Due to the coherent imaging nature, temporally incoherent
objects such as trees cannot be reconstructed from multipass spaceborne SAR image stacks;
4) TomoSAR point clouds possess much higher density of points on the building façades due to side looking SAR geometry enabling systematic reconstruction of buildings
footprint via façade points analysis.
As depicted over smaller and larger areas in (Zhu and Shahzad, 2014) and (Shahzad and Zhu, 2015a), façade reconstruction turns out to be an appropriate first step to detect and reconstruct building shape from these point clouds when dense points on the façade are available. Especially, when data from multiple views, e.g., from both ascending and descending orbits, are available, the full shape of buildings can be reconstructed using extracted façade points. However, there are cases when no or only few façade points are available. This happens usually for lower height buildings and renders detection of façade points/regions very challenging. Moreover, problems related to the visibility of façades mainly pointing towards the azimuth direction can also cause difficulties in deriving the complete structure of an individual building. These problems motivate researchers to derive full 2-D building footprint via roof point analysis. In this regard, based on different object contents illuminated by side looking SAR, the following three cases could be derived using data acquired from one incidence angle e.g., image stacks from ascending orbit only.
Case 1: Higher density of façade points present with no or very few roof points - In this case, the complete 2D/3D building shapes could be fully reconstructed by adding points from multiple incidence angles. The solution to this case is demonstrated in (Shahzad and Zhu, 2015a) where 3-D façades model have been reconstructed for high rise buildings using one incidence angle only and in (Zhu and Shahzad, 2014) where full shape of the building was derived by prior fusion of two point clouds from ascending and descending stacks.
Case 2: Higher density of façade points present together with existence of relatively high density of roof points - This case allows to reconstruct full shape of the building footprints from a
single data stack by making use of both façade and roof points. Thus, the side of the building visible to the sensor could be reconstructed as the first step and later the other side of the building could be completed by exploiting the available roof points.
Case 3: No or very few façade points available but enough roof points exist - This case particularly appears for lower height buildings rendering detection of façade points/regions very challenging. This motivates us to obtain the full 2-D/3-D footprint of these buildings via roof point analysis only using conventional techniques as applied by LiDAR community. Even though these techniques are very much matured, still their adaptation to TomoSAR point clouds is not straight forward due to different object contents illuminated by side looking SAR together with problems related to low and varying point density and much lower positioning accuracies of TomoSAR point clouds in comparison to airborne LiDAR.
In this paper, we propose a novel data driven approach that systematically allows automatic reconstruction of 2-D/3-D building footprints using unstructured TomoSAR points clouds generated from one incidence angle only. The approach proposes new methods and aims at finding a more general and systematic solution towards automatic reconstruction of the whole city area. The paper essentially presents solutions for the latter two cases (i.e., case 2 and case 3) by extending (or utilizing) the solution provided for case 1 in (Shahzad and Zhu, 2015a). Following are the innovative contributions proposed in this paper:
1) A recursive angular deviation based approach is presented to smooth/refine the initial coarse building polygons obtained using alpha shapes (generalization of convex hulls).
2) A novel façade-roof fusion procedure is proposed which is robust and fuses the legitimate Façade-Polygon pair together by interpreting the refined/smoothed polygon of each building as a graph.
3) An effective and robust procedure is developed for rectilinear identification of building polygons.
4) Finally, due to the high inclination angle of the TerraSAR-X orbit, i.e. near-polar orbit, the approach presented in (Shahzad and Zhu, 2015a) may fail to reconstruct building façades facing North or South due to lack of measurements. This paper inherently provides solution to this problem by exploiting roof points in determining the complete shape/footprint of the building.
2. METHODOLOGY
The whole processing begins by first identifying the probable building regions. This is accomplished by incorporating information pertaining to façades as prior knowledge (i.e., regions corresponding to higher point density indicate probable façade regions). Thus, building façade points are extracted, segmented to points belonging to individual façades, and further reconstructed. The reconstructed façades are used to select seed points which are used to extract available roof points via a minimum height constraint surface normals based region growing procedure. And then roof points without the support of façades point (i.e., case 3) are further extracted out from the remaining points by formulating the extraction problem into an energy minimization framework. Detailed procedure of reconstructing façades and extracting building points via hybrid region growing and energy minimization procedure are
described in (Shahzad and Zhu, 2015a)(Zhu and Shahzad, 2014) and (Shahzad and Zhu, 2015b) respectively.
In this work, automatic segmentation of previously detected/extracted building points is then obtained by clustering points belonging to individual buildings. Later, boundary/outline polygons (or footprints) are reconstructed and refined/smoothed for each individually segmented building cluster. Afterwards, robust fusion of legitimate Façade-Polygon pairs is carried out to improve geometrical accuracy of the refined footprints. Finally, after identification of rectilinear footprints, rectangular constraints are inserted to yield geometrically correct and visually aesthetic building shapes. Next we explain the whole procedure in detail.
2.1 Segmentation into individual buildings
The extracted building points are segmented into individual clusters such that each cluster represents points from an individual building using the concept of density connectivity (Ester et al., 1996). I.e., two points are considered to be directly density connected to each other if one is in the neighborhood clustered into single group representing an individual building. These clustered points are then removed and the procedure is repeated for remaining number of points until all the points are assigned to any one particular cluster
.
2.2 Coarse building footprint
Reconstruction of building shape is initially obtained by employing alpha shapes (generalization of convex hull) around each segmented building (Edelsbrunner and Mücke, 1994). The output of the alpha shape (or α-shape) algorithm is the vertices that describe the 2-D polygonal boundary of the building footprint. The reconstructed shape depends on a particular value of α which has to be carefully chosen since α controls the model complexity. An overlarge α could make it difficult to follow concave polygonal shapes, e.g., an L-shaped building. Therefore, an estimate of α that produces reliable building shape, including smaller structures, may be chosen as twice of the mean of Euclidean distances computed for every point from its nearest neighbor among the set of building points (Dorninger and Pfeifer, 2008).
2.3 Refined outlines
Alpha shapes method provides good initial estimates of building outlines. However, due to lower point density of TomoSAR points, it only defines the coarse outline of an individual building. The resulting polygons are therefore irregular and need to be refined/ regularized. If we denoteValpha
Vi1,...,N
as a set containing N matrices of building polygons returned by the alpha shapes algorithm and V with j
ji as the matrix containing 2-D vertices of the initial alpha polygon of the jth building, then inspired from (Dorninger and Pfeifer, 2008), the recursive procedure summarized in Table 1 is adopted to refine the coarse reconstructed building footprints returned by the alpha shapes algorithm.(a) (b)
Figure 1: Illustration of the concept of Pt_shortest and P
. Refined polygon of one particular jth building j V having
verticesvk1,...,m with four reconstructed façadesf f1, 2,f3 and f4 that are to be incorporated. (a) illustrates the concept of shortest and
longest paths associated for a particular façade f1. v1a and v denotes the closest points on the polygon/graph 1b Vj to the two endpoints of façade f1 respectively; (b) Illustration of the concept of positive path P. P2 _ shortestis identified as Pas there exist
points in K that are also present in 2 P2 _ shortest i.e., K2P2 _ shortest since P2 _ shortest contains points on red line and
2 1a, 1b, 3a 3b 4a 4b
K v v v v v v .
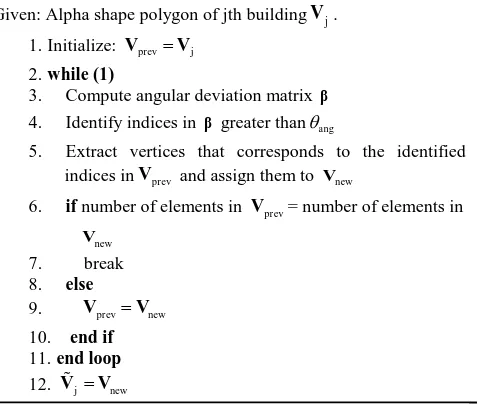
Given: Alpha shape polygon of jth building
V
j.1.Initialize: VprevVj
2. while (1)
3. Compute angular deviation matrix β 4. Identify indices in β greater thanang
5. Extract vertices that corresponds to the identified indices inVprev and assign them to Vnew
6. if number of elements in Vprev= number of elements in
Vnew 7. break 8. else 9.
VprevVnew 10. end if 11. end loop 12. VjVnew
Table 1: Refinement of alpha shape polygons.
The procedure in begins by computing the angular deviations at each vertex point of the alpha polygon as
1 1
1 if 90
with cos 180 if 90
j j
j j
j j
j j j j
dv dv dv dv
(1)
where '
' denote the dot product and dv is the direction vector j computed at each edge formed by connecting two consecutive vertices v and j vj1 of the polygonVprev (initialized to V ). j Step 4 and 5 ensures that all those vertices (or edges) having angular deviations less than the threshold angare removed.new
V andVprev are then compared and the process repeats itself if any vertex is removed in the current recursive iteration i.e.,
new
V and Vprev do not contain the same number of elements. Finally, the process terminates when there is no further removal of vertices.
2.4 Incorporating reconstructed façades
To improve the geometrical accuracy of the footprints, the reconstructed façades are fused with the refined building polygons. For this purpose, the façade associated to each refined building polygon is categorized into following two types:
1) Type I façade: Façade fully or partly inside the refined polygon.
2) Type II façade: Façade lying completely outside but associated to the refined polygon.
The above mentioned two façade types are fused with the refined building polygon in slightly different manners as explained later.
2.4.1 Identification of legitimate Façade-Polygon pairs
In order to achieve fusion of reconstructed façades with the refined building polygons, the foremost task is to identify the association of each façade to its respective building polygon.
Identification of type I façades is easily achieved by checking if the endpoints of the reconstructed façades lie inside the polygon. Thus if both or at least one of the façade endpoints lie inside the polygon, it is categorized to be type I façade.
To identify façades of type II, following procedure is adopted:
1) First the midpoint of the reconstructed façade is computed and two points are chosen in opposite directions orthogonal to the reconstructed façade at a distance d from the midpoint;
2) Compute intersections of line1 and line2 with all the building polygons. Here line1 denotes the line segment formed from by connecting midpoint to one of the chosen points and similarly line2 is line segment formed by connecting midpoint to the other opposite point;
3) If there exists an intersection of line1 or line2 with any of the building polygons, façade is assigned to the polygon with which the intersection occurs. In case there are more than one line-polygon intersections or both line1 or line2 intersects with different polygons, the façade is assigned to the polygon having the intersection point nearest to it.
Implementation-wise, steps 1-3 are performed in a recursive manner. I.e., d is initialized to 1m and steps 1-3 are carried out. In case, there exists no line-polygon intersection (i.e., façade is not assigned to any polygon), the procedure repeats itself but this time d is incremented by 1m. The recursion stops if either the façade is assigned to any polygon or the distance d exceeds a certain threshold which is set to fixed 20m in this work. Thus a façade is only associated/paired to any building polygon if it lies at a distance less than 20m, otherwise it is regarded to have no polygon associated to it (i.e., categorized to case 1).
2.4.2 Fusion of Façade-Polygon pairs
f as the corresponding s number of (paired) reconstructed
façades. Now if the building polygon, formed by connecting vertices of Vj, is interpreted as a graph, then we may define a path Pt for any particular façade ft as a way consisting of
polygonal chain of vertices that connect two pointsv and ta vtb lying on the graph/polygon. I.e., the polygonal segment comprising of all the points of the polygon Vjwithin the interval
v vta tb
defines path Pt.vta and v denote points on tb the building polygon which are nearest to the two endpoints of the particular reconstructed façade ft. Since in our case, thelength (i.e., perimeter) of the polygon.
_ t shortest
P is further classified into two types: Positive path
Pand negative path P. If we denote the set of points on the polygons that are nearest to the end points of all façades of the same building (or polygon) other than ft as Kt (i.e.,K t process while façades having negative paths are not considered any further.
provides the complete procedure to incorporate façades of both types with the refined building polygon. Steps 12 to 15 in Table 2 pose a condition C1 for all façades of type I such that they do not take part in the fusion process if the change in area of the polygon after incorporating the particular façade is greater than a certain fraction af of the previous polygon area. af is fixed
to 0.15 in this work. This is to ensure that façades belonging to the inner structures of the building do not interfere during the fusion procedure or in other words only façades that are exterior and define the building outlines are utilized.
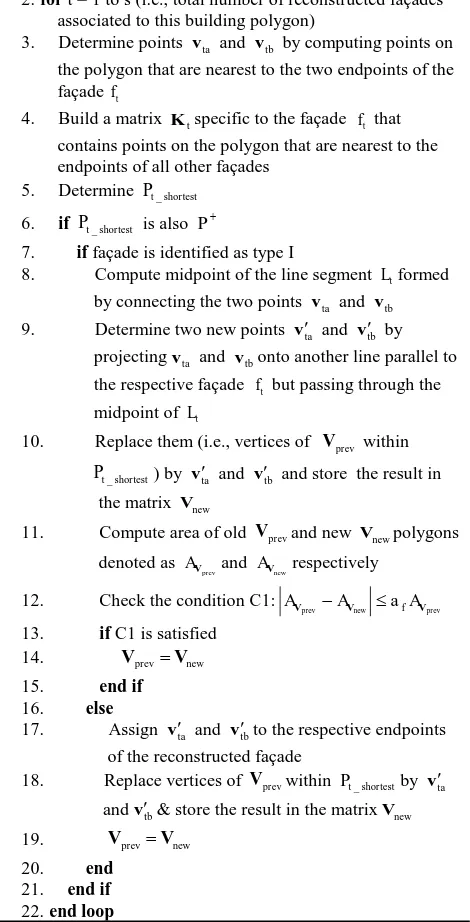
Given: Refined polygon of jth building Vj& s reconstructed
façades fr1,...,s belonging to the same jth building
1. VprevVj
2. for t = 1 to s (i.e., total number of reconstructed façades associated to this building polygon)
3. Determine points v and ta v by computing points on tb the polygon that are nearest to the two endpoints of the façadeft
4. Build a matrix K specific to the façade t ft that contains points on the polygon that are nearest to the endpoints of all other façades
5. Determine Pt_shortest
Table 2: Procedure to fuse façades of both types.
Note that there lies some differences in computation of vta and tb
v for type I and II façades (steps 8-9 and 17 in ). The reason
for this is due to the fact that point density on building roofs is quite varying and can contain gaps in between. This could lead to under reconstruct the building footprint i.e., part of the building roof region could not be reconstructed due to unavailability of points. Presence of type II façades implicitly validates this plausible phenomenon and therefore fusion of refined polygons by fully incorporating the reconstructed façades (of type II only) ) result in improved overall accuracy of reconstruction. Doing same for type I façade, on the other hand, may affect the footprint polygon in presence of façades belonging to inner building structures. Thus, only the orientation of type I façade is essentially incorporated by the proposed procedure (steps 8-9 in ). In addition to this, steps 12 to 15 in also pose a condition C1 for type I façades such that they do not take part in the fusion process if the change in area of the polygon after incorporating the particular façade is greater than the certain fraction af (fixed to 0.15 in this work)
of the previous polygonal area. Thus, using condition C1 together with the method of type I façade fusion, it is ensured that façades belonging to the inner structures of the building do not interfere during the fusion procedure or in other words only façades that are exterior and define the building outlines are utilized.
2.5 Identification of rectilinear buildings
The next step in the reconstruction procedure is to identify if the building is composed of two or more than two dominant directions. In case the building polygons is composed of only two dominant directions orthogonal to each other, rectilinear constraints are then added to derive geometrically correct and better visually looking building shapes.
The decision of identifying a rectilinear building is based on its estimated dominant/principal direction. For this purpose, the principal direction of the case 2 building polygons (i.e., having one or more reconstructed façades associated to each polygon) is easily determined by assigning it to the direction vector computed by subtracting the endpoints of the longest reconstructed façade paired to it. For case 3 building polygons, the principal direction is directly estimated from the polygon itself. Since no façade is associated to them, a weighted method based on polygonal edge lengths is employed to estimate the two orthogonal principal directions of the building. The basic idea is to give weight to each edge of the polygon according to its relative length (with respect to total polygon length) and the angular deviation which it makes with a particular direction vector dv . q dv is candidate for one of the two orthogonal q principal directions and is rotated within a certain interval to minimize the following objective function (Zhang et al., 2006):
to one of the two orthogonal directions (or axes) as defined by
direction vector dv and its corresponding normal vector. It is q computed as weight to each edge based on its relative length with respect to the overall length of the polygon edges. It is constructed in a way such that edges with longer lengths contribute less in (2) as compared to shorter edges lengths. Following linear function is used to describe g1
: less weight as compared to the ones that are deviating. Since the span of i for each edge is defined to be within the interval0 45
, therefore g2
is computed by adopting the following linear function as:
corresponding normal vector associated to the optimum (or
minimum) ˆdvq arg min
Once the principal/dominant directions are determined, the following procedure is adopted for identification of rectilinear buildings:
1) Determine angular difference i
0 i 90
of all the edges of the polygon with respect to the dominant/principal directions;2) Compute histogram of these angular differences;
3) Find the edges whose angular differences are within the
Subsequently, rectilinear constraints are added to the identified building polygons to yield much better (visually appealing) geometric building shapes. The following steps are performed to obtain rectilinear building footprint:
1) Classify each edge of the building polygon such that it belongs to one of the two orthogonal principal axes based on its angular deviation (i.e., an edge is associated to that
principal direction with whom the angular difference is less);
2) Merge all adjacent edges that share a same class, i.e., associated to the same principal direction;
3) Apply rectilinear transformation to every merged polygonal edge by projecting it onto its corresponding principal axis/vector;
4) Computing intersection (or vertex) points between the consecutive vertices.
3. EXPERIMENTAL RESULTS & VALIDATION 3.1 Dataset
To validate our approach, we tested the algorithm on the TomoSAR point clouds generated from a stack of 102 TerraSAR-X high resolution spotlight images from ascending orbit using the Tomo-GENESIS software developed at the German Aerospace Center (DLR) (Zhu et al., 2013). The test area contains relatively complex building structures and covers approximately 1.5 km2 in the city of Berlin, Germany. The number of TomoSAR points in the area of interest is about 0.52 million.
3.2 Reconstruction results
Figure 2(a) shows the result of applying façade reconstruction procedure and Figure 2(b) shows result of building points extraction. Extracted building points are then spatially segmented to obtain cluster of points such that each cluster represents an individual building. Figure 3(a) depicts the result of spatially clustering extracted building points into individual buildings. The initial coarse outline of each cluster is then determined using alpha shapes algorithm. It provides good initial estimates of building outlines. However, the value of α affects the shape of the initial coarse polygon. Setting a larger α restricts in obtaining concave boundaries whereas lower values may result in smaller boundary polygons that are actually not present. In addition to this, with smaller α it is also possible that the outer and inner polygons share one (or more) common vertex which may result in improper geometry of footprints. To adaptively select an appropriate value of α, we initialize α = 5m (reasonable trade-off for our data) which is recursively incremented by 1m if resulting polygons share common vertices or minimum area of any resulting polygon is less than 50 m2. Black polygons in Figure 3(a) surrounding each individual segmented building cluster depict their corresponding alpha polygons. Refinement of the initial coarse alpha vertices is then carried out by computing angular deviation at each vertex point. The threshold value ang 20
is used which consequently
remove all vertices having angular deviations less than 20from their adjacent neighboring vertices. ang = 0 results in the
original alpha polygons i.e., no refinement or regularization. Setting a too high value for ang may however result in over
refinement/smoothing. Refined or smoothed alpha polygons are then fused with the reconstructed façades. Later, rectilinear constraints are added to the building polygons that are identified to be rectilinear. Figure 3(b)-(d) depicts the results of building footprint reconstruction.
3.3 Reference footprints
The actual ground truth data are missing for exact quantitative evaluation of the approach. In order to provide some qualitative measures of the algorithm performance, we compared our
building extraction results to reference polygons downloaded from the OpenStreetMap (OSM) (“GEOFABRIK,” 2015).
3.4 Evaluation strategy
In order to evaluate the reconstruction results, we rasterized both the reconstructed and reference polygonal footprints onto an image with pixel resolution of 1m (i.e., 1 pixel corresponds to 1m2 spatial area). A difference image created by subtracting the reconstructed footprint image from the reference footprint image is then used to compute the commission and omission
F are number of pixels in the difference image having values
of -1 and 1 respectively.
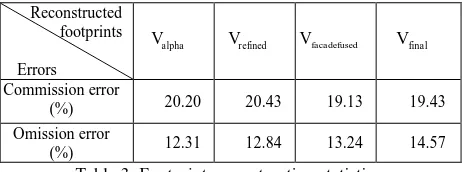
Figure 4 presents the common and difference images. The red pixels in the difference images indicate the building regions that are not reconstructed by the proposed algorithm contributing to the omission errors whereas blue pixels are over reconstructed regions i.e., pixels not part of the reference footprint image but present in the reconstructed image. lists the commission and omission errors obtained for the reconstructed footprints.
Reconstructed footprints
Errors
alpha
V Vrefined Vfacadefused Vfinal
Commission error
(%) 20.20 20.43 19.13 19.43
Omission error
(%) 12.31 12.84 13.24 14.57
Table 3: Footprint reconstruction statistics.
Hypothetically, the reconstruction results will be improved with higher density of TomoSAR points because more points would be available for parameter estimation. Numerical experiments also demonstrated that reconstruction accuracy is better for buildings with higher density of roof points. For low density roof regions, the reconstruction accuracy is however restricted due to less number of available points which consequently increases the omissions errors. Further improved model based approach might be helpful in this regard. Additionally, the reconstruction errors between the final and coarse 2-D topologies (polygons) are also varying. Thus there is a tradeoff between high geometrical accuracy and low commission and omission errors. As evident, the best tradeoff is obtained after incorporating façades to the coarser building polygons. However, more visually appealing results are produced after introducing rectangular constraints to the rectilinear buildings.
4. OUTLOOK & CONCLUSIONS
In this paper, we have presented an automatic (parametric) approach that only utilized unstructured spaceborne TomoSAR point clouds from one viewing angle to reconstruct building footprints. The approach is modular and systematic. It allows a robust reconstruction of both tall and low buildings, and hence is well suited for monitoring of larger urban areas from space. Moreover, the approach is completely data driven and imposes no restrictions on the shape of the building i.e., any arbitrarily
shaped footprint could be reconstructed. Also, the approach utilizes roof points in determining the complete shape of the buildings and therefore resolves problems, as mentioned in (Shahzad and Zhu, 2015a), related to the visibility of the façades mainly pointing towards the azimuth direction of the SAR sensor. However, few points still need to be addressed. For instance, the reconstruction accuracy is restricted due to less number of available points and data gaps in the TomoSAR point cloud. This could be improved by incorporating data from other viewing angles and/or adding more constraints such as parallelism or using a model based approaches based on a library of low level feature sets. Also, we have compared our results to the OSM data which is regularly updated but not yet fully complete. Therefore, a more accurate ground truth would be needed for assessing the exact performance of the approach. Nevertheless, this paper presents the first demonstration of automatic reconstruction of 2-D/3-D building footprints from this class of data. Moreover, the developed methods are not strictly applicable to TomoSAR point clouds only but are also applicable to work on unstructured 3-D point clouds generated from a different sensor with similar configuration (i.e., oblique geometry) with both low and high point densities. In the future, we will explore the potential of extending the algorithm towards generation of automatically reconstructed complete watertight prismatic (or polyhedral) 3-D/4-D building models from space.
REFERENCES
D’Hondt, O., Guillaso, S., Hellwich, O., 2013. Geometric primitive
extraction for 3D reconstruction of urban areas from tomographic SAR data, Joint Urban Remote Sensing Event (JURSE), Sao Paolo, Brazil, pp. 206–209.
Dorninger, P., Pfeifer, N., 2008. A Comprehensive Automated 3D Approach for Building Extraction, Reconstruction, and Regularization from Airborne Laser Scanning Point Clouds. Sensors, 8(11), pp. 7323– 7343.
Edelsbrunner, H., Mücke, E.P., 1994. Three-dimensional Alpha Shapes.
ACM Transactions on Graphics (TOG), 13(1), pp. 43–72.
Ester, M., Kriegel, H.-P., Sander, J., Xu, X., 1996. A density-based algorithm for discovering clusters in large spatial databases with noise.
International Conference on Knowledge Discovery and Data Mining
(KDD), Portland, USA, pp. 226–231.
Fornaro, G., Pauciullo, A., Reale, D., Verde, S., 2014. Multilook SAR Tomography for 3-D Reconstruction and Monitoring of Single Structures Applied to COSMO-SKYMED Data. IEEE Journal of Selected Topics in Applied Earth Observations and Remote Sensing
(JSTARS), 7(7), pp. 2776–2785.
GEOFABRIK [online]. http://www.geofabrik.de/data/download.html (accessed 04.07.15).
Shahzad, M., Zhu, X.X., 2015a. Robust Reconstruction of Building Facades for Large Areas Using Spaceborne TomoSAR Point Clouds.
IEEE Transactions on Geoscience and Remote Sensing (TGRS), 53(2),
pp. 752–769.
Shahzad, M., Zhu, X.X., 2015b. Detection Of Buildings In Spaceborne TomoSAR Point Clouds Via Hybrid Region Growing And Energy Minimization Technique. Joint Urban Remote Sensing Event (JURSE), Lausaane, Switzerland, pp. 1-4.
Zhang, K., Yan, J., Chen, S.-C., 2006. Automatic construction of building footprints from airborne LIDAR data. IEEE Transactions on
Geoscience and Remote Sensing (TGRS), 44(9), pp. 2523–2533.
Zhu, X.X., Bamler, R., 2012. Super-Resolution Power and Robustness of Compressive Sensing for Spectral Estimation With Application to Spaceborne Tomographic SAR. IEEE Transactions on Geoscience and
Remote Sensing (TGRS), 50(1), pp. 247–258.
Zhu, X.X., Shahzad, M., 2014. Facade Reconstruction Using Multiview Spaceborne TomoSAR Point Clouds. IEEE Transactions on
Geoscience and Remote Sensing (TGRS), 52(6), pp. 3541–3552.
Zhu, X.X., Wang, Y., Gernhardt, S., Bamler, R., 2013.
Tomo-GENESIS: DLR’s tomographic SAR processing system, Joint Urban
Remote Sensing Event (JURSE), pp. 159-162.
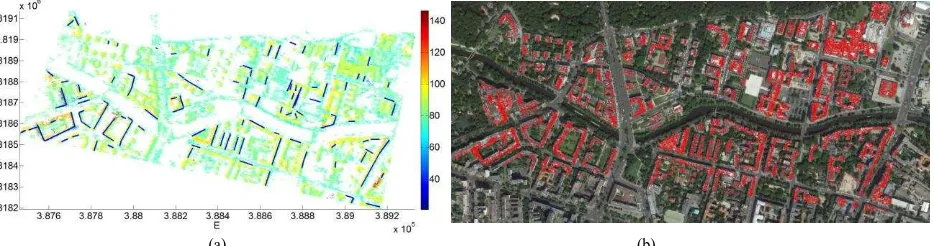
(a) (b)
Figure 2: Results of building extraction: (a) Top view of the TomoSAR points in UTM coordinates of the area of interest in Berlin, Germany. Blue lines depict the reconstructed façade segments (longer than 10 meters). Height of TomoSAR points is color-coded
[unit: m]; (b) Extracted building points using approach presented in (Shahzad and Zhu, 2015b) overlaid onto optical image © Google.
(a)
(b)
(c)
(d)
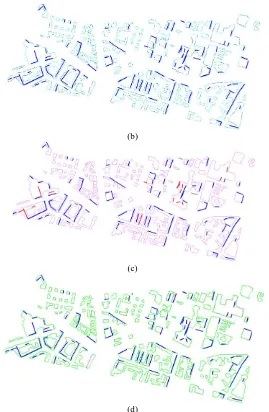
Figure 3: Footprint reconstruction results: (a) Clustered (or segmented) building points. Black polygons Valphasurrounding
individual segmented building points are the initial coarse boundary/outline obtained using alpha shapes algorithm; (b) Refined (cyan) polygons Vrefinedobtained after applying recursive angular deviation approach together with 2-D reconstructed façades
depicted in blue are overlaid onto alpha shape polygons Valpha; (c) Façades are then incorporated to the refined polygons from (b)
depicted in magenta color, symbolized as Vfacadefused. Façades either identified as P
or having condition C1 in not satisfied depicted
in red while façades not associated to any building polygon (i.e., case 1) are depicted in gray. Both red and gray façades are not utilized during the Façade-Polygon fusion process; (d) Final rectilinearized polygons Vfinalobtained after adding rectilinear
constraints.
Figure 4: Common (left) and difference (right) images computed using reference footprint image and final reconstructed footprints. The difference image is computed by subtracting the final reconstructed footprints image from the reference footprints
image.