SPATIAL RESOLUTION EFFECTS OF DIGITAL TERRAIN MODELS ON LANDSLIDE
SUSCEPTIBILITY ANALYSIS
K. T. Chang a, *, J. Doub, Y. Changc, C. P. Kuo a, K. M. Xu a, J. K. Liu d
a Dept. of Civil Eng. and Environmental Informatics, Ming Hsin University of Science and Technology, Hsinchu County 30401, Taiwan, [email protected]
b Center for Spatial Information Science, The University of Tokyo, Kashiwa 277-8568, Japan, [email protected] c Institute of Ocean Technology and Marine Affairs, National Cheng Kung University, Tainan 701 Taiwan,
d LIDAR Technology Co., Hsinchu County 30274, Taiwan, [email protected]
Commission VIII, WG VIII/1
ABSTRACT:
The purposes of this study are to identify the maximum number of correlated factors for landslide susceptibility mapping and to evaluate landslide susceptibility at Sihjhong river catchment in the southern Taiwan, integrating two techniques, namely certainty factor (CF) and artificial neural network (ANN). The landslide inventory data of the Central Geological Survey (CGS, MOEA) in 2004-2014 and two digital elevation model (DEM) datasets including a 5-meter LiDAR DEM and a 30-meter Aster DEM were prepared. We collected thirteen possible landslide-conditioning factors. Considering the multi-collinearity and factor redundancy, we applied the CF approach to optimize these thirteen conditioning factors. We hypothesize that if the CF values of the thematic factor layers are positive, it implies that these conditioning factors have a positive relationship with the landslide occurrence. Therefore, based on this assumption and positive CF values, seven conditioning factors including slope angle, slope aspect, elevation, terrain roughness index (TRI), terrain position index (TPI), total curvature, and lithology have been selected for further analysis. The results showed that the optimized-factors model provides a better accuracy for predicting landslide susceptibility in the study area. In conclusion, the optimized-factors model is suggested for selecting relative factors of landslide occurrence.KEY WORDS: Landslide, Susceptibility analysis, Certainty factor, Artificial neural networks, Remote sensing
* Corresponding author
1.
INTRODUCTION
Landslide susceptibility is defined as the likelihood of a landslide occurring in an area based on local terrain
conditions. It delineates the earth’s surface into zones of
varying degrees of stability based on the evaluated significance of the conditioning factors inducing instability (Gökceoglu and Aksoy, 1996). Landslide susceptibility mapping (LSM) plays an important role in hazard mitigation and is an important basis for providing a measure aimed at decreasing the risks associated with landslides (Dou et al., 2014). This involves not only finding where the risk of landslide-related problems is spatially located, but also quantitatively and qualitatively assessing the significance of any such hazards and associated risk factors. Furthermore, LSM could be employed to describe known landslides, assist with emergency decisions, and avoid and mitigate future landslide hazards. Moreover, LSM employs handling, processing, and storing an enormous amount of territorial data related to geographical information systems (GIS). GIS has also proved to be a powerful tool in landslide susceptibility evaluation (Nefeslioglu et al., 2013). In recent years, landslide susceptibility assessment has attracted the attention of many scholars, and numerous
studies have been undertaken for LSM assessment around the world (Aksoy and Ercanoglu, 2012; Feizizadeh et al., 2014; Park et al., 2012; Tien Bui et al., 2012). A majority of the research has been based on establishing the relationship between the landslide-conditioning factors and landslide occurrence through spatial data analysis. These relationships can be characterized in terms of ratings or weight. In this context, Chauhan et al. (2010) and Li et al. (2012) studies classified the data driven approaches into two general categories: qualitative and quantitative. Qualitative methods are rather subjective. Conversely, quantitative methods are objective and with the development of computer systems and GIS technologies, have become more popular than the qualitative methods (Pourghasemi et al., 2013; Sumer and Turker, 2013; Tien Bui et al., 2012). Quantitative methods including an artificial neural network (ANN) are useful for problem solving and have been successfully applied in various scientific, engineering, and hazard evaluation applications.
The purposes of this study are to identify the maximum number of correlated factors for landslide susceptibility mapping and to evaluate landslide susceptibility at Sihjhong river catchment in the southern Taiwan, The International Archives of the Photogrammetry, Remote Sensing and Spatial Information Sciences, Volume XLI-B8, 2016
XXIII ISPRS Congress, 12–19 July 2016, Prague, Czech Republic
This contribution has been peer-reviewed.
integrating two techniques, namely certainty factor (CF) and artificial neural network (ANN).
2. METHODOLOGY
2.1 Certainty factor model
The certainty factor (CF) is a method for managing uncertainty in rule-based systems and has been widely applied in expert system shell fields, in addition to medical diagnosis studies (Pourghasemi et al., 2013; Devkota et al., 2013). The CF approach is one of the probable favorability functions (FF) to address the problem of integrating heterogeneous data (Chung and Fabbri, 1993). The general theory function is given by the following equation: number of landslide events occur in class a and PPsis the prior probability of having a total number of landslide events in the study area. The value of PPs in this study is calculated to be 0.0146.
The CF value range is [-1, 1]. Positive values imply an increasing certainty in landslide occurrence; negative values infer a decrease in the certainty. A value close to zero indicates that the prior probability is close to the conditional probability and it is therefore difficult to determine the certainty of landslide occurrence (Pourghasemi et al., 2012). The preparations of the data layers and their selection for the analysis were performed with the ArcGIS v.10.2 software in this study. The
favorability values are obtained by overlaying the landslide inventory map and each data layer and computing the landslide frequency.
2.2 Data pre-processing for each factor
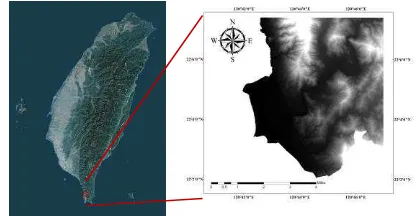
The conditioning-factor selection in this study is based on the previous literatures regarding spatial relationships between landslide occurrence and conditioning factors including topography, hydrology, geology, tectonics, and geomorphology (Kayastha et al., 2013; Klimes, 2013). A total of thirteen landslide-conditioning factors were chosen for this study, namely: 1) elevation, 2) slope angle, 3) slope aspect, 4) total curvature, 5) plan curvature, 6) profile curvature, 7) terrain position index (TPI), 8) terrain roughness index (TRI), 9) distance from road, 10) distance from drainage networks, 11) rainfall, 12) normalized DSM, and 13) lithology. All these factors are processed and investigated with the help of ArcGIS v10 from flooding. The Hengchun Peninsula is one of the key domestic sea-land conservation area, where is rich in ecological resources. The study area is shown in Figure 1. Two kinds of DTMs are used in this study, including 5 m of LiDAR DTM and 30 m of Aster GDEM.
Figure 1. The study area is located in the south of Taiwan
3.2 Test results
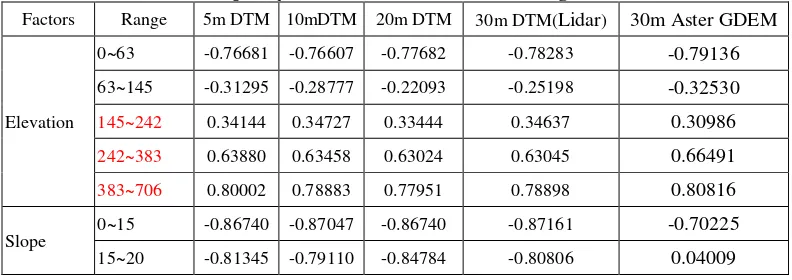
The CF model can provide a measure of certainty in predicting landslides. The relationship between the spatial landslide locations and eight topographic-conditioning factors were analysed in GIS. The CF values of each of the selected factors are shown in Table 1. The CF values indicate that different spatial resolution of terrain data will not affect the LSM analysis except for the effects on the curvature factors, including total, profile, and plan curvature. It shows that results of a DTM with lower spatial resolution is unable to render more detailed topographic curvature. Moreover, higher CF values of
“elevation”, “slope”, “TRI”, and “TPI” factors were
derived in the experimental area. With respect to the aspect factor, most of the landslides occurred along the southeast, south, and east facing slopes.
According to the results of two kinds of different data quality of DTMs, a negative CF values had been derived on slope with 20-30, aspect with southwest facing, and
“TRI” factor with 2-5 using 30m Aster DTM. These are
different from those derived from LiDAR DTM of 30m grid.
4. CONCLUSIONS
Different spatial resolution and quality of DTMs affecting on the LSM analysis had been compared in this work. The CF values indicate that different spatial resolution of terrain data will not affect the LSM analysis except for the effects on the curvature factors, including total, profile, and plan curvatures. Moreover, higher CF
values on “elevation”, “slope”, “TRI”, and “TPI” factors
The International Archives of the Photogrammetry, Remote Sensing and Spatial Information Sciences, Volume XLI-B8, 2016 XXIII ISPRS Congress, 12–19 July 2016, Prague, Czech Republic
This contribution has been peer-reviewed.
are derived in the experimental area. With respect to the aspect factor, most of the landslides occurred along the southeast, south, and east facing slopes. Moreover, bad quality of DTM (e.g. Aster DTM) will generate wrong results in the LSM analysis. A further study for producing landslide susceptibility map and for comparison will be conducted on the artificial intelligence-ANN model, namely the feedforward back-propagation neural network (FBPNN).
5. ACKNOWLEDGMENTS
This paper is a part of results granted by the Ministry of Science and Technology in Taiwan (Grant no. NSC 102-2621-M-006 -002 -MY3).
6. REFERENCES
Aksoy, B., Ercanoglu, M., 2012. Landslide identification and classification by object-based image analysis and fuzzy logic: An example from the Azdavay region (Kastamonu, Turkey). Comput. Geosci. 38, 87–98. Ayalew, L., Yamagishi, H., Marui, H., Kanno, T., 2005. Landslides in Sado Island of Japan: Part I. Case studies, monitoring techniques and environmental considerations. Eng. Geol. 81, 419–431.
Chung, C.-J., Fabbri, A.G., 1993. The representation of geoscience information for data integration.
Nonrenewable Resour. 2, 122–139.
Conforti, M., Pascale, S., Robustelli, G., Sdao, F., 2014. Evaluation of prediction capability of the artificial neural networks for mapping landslide susceptibility in the Turbolo River catchment (northern Calabria, Italy). Catena 113, 236–250.
Devkota, K.C., Regmi, A.D., Pourghasemi, H.R., Yoshida, K., Pradhan, B., Ryu, I.C., Dhital, M.R., Althuwaynee, O.F., 2013. Landslide susceptibility mapping using certainty factor, index of entropy and logistic regression models in GIS and their comparison at Mugling-Narayanghat road section in Nepal Himalaya. Nat. Hazards 65, 135–165.
Dou, J., Oguchi, T., Hayakawa, Y.S., Uchiyama, S., Saito, H., Paudel, U., 2014. GIS-Based Landslide Susceptibility Mapping Using a Certainty Factor Model and Its
Validation in the Chuetsu Area, Central Japan, in:
Landslide Science for a Safer Geoenvironment. pp. 419– 424n.
Feizizadeh, B., Jankowski, P., Blaschke, T., 2014. A GIS based spatially-explicit sensitivity and uncertainty analysis approach for multi-criteria decision analysis. Comput. Geosci. 64, 81–95.
Kanungo, D.P., Sarkar, S., Sharma, S., 2011. Combining neural network with fuzzy, certainty factor and likelihood ratio concepts for spatial prediction of landslides. Nat. Hazards 59, 1491–1512.
Kayastha, P., Dhital, M.R., De Smedt, F., 2013.
Application of the analytical hierarchy process (AHP) for landslide susceptibility mapping: A case study from the Tinau watershed, west Nepal. Comput. Geosci. 52, 398– 408.
Klimes, J., 2013. Landslide temporal analysis and
susceptibility assessment as bases for landslide mitigation, Machu Picchu, Peru. Environ. Earth Sci. 70, 913–925. Li, Y., Chen, G., Tang, C., Zhou, G., Zheng, L., 2012. Rainfall and earthquake-induced landslide susceptibility assessment using GIS and Artificial Neural Network. Nat. Hazards Earth Syst. Sci. 12, 2719–2729.
Park, S., Choi, C., Kim, B., Kim, J., 2012. Landslide susceptibility mapping using frequency ratio, analytic hierarchy process, logistic regression, and artificial neural network methods at the Inje area, Korea. Environ. Earth Sci. 68, 1443–1464.
Pourghasemi, H., Pradhan, B., Gokceoglu, C., Moezzi, K.D., 2013. A comparative assessment of prediction capabilities of Dempster-Shafer and Weights-of-evidence models in landslide susceptibility mapping using GIS. Geomatics Nat. Hazards Risk.
Pourghasemi, H.R., Mohammady, M., Pradhan, B., 2012. Landslide susceptibility mapping using index of entropy and conditional probability models in GIS: Safarood Basin, Iran. Catena.
Sumer, E., Turker, M., 2013. An adaptive fuzzy-genetic algorithm approach for building detection using high-resolution satellite images. Comput. Environ. Urban Syst. 39, 48–62.
Tien Bui, D., Pradhan, B., Lofman, O., Revhaug, I., Dick, O.B., 2012. Landslide susceptibility assessment in the Hoa Binh province of Vietnam: A comparison of the Levenberg–Marquardt and Bayesian regularized neural networks. Geomorphology 171-172, 12–29.
Table 1. The quality and resolution of DEM affecting on the LSM
Factors Range 5m DTM 10mDTM 20m DTM 30m DTM(Lidar) 30m Aster GDEM
Elevation
0~63 -0.76681 -0.76607 -0.77682 -0.78283 -0.79136
63~145 -0.31295 -0.28777 -0.22093 -0.25198 -0.32530
145~242 0.34144 0.34727 0.33444 0.34637 0.30986
242~383 0.63880 0.63458 0.63024 0.63045 0.66491
383~706 0.80002 0.78883 0.77951 0.78898 0.80816
Slope
0~15 -0.86740 -0.87047 -0.86740 -0.87161 -0.70225
15~20 -0.81345 -0.79110 -0.84784 -0.80806 0.04009
The International Archives of the Photogrammetry, Remote Sensing and Spatial Information Sciences, Volume XLI-B8, 2016 XXIII ISPRS Congress, 12–19 July 2016, Prague, Czech Republic
This contribution has been peer-reviewed.
20~25 -0.67879 -0.66884 -0.59931 -0.50306 0.64386
25~30 -0.26218 -0.25030 -0.03308 -0.29625 0.79741
30~40 0.61798 0.62179 0.60671 0.62506 0.86618
40~78 0.89618 0.89499 0.89389 0.89171 0.90166
Aspect
0~66 -0.67060 -0.66815 -0.64747 -0.65661 -0.44741
66~128 0.47996 0.48502 0.48339 0.52461 0.35241
128~190 0.66238 0.66334 0.64605 0.63608 0.54525
190~247 0.16934 0.15971 0.10359 0.12364 -0.14558
247~302 -0.71751 -0.72313 -0.65499 -0.67178 -0.60544
302~360 -0.65167 -0.65179 -0.54910 -0.55427 -0.48542
TRI
0~1 -0.88076 -0.88496 -0.88634 -0.88788 -0.93204
1~2 -0.69920 -0.68230 -0.65135 -0.65367 -0.90086
2~3 0.49719 0.50311 0.50702 0.51824 -0.76826
3~4 0.85817 0.85750 0.85874 0.85238 -0.55387
4~5 0.92492 0.92372 0.92288 0.92162 -0.47539
5~19 0.93588 0.93604 0.92754 0.93432 0.55758
TPI
(-18)~(-2) 0.77820 0.78173 0.86185 0.87858 0.79170
(-2)~(-1) 0.68598 0.68903 0.73503 0.74269 0.28485
(-1)~0 -0.22458 -0.22008 -0.22113 -0.29064 -0.46747
0~1 0.12225 0.12780 0.08550 0.14908 -0.42025
1~2 0.75257 0.71613 0.72362 0.76775 0.28722
2~12 0.89649 0.88514 0.90083 0.87656 0.63366
Total curvature
<(-28) 0.76548 -1.00000 -1.00000 -1.00000 -1.00000
(-28)~(-12) 0.58277 -1.00000 -1.00000 -1.00000 -1.00000
(-12)~(-4) 0.07916 0.10299 0.08677 0.03416 0.89071
(-4)~0 -0.42809 -0.42777 -0.46844 -0.46784 -0.01283
0~8 0.08866 0.08465 0.05663 0.11869 0.01613
>8 0.60438 -1.00000 -1.00000 -1.00000 -1.00000
Profile curvature
<(-6) 0.56802 -1.00000 -1.00000 -1.00000 -1.00000
(-6)~(-2) 0.10123 0.07440 0.13713 0.11577 0.90976
(-2)~2 -0.26548 -0.26238 -0.33649 -0.28399 -0.00880
2~6 0.08601 0.10795 0.14215 -0.01887 0.65424
6~13 0.57463 -1.00000 -1.00000 -1.00000 -1.00000
>13 0.75527 -1.00000 -1.00000 -1.00000 -1.00000
Plan curvature
<(-14) 0.77361 -1.00000 -1.00000 -1.00000 -1.00000
(-14)~(-6) 0.60668 -1.00000 -1.00000 -1.00000 -1.00000
(-6)~0 -0.29944 -0.28897 -0.29291 -0.32648 -0.06632
0~6 0.27888 0.27974 0.24245 0.31800 0.07892
6~16 0.64462 -1.00000 -1.00000 -1.00000 -1.00000
>16 0.90741 -1.00000 -1.00000 -1.00000 -1.00000
The International Archives of the Photogrammetry, Remote Sensing and Spatial Information Sciences, Volume XLI-B8, 2016 XXIII ISPRS Congress, 12–19 July 2016, Prague, Czech Republic
This contribution has been peer-reviewed.