TERRASAR-X AND RAPIDEYE DATA FOR THE PARAMETERISATION OF
RELATIONAL CHARACTERISTICS OF URBAN ATKIS DLM OBJECTS
S. Hese, M. Lindner, M. Voltersen, C. Berger
a Friedrich-Schiller University Jena, Dept. of Geography, 07737 Jena, Germany - [email protected]
KEY WORDS: Urban land use, object-based image analysis, RapidEye, TerraSAR-X, ENVILAND-2, DLM
ABSTRACT:
This work presents a multi-sensor data analysis concept for the parameterisation of urban landuse in comparison to ATKIS DLM reference objects (digital landscape model). An object based top-down approach is implemented and the potential of multisensor data for a primary urban landcover object classification is assessed. Urban landuse structure is developed based on relational features applied to land cover objects and compared to an aggregated DLM class legend. For a better imperviousness description an advanced imperviousness measure – the build-up impervious intensity ratio is developed that takes building height and derived floor area (based on LiDAR data) and the amount of vegetation within a search radius to every building into account. The developed concept is parameterized with test areas in Rostock and transferability is investigated with data coverage in Cologne (Germany). The work is linked to the urban work package of the DLR funded ENVILAND-2 project that aims to develop operational concepts for the use of TerraSAR-X and Rapideye data in urban mapping scenarios.
1. INTRODUCTION
With the start of the two German satellite missions TerraSAR-X (2007) and RapidEye (2008), new opportunities for a wide range of remote sensing data applications unfolded. The synthetic aperture Radar (SAR) data provided by the TerraSAR-X mission are acquired at a spatial resolution of up to 1 m. RapidEye offers multispectal imagery at 6.5 m spatial resolution and in five multispectral bands. Amongst many other potential applications, the complementary nature of both satellite missions may be of particular interest to study different aspects of the urban environment.
The present work is part of the ENVILAND-2 research project (http://www.enviland-2.uni-jena.de/), which investigates the synergy between SAR and multispectral satellite data for ENVIronment and LAND use applications. The urban work package focuses on the combined analysis of TerraSAR-X and RapidEye data and is split into three main steps. In a first phase, mapping of urban land cover units by means of feature level fusion techniques is done. In the second phase an object-based analysis of urban land use structures is carried out by taking the spatial relations between individual elements of the urban land cover into account. Finally, the derived information is used to develop new spatial indicators relevant to support urban planning. Data from TerraSAR-X and RapidEye is used together with very high resolution (VHR) multispectral imagery, object height information obtained from airborne laser scanning (ALS) and different types of vector data.
This paper focuses on the development of a transferable, object-based rule set for the development of urban land use structures at block level and improved measures of imperviousness. The data basis used consists of RapidEye and TerraSAR-X imagery, as well as height information of a LiDAR nDSM (normalized Base Landscape Model). It describes topographic objects of the
landscape and includes information about position, shape and characteristic attributes of the mapped objects defined in the ATKIS object catalogue. These objects are differentiated by point, line and area objects. DLM information is available Germany-wide for every federal state. Regarding the data accuracy the DLM of Mecklenburg-Vorpommern refers to the topographic map TK 1:10000. Since 2004 data capture is based on high-resolution Digital Ortho Photos (DOP). Currently there are about 130 object types which characterize the landscape structure by their transportation network, waters and boundaries of f.e. residential, industrial, commercial and forest areas. The mapping date for the study area of Rostock relates to the year 2008.
Consistent mapping of impervious areas and housing density is required for various environmental parameters. Soil sealing can be described as the isolation of the Earth’s surface, primarily caused by anthropogenic influences (Burghardt, 2006). In Europe, about three quarters of the population live in cities and the sealed area takes up nine percent of the continent (Scalenghe and Ajmone-Marsan, 2009). Currently there is no reliable and consistent method for extensive mapping of impervious areas although the environmental consequences of soil sealing are important. By isolating the soil, its permeability, infiltration rate and groundwater level is reduced, additionally the surface runoff increases. The hydrological cycle is affected by impervious areas. Furthermore soil sealing has effects on energy and heat transfer between the soil and the atmosphere. Especially in urban areas periods of heat stress are known by a phenomena like the Urban Heat Island effect (Katzschneret al., 2009). Additionally the degree of compactness of the buildings (geometry, height, orientation) affects wind speed and ventilation within urban environments (Klysik and Fortuniak, 1999). Hence the urban microclimate is subject to the degree of soil sealing and urban imperviousness (but also building height and building density and orientation).
A decreasing land consumption and effective handling of soil as an important resource are some of the important tasks for city planners (Thuniget al., 2010).
International Archives of the Photogrammetry, Remote Sensing and Spatial Information Sciences, Volume XXXVIII-4/W19, 2011 ISPRS Hannover 2011 Workshop, 14-17 June 2011, Hannover, Germany
For that reason an advanced imperviousness intensity index was generated by combining object relational horizontal sealing attributes and vertical (3D) building structure indices. This imperviousness measure is also taking building height and neighbourhood object information into account and is therefore referred to as a “Build-up Intensity Metrics”.
2. DATA AND TESTSITE
The area of investigation is the city of Rostock in Germany. Rostock is located at the Baltic Sea. It has a total population of 200,000 inhabitants and comprises an area of about 180 km², which makes it the largest city in the federal state of Mecklenburg-Western Pomerania. Rostock is characterized by a large variety of urban land use categories including core areas, industrial and commercial sites, single and double family houses, row houses, allotment gardens and many other urban land use types.
The case studies presented in this paper are based on one or more of the following datasets: (1) a TerraSAR-X scene, (2) RapidEye imagery, (3) a normalized digital surface model (nDSM) and (4) the digital landscape model (DLM) for the city of Rostock. An overview of the TerraSAR-X and RapidEye data is given in Table 1. The TerraSAR-X dataset has been recorded in high resolution spotlight mode on June 8, 2010. Data pre-processing comprised radiometric calibration, multi-looking, geocoding and topographic normalization. Moreover, speckle filtering was applied to the SAR scene using the Enhanced Lee algorithm (Lopez et al., 1990) with a 3×3 kernel size. The effective resolution of the geocoded and despeckled multi-look intensity (MLI) image was 2 m. The multispectral RapidEye scene was collected over Rostock on June 6, 2010. After the selection of 24 well-distributed Ground Control Points (GCPs), the imagery was orthorectified with the help of a Digital Elevation Model (DEM) covering the area. Orthorectification resulted in a geocoded multispectral image with a geometric DSM in order to obtain a dataset with information on the height of objects relative to the ground (i.e., the nDSM). The DLM of Rostock is a vector dataset describing urban land use categories on a per-parcel basis. It is part of the official topographic cartographic information system (ATKIS) in Germany and is used in a modified form as a reference in the context of the classification of urban land use structures. As the last step of
preprocessing, all raster datasets were coregistered to digital ortho photos (DOPs) provided by the city of Rostock.
3. METHODS
3.1 Urban Land Use Structure
The classification of various land cover units forms the basis of this analysis. An object-based land cover classification is implemented that uses feature level fusion to combine the information of all available input datasets. Additionally to spectral information also shape and context image features are employed to characterize and extract specific land cover objects. The different land use structures are then determined by quantifying typical horizontal combinations and constellations of the extracted land cover classes and land cover proportions. Accuracy assessment is done by utilizing the available ATKIS information. Because of their detailed differentiation concerning the land use the existing DLM classes had to be harmonized. The DLM classes cemetery, grove, heath, park f.e. were aggregated to the land use structure class “green space” due to similarities of their definitions and their appearance.
A typical feature combination is explained exemplarily for the land use structure class “residential”. Three representative indicators for the prevalent land use are identified: single family houses, linear buildings and space enclosing building structures. All residential buildings are characterized by the land cover classes for dark or red roofs. Bright roofs are rare. Furthermore single-family houses usually have an approximately square shape and cover only a small area. Linear building types are characterized by a rectangular shape, a distinctive length to width ratio and a specific maximum area.
For the land cover classification the parametric Jeffries-Matusita distance is utilized as a separability measure. Buildings are characterized by low NDVI values and high mean object heights. For the differentiation of the various roof types the multispectral RapidEye data leads to the best results. However, the discrimination of red and dark roofs occurs with very poor separability. Figure 2 shows some of the employed features for the class differentiation of the three roof types and clarifies the feature values for the best separability or the least overlap. Water and shadows are differentiated using additionally TerraSAR-X coherence (VV) based statistics assuming that the water surface is not dominated by larger waves. Water is therefore classified by its surface shape characteristics and not using spectral properties. We accept that this could be a disadvantage for the transferability of the concept and for the overall robustness.
Tab. 1 Characteristics of the TerraSAR-X (left) and RapidEye data (right).
TerraSAR-X RapidEye
Acquisition date 2010-06-08 Acquisition date 2010-06-06
Acquisition mode HR Spotlight Cloud cover 0 %
Incidence angle 44 ° Incidence angle 10.6 °
Effective res. 2 m (MLI) Geometric res. 6.5 m (orthorectified)
Radiometric res. 32 bit float Radiometric res. 16 bit unsigned
Frequency X-band (9.6 GHz) Spectral bands
Wavelength 3 cm Blue 440–510 nm
Polarization (mode) HH, VV (dual) Green 520–590 nm
Pass direction Descending Red 630–685 nm
Looking direction Right Red Edge 690–730 nm
Scene extent 5×10 km Near Infrared 760–850 nm
International Archives of the Photogrammetry, Remote Sensing and Spatial Information Sciences, Volume XXXVIII-4/W19, 2011 ISPRS Hannover 2011 Workshop, 14-17 June 2011, Hannover, Germany
Fig. 2: Utilized features for class assignment of the various roof types
For the classification of land use classes: shape, area and image object context features are used. Single-family houses are characterized by high values for the feature density.
Furthermore the object area has to be between 100 and 400 m² and the relative area of the roof type sub objects represents almost completely red or dark roofs. Linear buildings objects are determined by using a rectangular fit, width and
length/width approximation. The rectangular fit shows high
values, the width is limited between 12 m and 30 m and the object length must not exceed six times of the width. Additionally the object area has to be below 1500 m² and the relative area of the roof type sub objects represents almost completely red or dark roofs as well.
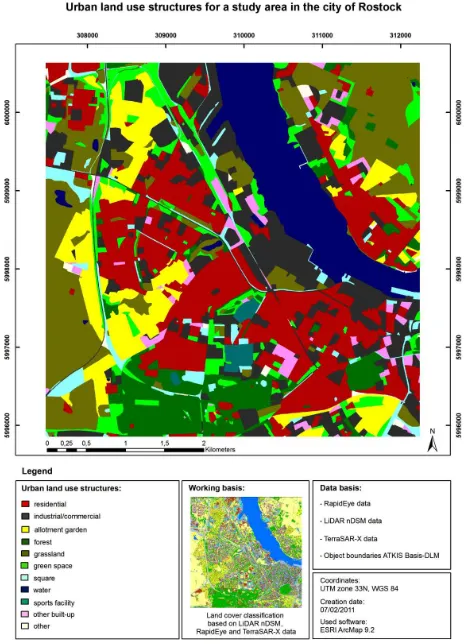
Making use of ATKIS objects in this analysis the number and proportion of the land cover classes found are used to derive the residential land use structures. Generally for all residential land use structures at least 20 % of each ATKIS object has to be classified as vegetation land cover. Furthermore every ATKIS object and each classified building object needs a certain proportion of red or dark roofs, which are considered as potential residential buildings. For single family houses and linear buildings every ATKIS object requires more than 2 land use indicator objects in each case for the assignment to a residential land use structure. Figure 3 shows the classification result for all derived land use structure classes. An overall accuracy of 63.2 % is achieved. 84 % of the residential class objects in the reference are correctly classified (producer’s accuracy). However, in the classification result the residential class is overestimated. Most of the classification errors are due to the lack of appropriate land cover features to sufficiently describe the landuse structure class.
Fig. 3: Urban land use structure classification for a study area in the city of Rostock
International Archives of the Photogrammetry, Remote Sensing and Spatial Information Sciences, Volume XXXVIII-4/W19, 2011 ISPRS Hannover 2011 Workshop, 14-17 June 2011, Hannover, Germany
3.2 Impervious Build-Up Intensity Mapping
For the assessment of growth dynamics and climatic characteristics there is a need not only to map impervious areas but to quantify the urban build-up intensity. In this work this is done by connecting an object-relational horizontal impervious attribute and vertical building structure information to generate a build-up intensity index.
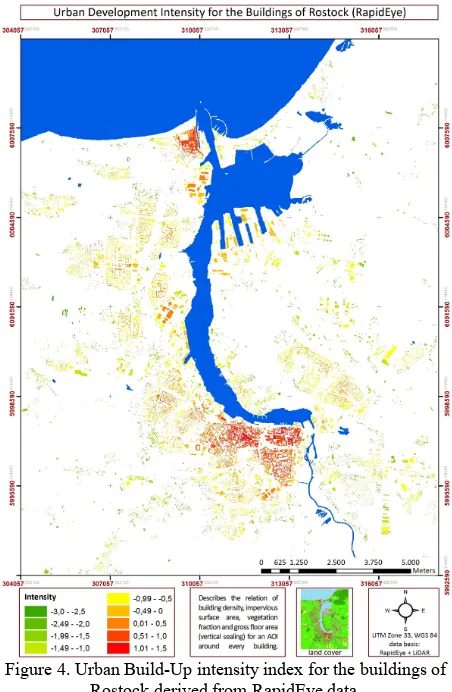
A pan-sharpened QuickBird image together with a Normalized Digital Surface Model generated by LiDAR data is used to derive landcover information for the city of Rostock (Germany) based on an object-based classification. After correcting the classified impervious areas for street tree crown shadowing (which corrects the underestimation of imperviousness in urban areas), the index was created by combining building density, sealing degree, vegetation fraction and vertical gross sealing of every building (Figure 4). Building density is calculated by: 1.: building coverage area, 2. distance and number of buildings, 3. mean vertical gross sealing. The latter (3.) is described by the ratio of the footprint and the gross floor area value for every building.
The developed concept is than tested with RapidEye data with a lower spatial resolution. Some minor rule set adaptations were necessary to generate satisfying classification results, mainly with regard to brightness and NDVI values.
Figure 4. Urban Build-Up intensity index for the buildings of Rostock derived from RapidEye data.
As shown in Figure 4 the build-up intensity metrics of Rostock varies from low values for buildings in the surrounding regions to sealed areas such as the city centre. The lowest intensity values ranging from -2.5 to -1 appear within allotment areas because of their large vegetation fraction, sparsely impervious surface areas and very low gross sealing. Slightly higher values
are derived for single-family house settlements. Apartment complexes show mean build-up intensities of about -0.6 caused by high gross floor areas associated with low building densities. The highest build-up intensity values up to 1.3 are generated for industrial areas and particularly for the city centre.
4. CONCLUSIONS
The study presented in this work developed a concept to derive urban landuse structure and advanced metrics to quantify imperviousness/3D-build-up based on satellite data and ALS data. The use of ATKIS DLM information showed that Earth observation based quantification of urban landuse is not necessary comparable with the DLM information. There is however clearly a potential to derive functional properties from the structure and system of landcover objects with the aid of spatial very high resolution data. Urban object neighbourhood and density measures as well as form and shape parameterisations are important for a quantification of the urban landuse properties. TerraSAR-X was with its monotemporal data resolution in this study only used for water vers- shadow differentiation. Although spatial sharpening of RapidEye data with TerraSAR-X data was originally planned, the overall use of the TerraSAR-X data in this study was limited to selected features for better land cover class separability.
5. REFERENCES
Burghardt, W., 2006. Soil sealing and soil properties related to sealing. Geological Society, London, Special Publications 266, pp. 117-124.
Katzschner, L, Maas, A., Schneider, A., 2009. Das städtische Mikroklima: Analyse für die Stadt- und Gebäudeplanung.
Bauphysik, 31(1), pp. 18-24.
Klysik, K., Fortuniak, K., 1999. Temporal and spatial characteristics of the urban heat island of Lodz, Poland.
Atmospheric Environment, 33(24-25), pp. 3885-3895.
Lopes, A., R. Touzi & E. Nezry (1990): Adaptive speckle filters and scene heterogeneity. – IEEE Transactions on Geoscience and Remote Sensing 28, 6, 992–1000.
Scalenghe, R., Ajmone-Marsan, F., 2009. The anthropogenic sealing of soils in urban areas. Landscape and Urban Planning, 90(1), pp. 1-10.
Thunig, H., Wolf, N., Naumann, S., Siegmund, A., Jürgens, C., 2010. Automated LULC classification of VHR optical satellite data in the context of urban planning. Proc. of the GEOgraphic Object-Based Image Analysis conference, Ghent, June 29 – July 2.
6. ACKNOWLEDGEMENT
This work is partly based on RapidEye data provided by the RapidEye Science Archive (RESA) of DLR. Financial support was provided through the ENVILAND-2 project (DLR). International Archives of the Photogrammetry, Remote Sensing and Spatial Information Sciences, Volume XXXVIII-4/W19, 2011
ISPRS Hannover 2011 Workshop, 14-17 June 2011, Hannover, Germany