A CRITICAL REVIEW OF AUTOMATED PHOTOGRAMMETRIC
PROCESSING OF LARGE DATASETS
Fabio Remondino1, Erica Nocerino1, Isabella Toschi1, Fabio Menna1
1 3D Optical Metrology (3DOM) unit, Bruno Kessler Foundation (FBK), Trento, Italy <remondino><nocerino><toschi><fmenna>@fbk.eu, http://3dom.fbk.eu
Commission II
KEY WORDS: photogrammetry, automation, accuracy, precision, bundle adjustment, dense image matching, comparison ABSTRACT:
The paper reports some comparisons between commercial software able to automatically process image datasets for 3D reconstruction purposes. The main aspects investigated in the work are the capability to correctly orient large sets of image of complex environments, the metric quality of the results, replicability and redundancy. Different datasets are employed, each one featuring a diverse number of images, GSDs at cm and mm resolutions, and ground truth information to perform statistical analyses of the 3D results. A summary of (photogrammetric) terms is also provided, in order to provide rigorous terms of reference for comparisons and critical analyses.
1. INTRODUCTION
The availability of fully automated photogrammetric software allows just about anyone with a camera, even low-quality mobile phones (Tanskanen et al., 2013; Nocerino et al., 2017), to generate 3D models for various purposes. Researchers and practitioners employ nowadays photogrammetry as a valuable, powerful and cheap alternative to active sensors for textured 3D reconstruction of heritage scenarios, museum artefacts, cities, landscapes, consumer objects, etc. However, the majority of image-based users is often unaware of strengths and weaknesses of the used methodology and software, employing it much like a black-box where they can drop photographs in one end and retrieve a (hopefully) completed 3D models on the other end. Previous works (Kersten and Lindstaedt, 2012; Remondino et al., 2012; Gonizzi-Barsanti et al., 2014) demonstrated that automation in image-based methods is very efficient in most heritage projects, with great potentials, although some open research issues still exist (James and Robson, 2014; Nocerino et al., 2014; Menna et al., 2016; Cipriani and Fantini, 2017). The quality of automatically derived 3D point clouds or surface models is normally satisfactory although no standard quality analysis tools are generally implemented and used to evaluate the value of the achieved (3D) products. Moreover, not all software solutions allow a rigorous scaling & geo-referencing procedure and there is generally a lack of standard terms when reporting the results.
1.1 State-of-the-art in automated image-based 3D reconstruction
The image-based processing pipeline, based on the integration of photogrammetric and computer vision algorithms, has become in the last years a powerful and valuable approach for 3D reconstruction purposes. If in the beginning of 2000’s many researchers and users moved their attention and interest to laser scanning technologies, since few years an opposite trend is happening and the image-based approach is once again very commonly used. Indeed, it generally ensures sufficient automation, low cost, efficient results and ease of use, even for non-expert users. The recent progresses were achieved in all core components of the image-based processing pipeline: image pre-processing (Verhoeven et al., 2015), keypoints extraction (Hartmann et al., 2015), bundle adjustment (Schoenberger and Frahm, 2016) and dense points clouds generation (Remondino et
al., 2014). These progresses have led to fully automated methodologies (normally called Structure-from-Motion – SfM and Multi-View Stereo – MVS) able to process large image datasets and deliver 3D (both sparse and dense) results with a level of detail and precision variable according to the applications (Frahm et al., 2010; Crandall et al., 2013). Particularly in terrestrial and UAV applications, the level of automation is reaching very high standards and it is increasing the impression that few randomly acquired images - even found on the Internet (Heinly et al., 2015) – and a black-box tool are sufficient to produce a professional 3D point cloud or textured 3D model. However, when it comes to applications different from web visualization or quick 3D reconstructions, end-users are still missing a valuable solution for metric applications where results can be deeply analysed in terms of accuracy, precision and reliability. As a consequence, algorithms and methods could be understated or overrated and weakness in dataset could be missed.
1.2 The trend and risk
The ease of use of many commercial photogrammetric software allows any user to take some photographs, blindly load them into the package, push a button and enjoy the obtained 3D model. This is compelling, but dangerous. Without sufficient knowledge of the processes and the software being used, non-expert users can potentially invest greater confidence in the results of their work than may be warranted. Nowadays many conferences are filled with screenshots of photogrammetric models and cameras floating over a dense point cloud. Nonetheless object distortions and deformations, scaling problems and non-metric products are very commonly presented but not understood or investigated. Therefore it is imperative that users move beyond black-box approaches of photogrammetric (or SfM/MVS) tools and begin to understand the importance of acquisition principles, data processing algorithms and standard metrics to describe the quality of results and truly quantify the value of a 3D documentation. A proper understanding of the theoretical background of algorithms running in software applications is thus advisable in order to obtain reliable results and metric products. Leaving the black-box approach behind will ensure a better usability of the results, long-lasting quality data, transferability of the methodology and a better diffusion of 3D technologies in the heritage field.
1.3 Paper objectives
This paper wants to critically evaluate the performances of three commercial packages (Agisoft PhotoScan, Pix4D Pix4Dmapper Pro and Capturing Reality RealityCapture) commonly used in the heritage community for automated 3D reconstruction of scenes. Different large datasets are employed (Table 1), each one featuring a diverse number of images, varying GSDs and some ground truth information to perform statistical analyses of the results. The null hypothesis is assuming that given the same processing parameters (number of extracted keypoints, maximum reprojection error, same GCPs, etc.), each software would produce a very similar result without any significant variation from the others. However, since each software offers a slightly different set of parameters, different terminology as well as different approaches for the image orientation and dense matching procedures, there will be some variability between the different processing results. In the paper, we are not taking into
account the generation of a mesh or texturing, as the work assumes that the best measure of performances is the result of image orientation and dense matching procedures.
Due to a lack of output standards, it is generally difficult to present comparisons. However, in order to understand differences, strengths and weaknesses, we will focus on:
orientation results, in terms of number of oriented cameras, theoretical precision of object points, RMS on check points (CPs), redundancy/multiplicity of 3D points;
dense point clouds: as we are familiar with each of the datasets presented here, challenging areas known to be particularly problematic for photogrammetry are analysed. Although recent benchmarks and software evaluations exist (Nex et al., 2015; Aanæs et al., 2016; Knapitsch et al., 2017; Schoeps et al., 2017), the paper focuses on more complex environments, surveyed with different platforms / cameras and comparison metrics are given following a standard terminology (Luhmann et al., 2014; Granshaw, 2016).
Images Type of platform / camera Min-Max GSD Ground truth Metrics
DATASET 1 – Duomo square, Trento (Italy)
359 Terrestrial / Nikon D3X, 24 MPx, 36x24mm
CMOS sensor, 50mm and 35mm focal lengths 5 mm GCPs
BA statistics, RMSE on CPs, flatness error, cloud2cloud distance
DATASET 2 –Trento’s cathedral (Italy)
565 Terrestrial / Samsung Galaxy S6, 16 MPx, 5.84x3.28mm, 4 mm focal length 6 mm GCPs BA statistics, network geometry
DATASET 3 – Etruscan Sarcophagus (Italy)
514 Terrestrial / Nikon D3X, 24 MPx, 36x24mm CMOS sensor, 50mm focal length 0.12 mm Scale bars BA statistics, multiple runs
DATASET 4 – Neptune fountain, Bologna (Italy)
1484 Terrestrial / Nikon D5300, 24MPx, 23.5x15.6 mm APS-C sensor, 35 mm focal length 2.5 cm (max) 2 mm (min) Scaling distance BA statistics The International Archives of the Photogrammetry, Remote Sensing and Spatial Information Sciences, Volume XLII-2/W5, 2017
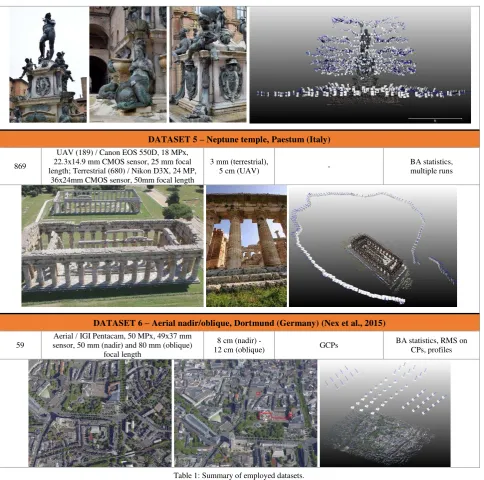
DATASET 5 – Neptune temple, Paestum (Italy)
869
UAV (189) / Canon EOS 550D, 18 MPx, 22.3x14.9 mm CMOS sensor, 25 mm focal length; Terrestrial (680) / Nikon D3X, 24 MP,
36x24mm CMOS sensor, 50mm focal length
3 mm (terrestrial),
5 cm (UAV) -
BA statistics, multiple runs
DATASET 6 – Aerial nadir/oblique, Dortmund (Germany) (Nex et al., 2015)
59
Aerial / IGI Pentacam, 50 MPx, 49x37 mm sensor, 50 mm (nadir) and 80 mm (oblique)
focal length
8 cm (nadir) -
12 cm (oblique) GCPs
BA statistics, RMS on CPs, profiles
Table 1: Summary of employed datasets.
2. ADOPTED TERMINOLOGY
The fusion of photogrammetric, computer vision and robotics methods has led from one side to open and commercial solutions able to automatically process large sets of unordered images but, from the other side, to a misused terminology and a lack of clear meanings and measures. Although standard terms and metrics do exist, they are not always properly employed by all software packages and researchers, making the comparison of processing methodology and the understanding of delivered results a not-trivial task. In the following we report the most common terms and metrics which should be used when processing image datasets and delivering 3D sparse or dense point cloud results. Bundle Adjustment (BA): “bundle” refers to the set of optical rays that, according to the collinearity condition (or central perspective camera model), connect each camera projection centre, the measured image point and corresponding 3D point in object space. Therefore, BA means to ‘arrange’ the bundle of optical rays departing from the images and pointing to the 3D
object points to iteratively, jointly and optimally reconstruct both the 3D scene and camera (interior and exterior) parameters. If interior (principal distance and principal point coordinates) and additional parameters (radial and tangential lens distortion, affinity and shear) are also estimated, it takes the name of self-calibrating bundle adjustment (Gruen and Beyer, 2001). Classically, the BA is formulated as a non-linear least squares problem (Triggs et al., 1999) with all unknowns simultaneously estimated. A least squares method minimizes an objective function, being the sum of the squared residuals of the available observations (i.e. reprojection error of the image measurements). For the collinearity model, the objective function is not independent from the model parameters and it is practical to use linear equations. Linearization implies that approximate values for all parameters are known and the most optimal values are computed in an iterative framework so that with each iteration the estimates are updated and hopefully closer to the real solution. Initial approximations of unknown parameters are normally computed with a subsequent concatenation of triangulation and resection (or DLT) procedures. The existing The International Archives of the Photogrammetry, Remote Sensing and Spatial Information Sciences, Volume XLII-2/W5, 2017
algorithms for finding a minimum of the objective function differ in how the structure and derivatives of this function are exploited (Nocedal and Wright, 2006). Within the photogrammetric community the most common BA solution is the iterative Netwon’s method (i.e. Gauss-Markov method) whereas in the computer vision community, Gauss-Newton or Levenberg-Marquadt are used (Triggs et al., 1999; Boerlin and Grussenmeyer, 2013). Popularity of the Newton-like methods lies in their fast convergence near the (absolute) minimum. The disadvantage is that the worse are the initial approximations of the unknowns, the more costly are the iterations and the less is the guarantee that a global minimum is reached.
Structure from motion (SfM): it is a procedure to simultaneously estimate both 3D scene’s geometry (structure) and camera pose (motion) (Ullman, 1979). If the camera is not pre-calibrated, calibration parameters can be simultaneously estimated as well (Szeliski, 2010). SfM entails two steps: a preliminary phase where 2D features are automatically detected and matched among images and then a bundle adjustment (BA) procedure to iteratively estimate all camera parameters and 3D coordinates of 2D features. The democratization of SfM started with the early self-calibrating metric reconstruction systems (Fitzgibbon and Zisserman, 1998; Pollefeys, 1999) which served as basis for the first systems on large and unordered Internet photo collections (Snavely et al., 2008) and urban scenes (Pollefeys et al., 2008). Inspired by these achievements, increasingly large scale reconstruction solutions were developed for thousands, millions and hundreds of millions images (Frahm et al., 2010; Agarwal et al., 2012; Heinly et al., 2015). A variety of SfM strategies were proposed, including incremental (Snavely et al., 2008; Agarwal et al., 2009; Wu, 2013; Schoenberger and Frahm, 2016), hierarchical (Gerardi et al., 2010; Cefalu et al., 2017) and global approaches (Crandall et al., 2013; Sweeney et al., 2015). Nowadays the incremental SfM is the most popular, starting with a small seed reconstruction, then growing by adding additional images/cameras and 3D points. Nevertheless, they have various drawbacks, such as repeatability, scalability, drifting, various non-estimated cameras and high computational costs (Remondino et al., 2012; Schoenberger and Frahm, 2016). Functions describing imaging errors: deviations from the ideal central perspective camera model, due to imaging errors, are normally expressed using correction functions for the measured image coordinates. The most common functions to model systematic errors in photogrammetry were presented in Brown (1976) and Beyer (1992), considering additional parameters to model the effects of radial and tangential distortion as well as affine errors in the image coordinate system. When an individual set of additional parameters is considered (and estimated within the self-calibrating bundle adjustment), the process is defined as ‘block-invariant’ self-calibration. If a set of parameters is assigned to each image, the bundle is called ‘photo-variant’ self-calibration (Moniwa, 1981). All available processing software applications include various variants of additional parameters but the values of these parameters are generally not directly comparable (Drap and Lefevre, 2016). Indeed, they may be normalized to the focal length value and in some cases are provided as correction values, in others as proper distortion parameters.
Residuals of image coordinates: also called reprojection error, it indicates the difference between the image observation values (i.e. measured coordinates of the matched 2D points in the images) and their computed values within the adjustment process. The reprojection error is thus the Euclidean distance between a manually or automatically measured image point and
the back-projected position of the corresponding 3D point in the same image. A 3D point generated only from 2 images, in an ideal case, has a reprojection error of zero. But in real processes it differs from zero due to noise in image measurements, inaccurate camera poses and unmodelled lens distortions. Nevertheless the reprojection error in image space is not an appropriate metric to evaluate the outcome of a BA, particularly when most of the 3D points are generated only from 2 images. Standard deviation, variance, mean and median: in statistics, the standard deviation is the square root of the variance, being the variance the mean of the squared deviations of a random variable x from its mean value µ. So, the variance measures the spread, or variability, of a set of (random) numbers from their
The median is the ‘middle’ value of a sample or population of numbers, separating it in two halves, one containing the higher values and one the lower.
Root Mean Square (RMS) and RMS Error (RMSE): while the RMS is the square root of the mean of the squared differences between the variable and its most probable value, the RMSE is computed with respect to a reference measurement, provided by an independent method. In particular, in this paper the following definitions are adopted: projected values of the computed 3D coordinated within the adjustment procedure. While indicates the variability of a variable around its mean value, the RMS provides a measure of how much the differences, i.e. the residuals, are in average far from zero. Theoretically, and RMS should coincide when the bias has been removed (Deakin and Kildea, 1999). RMSE computed on check points (CPs):
� � = √1� ∙ ∑ � �− � � The International Archives of the Photogrammetry, Remote Sensing and Spatial Information Sciences, Volume XLII-2/W5, 2017
where the subscript Comp indicates the coordinates estimated from the bundle adjustment whereas Ref indicates the reference values, i.e. the coordinates of check point measured with a reference surveying technique (e.g. GNSS).
Accuracy: it is the closeness of the result of a measurement, calculation or process to an independent, higher order reference value. It coincides with precision when measurements or samples have been filtered from gross errors, and only random errors are present. Usually, accuracy is widely used as a general term for quality (Luhmann et al., 2014; Granshaw, 2016). Typical procedures for determining accuracy include comparison with independent reference coordinates or reference lengths. The relative accuracy represents the achieved object measurement accuracy in relation to the maximum extent of the surveyed object.
Precision: it provides a quantitative measure of variability of results and is indicative of random errors, following a Gaussian or normal distribution (Granshaw, 2016). It is related to concepts like reproducibility and repeatability, i.e. the ability to reproduce to a certain extent the same result under unchanged conditions. In an adjustment process, it is calculated as a standard deviation and its estimate should always be provided with a coverage factor, e.g. 1 sigma (Luhmann et al., 2014).
Theoretical precision of object coordinates: it is the expected variability of estimated 3D object coordinates, resulting from the BA process and depending on the camera network (i.e. spatial distribution of the acquired images) and precision of image observations (i.e. quality of the image measurements). The precision is computed according to error propagation theory and it can be obtained from the BA covariance matrix. The theoretical precision would coincide with the accuracy of object coordinates if all the systematic errors are properly modelled.
Reliability: it provides a measure of how outliers (gross or systematic errors) can be detected and filtered out from a set of observations in an adjustment process. It depends on redundancy and network (images) configuration (Luhmann et al., 2014). Redundancy and multiplicity: from a formal point of view, redundancy, also known as degree of freedom, is the excess of observations (e.g. image points) with respect to the number of unknowns (e.g. 3D object coordinates) to be computed in an adjustment process (e.g. BA). For a given 3D point, the redundancy is related to the number of images where this point is visible / measured, commonly defined as multiplicity or number of intersecting optical rays. Normally, the higher the redundancy, and, consequently, the multiplicity, the better is the quality of the computed 3D point (assuming a good intersection angle). A 3D point generated only with 2 collinearity rays (multiplicity of 2 and redundancy of 1) is not contributing too much in the stability of the network and provided statistics.
Spatial resolution and ground sample distance (GSD): the spatial resolution is the smallest detail which can be seen in an image or measured by a system, i.e. it’s the smallest change in the quantity to be measured. The GSD is the projection of the camera pixel in the object space and is expressed in object space units. It can be seen as the smallest element that we can see and, ideally, reconstruct in 3D.
3. THE IMAGE PROCESSING PIPELINE
The tests performed in this research follow the typical photogrammetric workflow, consisting of the following steps. 3.1 Identification of image correspondences
Image correspondences (or tie points) are extracted relying on the most outperforming detector and (float or binary) descriptor algorithms (Miksik and Mikolajczyk, 2012: Apollonio et al., 2014): SIFT (Lowe, 2001) and all its variants (ASIFT, ColSIFT, PCA-SIFT, SIFT-GPU, DAISY, etc.), SURF (Bay et al., 2008), FAST (Rosten et al., 2010), BRIEF (Calonder et al., 2010), ORB (Rublee et al., 2011), LDAHash (Strecha et al. 2012), MSD (Tombari and Di Stefano, 2015), etc. Those (separated or combined) methods provide a set of keypoints coupled with a vector of information useful for the successive matching and tie point detection. The keypoint matching is normally performed with the brute force method based on the Hamming distance, a conventional L2-Norm matching strategy (Kullback and Leibler, 1951) or the efficient FLANN - Fast Library for Approximate Nearest Neighbours strategy (Muja and Lowe, 2009) which is independent from the image acquisition protocol and implements a fast search structure (e.g. based on kd-trees).
3.2 Unknowns estimation through BA
The extracted image correspondences (tie points) are used to estimate all unknown parameters (camera positions and angles, camera interior parameters, and 3D coordinates of image points) in a BA process. The Levenberg-Marquardt method has proven to be one of the most successful BA solution due to its ease of implementation and its use of an effective damping strategy that gives it the ability to converge quickly from a wide range of initial guesses (Lourakis and Argyros, 2009).
3.3 Dense image matching (DIM)
Once the camera poses and the sparse point cloud consisting in the 3D coordinates of triangulated tie points are recovered, a pixel-based matching algorithm (Rothermel et al., 2012; Furukawa and Ponce, 2010; Hirschmüller, 2008; Pierrot-Deseilligny and Paparoditis, 2006) is applied to obtain dense and colorized 3D point clouds. Stereo- or multi-view approach exist, relying on precise exterior and interior orientation parameters as well as epipolar images to constraint the search for matches (Remondino et al., 2014). Most of the approaches are based on the minimization of an energy function whose components are a cost function which considers the degree of the similarity among pixels and includes constraints to consider possible errors in the matching process as well as geometric discontinuity changes.
4. TESTS AND ANALYSES
For the sake of consistency, all datasets (Table 1) are processed using the same computer. In the datasets with available GCPs, in order to avoid multiple collimation errors, the image coordinates of the points are measured just once and then imported and used in the other packages. The tie point extraction phase is performed forcing the same number of extracted keypoints. In the self-calibration process, the same additional parameters are computed. In each test, the same image resolution is adopted for all the software applications in both the image correspondences extraction and DIM steps. All datasets employed in these tests are available to the community for further research purposes. The versions of the employed software are the following:
Agisoft Photoscan (PS): 1.3.1.4030
Pix4D Pix4D Mapper (Pix4D): 3.1.23
Capturing Reality RealityCapture (ReCap): 1.0.2.2600 It is worth mentioning that the tested version of ReCap does not provide access to the result of the DIM, being it fused with the meshing step. Therefore, the obtained 3D output corresponds to the vertices of the generated mesh model.
In the next tables report the results of the image orientations and, in two cases, for the DIM.
DATASET 1 - Duomo square (359 images)
PS Pix4D ReCap
# oriented img 359 359 359
comp. time 1h 10’ 41’ 3’ 15”
img space error 1.04 px 1 0.13 px 2 0.75 px 2
# 3D pts 597,985 1,508,105 797,1241 # pts in 2 img 215K (~36%) 880K (~53%) N/A # pts in 3 img 105K (~18%) 222K (~15%) N/A # pts in 4 img 80K (~14%) 109K (~7%) N/A
max multiplicity 69 (2) 70(9) N/A
RMSE CP
X/Y/Z [cm]
1.2/2.1/1.3 2.2/1.7/1.7 2.2/1.8/1.3
Comments:
the BA is carried out in free-network, i.e. without any prior knowledge or constraints. The RMS error on CPs is computed after a seven-parameter Helmert transformation to obtain the photogrammetric model in the coordinate system defined by the GCPs;
the significant processing speed of ReCap is clearly noticeable; despite a high value of max multiplicity, its value drops immediately after image pairs and this may cause instability effect in the network orientation;
very similar accuracy in object space is achieved.
DENSE POINT CLOUD AOI3-1
PS Pix4D ReCap
Plane fitting RMS
3.5 mm 5.3 mm 3.6 mm
Comments:
the AOI-1 is characterised by small geometric details (bricks); the three DIM outputs do not show grooves or indentations along the edges of the bricks, although showing a comparable plane fitting RMS;
the AOI-2 features a homogenous texture, which causes noisy DIM results and gaps in dense cloud;
the geometric details of AOI-3 are better provided by the all software solutions, even if ReCap seems to generate sharper results.
1 RMS of reprojection error 2 Mean reprojection error
DENSE POINT CLOUD AOI-2
PS Pix4D ReCap
Plane fitting RMSE
14.8 mm 49.9 mm 16.4 mm
DENSE POINT CLOUD AOI-3
PS Pix4D ReCap
DATASET 2 –Trento’s cathedral (565 images)
PS Pix4D ReCap
# oriented img 565 565 565
comp. time 37’ 2h 13’ 23’
image space error 1.51 px 1 0.42 px 2 0.41 px 2
# 3D pts 1,414,229 1,567,561 3,383,174 # pts in 2 img 1,093K (~77%) 971K (~62%) N/A # pts in 3 img 195K (~14%) 264K (~17%) N/A # pts in 4 img 58K (<5%) 119K (<10%) N/A
max multiplicity 49(1) 48(1) N/A
Comments:
although all images are oriented by the three software applications, Pix4D does not provide a correct solution for the circular network. An incorrect orientation is achieved even if the images are imported in different orders (Fig.1);
most of the 3D points are triangulated from only 2 views.
3 AOI stands for area of interest
Figure 1: Camera poses retrieved by Pix4D in various tests keeping the same processing settings and just changing the order of the images.
DATASET 3 – Sarcophagus (514 images)
PS Pix4D ReCap
First run
# oriented img 514 505 5/505/4
img space error 0.97 px 1 0.12 px 2 0.87 px 2
# 3D pts 1,421,553 2,033,545 782,435 # pts in 2 img 679K (~48%) 1,124K (~53%) N/A # pts in 3 img 271K (~19%) 350K (~17%) N/A # pts in 4 img 520K (~3%) 183K (<10%) N/A max multiplicity 85 (1) 71 (1) N/A
Second run (different image order)
# oriented img 514 506 4/12/8/6/19/
463 Third run (different image order)
# oriented img 514 505 5/5/8/4/4/4/4 /479
Comments:
ReCap is not able to process the entire dataset in a unique block and provides separate groups of images (“components”) oriented in different coordinate systems;
a low repeatability is visible by the number of oriented images in the various runs, where the order of the images was changed.
DATASET 4 - Neptune fountain (1484 images)
PS Pix4D ReCap
# oriented img 1484 1481 1482/2
img space error 1.06 px1 0.14 px 2 1.04 px 2
# 3D pts 4,872,847 9,223,627 1,590,574 # pts in 2 img 2,595K (~53%) 5,550K (~60%) N/A # pts in 3 img 931K (~19%) 1,600K (~17%) N/A # pts in 4 img 451K (~9%) 727K (<10%) N/A max multiplicity 149 (1) 137 (1) N/A
Comments:
despite the large overlap, most of the 3D points are determined only under two views, leading to noisy point clouds close to the statue edges/borders (Fig. 2).
Figure 2: The sparse point cloud (PS, Pix4D, ReCap, respectively) derived after the BA.
DATASET 5 – Neptune temple (857 images)
PS Pix4D ReCap
First run
# oriented img 857 439 679/189
img space error 0.78 px 1 0.11 px 2 0.69/0.79 px 2
# 3D pts 544,581 387,855 569,860/159,971 Second run (different image order)
# oriented img 857 470 16/120/542/177
Comments:
the combination of terrestrial and UAV images is not easily handled and the two sub-blocks are hardly completely oriented together.
the image shuffling is not facilitating the orientation of the entire datasets.
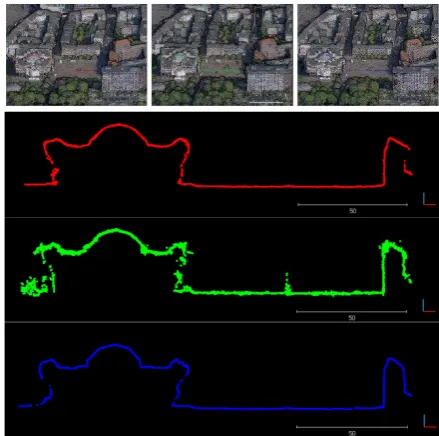
DATASET 6 – Dortmund (59 images)
PS Pix4D ReCap
# oriented img 59 59 59
RMSE CPs X/Y/Z [cm]
3.6/4.1/9.2 4.4/3.7/6.3 4.6/17.3/15.6
Comments:
The BA is constrained, i.e. the camera centres available from GNSS data and GCPs 3D coordinates are included in the processing. A user cannot assign the a-priori accuracy value to the GCPs coordinates in ReCap, where a worse accuracy in object space (higher RMSE on CPs) is observed.
The profiles extracted from the DIM outputs (Fig. 3) are smoother in PS and ReCap, and nosier in Pix4D. However, only Pix4D could partly reconstruct the small fountain in the square.
Figure 3: DIM results (PS, Pix4D, ReCap, respectively) on an AOI of the block (above). Three profiles of the dense point clouds (below).
5. CONCLUSIONS
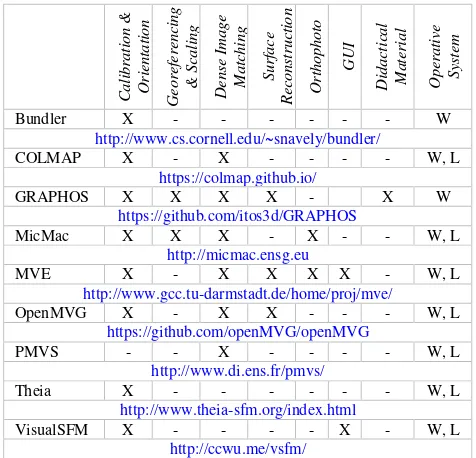
The paper presented a critical evaluation of commercial packages tested on complex (aerial and terrestrial) datasets acquired with various cameras/platforms. The analysed packages are getting very commonly used in the heritage (but not only) community where expertise and critical considerations are often overtaken by blind processing. The attained results (oriented images, computational times, accuracies, etc.) should encourage improvements in terms of reliability, repeatability and computational efficiency, notwithstanding the use of standard terminology to report the results. Although the paper has considered only commercial tools, an evaluation of available open source solutions (Table 2) will be performed soon. The paper’s aim is not to declare a winner, but the presented results and comments might provide useful suggestions and valuable insights to interested readers and users.
C
Table 2: Available open source packages for automated processing and 3D reconstruction from images. W=Microsoft Windows; L=Linux.
ACKNOWLEDGEMENTS
The authors are thankful to Marco Gaiani (University of Bologna, Italy) for sharing the Neptune dataset of Bologna and Matthew Vincent for performing some initial tests and providing heritage-oriented comments.
REFERENCES
Aanæs, H., Jensen, R.R., Vogiatzis, G., Tola, E., Dahl, A.B., 2016: Large-scale data for multiple-view stereopsis. Int. J. Computer Vision, Vol. 120(2), pp. 153-168
Agarwal, S., Snavely, N., Seitz, S., Szeliski, R., 2009: Bundle adjustment in the large. Proc. ECCV
Agarwal, S., Furukawa, Y., Snavely, N., Simon, I., Curless, B., Seitz, S.M., Szeliski, R., 2012: Building Rome in a day. Comm. ACM, Vol. 54(10), pp. 105-112
Bay, H., Ess, A., Tuytelaars, T., Van Gool, L., 2008: Speeded-Up Robust Features (SURF). Journal of Computer Vision and Image Understanding, Vol. 110(3), pp. 346-359
Beyer, H., 1992: Geometric and radiometric analysis of a CCD-based photogrammetric close-range system. PhD diss. no 9701, ETH Zurich
Brown, D.C., 1976: The bundle adjustment - progress and prospects. Int. Archives of Photogrammetry, Vol. 21(B3) Calonder, M., Lepetit, V., Strecha, C., Fua, P., 2010: BRIEF: binary robust independent elementary features. Proc. ECCV Cefalu, A., Haala, N., Fritsch, D., 2017: Hierarchical Structure from Motion combining global image orientation and structreless bundle adjustment. Int. Archives of Photogrammetry, Remote Sensing & Spatial Information Sciences, Vol. XLII-1/W1 Cipriani, L., Fantini, F., 2017: Digitalization culture vs archaeological visualization: integration of pipelines and open issues. Int. Archives of Photogrammetry, Remote Sensing & Spatial Information Sciences, Vol. XLII-2/W3
Crandall, D., Owens, A., Snavely, N., Huttenlocher, D.P., 2013: SfM with MRFs: discrete-continuous optimization for large-scale Structure from Motion. IEEE PAMI, Vol. 35(12), pp.
2841-2853
Deakin, R.E., Kildea, D.G., 1999: A note on standard deviation and RMS. Australian Surveyor, Vol. 44(1), pp.74-79
Drap, P., Lefevre, J., 2016: An exact formula for calculating inverse radial lens distortions. Sensors, Vol. 16(6)
Fitzgibbon, A., Zisserman, A., 1998: Automatic camera recovery for closed or open image sequences. Proc. ECCV
Frahm, J.M., Fite-Georgel, P., Gallup, D., Johnson, T., Raguram, R., Wu, C., Jen, Y.H., Dunn, E., Clipp, B., Lazebnik, S., 2010: Building Rome on a cloudless day. Proc. ECCV, pp. 368-381 Gherardi, G., Farenzena, M., Fusiello, A., 2010: Improving the efficiency of hierarchical structure-and-motion. Proc. CVPR Gonizzi-Barsanti, S., Remondino, F., Jiménez Fernández-Palacios, B., Visintini, D., 2014: Critical factors and guidelines for 3D surveying and modelling in Cultural Heritage. Int. Journal of Heritage in the Digital Era, Vol. 3(1), pp. 142-158
Granshaw, S.I., 2016: Photogrammetric terminology. The Photogrammetric Record, Vol. 31(154), pp.210-252
Gruen, A., Beyer, H., 2001: System calibration through self-calibration. In Gruen/Huang (Eds), Calibration and orientation of cameras in computer vision, Springer, Vol. 34, pp. 163-193 James, M.R., Robson, S., 2014. Mitigating systematic error in topographic models derived from UAV and ground-based image networks. Earth Surf. Processes Landforms, Vol. 39, pp. 1413-1420
Hartmann, W., Havlena, M., Schindler, K., 2015: Recent developments in large-scale tie-point matching. ISPRS Journal of Photogrammetry and Remote Sensing, Vol. 155, pp. 47-62 Heinly, J., Schonberger, J.L., Dunn, E., Frahm, J.-M., 2015: Re- constructing the World* in six days *(as captured by the Yahoo 100 million image dataset). Proc. CVPR
Hirschmuller, H., 2008: Stereo processing by semiglobal matching and mutual information. IEEE Transactions PAMI, Vol. 30(2), pp. 328-341
Kersten, T.P., Lindstaedt, M., 2012. Automatic 3D Object reconstruction from multiple images for architectural, cultural heritage and archaeological applications using open-source software and web services. Photogrammetrie - Fernerkundung - Geoinformation 2012, 727-740
Knapitsch, A., Park, J., Zhou, Q.Y., Koltun, V., 2017: Tanks and temples: benchmarking large-scale scene reconstruction. Proc. SIGGRAPH 2017
Lourakis, M.I.A., Argyros, A.A., 2009: SBA: a software package for generic sparse bundle adjustment. ACM Transactions on Mathematical Software, Vol. 36(1)
Lowe, D. G., 2001: Local feature view clustering for 3D object recognition. Proc. IEEE CVPR, pp. 682-688
Luhmann, T., Robson, S., Kyle, S., Boehm, J., 2014: Close-range photogrammetry and 3D imaging. Walter de Gruyter
Menna, F., Nocerino, E., Remondino, F., Dellepiane, M., Callieri, M., Scopigno, R., 2016: 3D digitization of a heritage masterpiece - a critical analysis on quality assessment. Int. Archives of Photogrammetry, Remote Sensing and Spatial Information Sciences, Vol. XLI-B5, pp. 675-683
Miksik, O., Mikolajczyk, K., 2012: Evaluation of local detectors and descriptors for fast feature matching. Proc. ICPR
Moniwa, H., 1981. The concept of “photo-variant” self-calibration and its application in block adjustment with bundles. Photogrammetria, 36(1), pp.11-29
Nex, F., Gerke, M., Remondino, F., Przybilla, H.-J., Bäumker, M., Zurhorst, A., 2015: ISPRS benchmark for multi-platform The International Archives of the Photogrammetry, Remote Sensing and Spatial Information Sciences, Volume XLII-2/W5, 2017
photogrammetry. ISPRS Annals of the Photogrammetry, Remote Sensing and Spatial Information Sciences, Vol. II-3/W4, pp. 135-142
Nocedal, J., Wright, S. J., 2006: Numerical Optimization. Springer Verlag
Nocerino, E., Menna, F., Remondino, F., 2014. Accuracy of typical photogrammetric networks in cultural heritage 3D modeling projects. Int. Archives of Photogrammetry, Remote Sensing & Spatial Information Sciences, Vol. XL-5, pp. 465-472 Nocerino, E., Lago, F., Morabito, D., Remondino, F., Porzi, L., Poiesi, F., Rota Bulo, S., Chippendale, P., Locher, A., Havlena, M., Van Gool, L., Eder, M., Fötschl, A., Hilsmann, A., Kausch, L., Eisert, P., 2017: A smartphone-based 3D pipeline for the creativity industry - the REPLICATE EU project. Int. Archives of Photogrammetry, Remote Sensing & Spatial Information Sciences, Vol. XLII-2-W3, pp. 535-541
Pierrot-Deseilligny M., Paparoditis N., 2006: A multiresolution and optimization-based image matching approach: An application to surface reconstruction from SPOT5-HRS stereo imagery. Int. Archives of Photogrammetry, Remote Sensing & Spatial Information Sciences, 36(1/W41), pp. 1-5
Pollefeys, M., 1999: Self-calibration and metric 3D reconstruction from uncalibrated image sequences. Ph.D. dissertation, ESAT-PSI, K.U. Leuven
Pollefeys, M., Nister, D., Frahm, J.-M., Akbarzadeh, A., Mordohai, P., Clipp, B., Engels, C., Gallup, D., Kim, S.-J., Merrell, P., et al., 2008: Detailed real-time urban 3d reconstruction from video. IJCV, Vol. 78(2), pp. 143-167 Remondino, F., Del Pizzo, S., Kersten, T.P., Troisi, S., 2012. Low-cost and open-source solutions for automated image orientation – A critical overview. LNCS Vol. 7616. pp. 40-54 Remondino, F., Menna, F., Koutsoudis, A., Chamzas, C., El-Hakim, S., 2013: Design and implement a reality-based 3D digitisation and modelling project. Proc. IEEE Conference "Digital Heritage 2013", Vol. 1, pp. 137-144
Remondino, F., Spera, M.G., Nocerino, E., Menna, F., Nex, F., 2014. State of the art in high density image matching. The Photogrammetric Record, Vol. 29, pp. 144-166
Rothermel, M., Wenzel, K., Fritsch, D., and Haala, N., 2012: SURE: Photogrammetric surface reconstruction from imagery. Low-Cost 3D Workshop, pp. 9 Berlin, Germany
Rublee, E., Rabaud, V., Konolige, K., Bradski, G., 2011: ORB: An efficient alternative to SIFT or SURF. Proc. ICCV
Schoenberger, J.-L., Frahm, J.-M., 2016: Structure-from-motion revisited. Proc. CVPR
Schoeps, T., Schoenberger, J.L., Galliani, S., Sattler, T., Schindler, K., Pollefeys, M., Geiger, A., 2017: A multi-view stereo benchmark with high-resolution images and multi-camera videos. Proc. CVPR.
Snavely, N., Seitz, S.M., Szeliski, R., 2008: Modeling the world from Internet photo collections. IJCV, Vol. 80(2), pp. 189-210 Strecha, C., Bronstein, A., Bronstein, M., Fua, P., 2012: LDAHash: improved matching with smaller descriptors. IEEE Transactions PAMI, Vol. 34(1)
Sweeney, C., Sattler, T., Hollerer, T., Turk, M., Pollefeys, M., 2015: Optimizing the viewing graph for structure-from-motion. Proc. CVPR
Szeliski, R., 2010. Computer vision: algorithms and applications. Springer Science & Business Media
Tanskanen, P., Kolev, K., Meier, L., Camposeco, F., Saurer, O., Pollefeys, M., 2013: Live metric 3D reconstruction on mobile phones. Proc. IEEE ICCV
Tombari, F., Di Stefano, L., 2015: The maximal self-dissimilarity Interest point detector. Transactions on Computer Vision and Applications, Vol. 7, pp. 175-188
Triggs, B., McLauchlan, P.F., Hartley, R.I. and Fitzgibbon, A.W., 1999: Bundle adjustment—a modern synthesis. Int. Workshop on Vision Algorithms, pp. 298-372, Springer Berlin Heidelberg
Ullman, S., 1979: The interpretation of structure from motion. Proc. Royal Society of London B: Biological Sciences, Vol. 203(1153), pp. 405-426
Verhoeven, G., Karel, W., Stuhec, S., Doneus, M., Trinks, I. and Pfeifer, N., 2015: Mind your grey tones - examining the influence of decolourization methods on interest point extraction and matching for architectural image-based modelling. Int. Archives of Photogrammetry, Remote Sensing & Spatial Information Sciences, Vol. 40(5/W4), pp. 307–314
Wu, C., 2013: Towards linear-time incremental structure from motion. Proc. 3DV