LANDSAT-8 OPERATIONAL LAND IMAGER CHANGE DETECTION ANALYSIS
W. Pervez a , S. A. Khan b, Ejaz Hussain c, Faisal Amir d, M.A. Maud e
a
National University of Sciences and Technology Islamabad, Pakistan - [email protected] b
National University of Sciences and Technology Islamabad, Pakistan - [email protected] c
National University of Sciences and Technology Islamabad, Pakistan- [email protected] d
National University of Sciences and Technology Islamabad, Pakistan- [email protected] e
National University of Sciences and Technology Islamabad, Pakistan- [email protected]
Commission VI, WG VI/4
KEY WORDS: Change Detection Analysis, Satellite Image Processing, Remote Sensing, Imaging Sciences, Operational Land Imager
ABSTRACT:
This paper investigated the potential utility of Landsat-8 Operational Land Imager (OLI) for change detection analysis and mapping application because of its superior technical design to previous Landsat series. The OLI SVM classified data was successfully classified with regard to all six test classes (i.e., bare land, built-up land, mixed trees, bushes, dam water and channel water). OLI support vector machine (SVM) classified data for the four seasons (i.e., spring, autumn, winter, and summer) was used to change detection results of six cases: (1) winter to spring which resulted reduction in dam water mapping and increases of bushes; (2) winter to summer which resulted reduction in dam water mapping and increase of vegetation; (3) winter to autumn which resulted increase in dam water mapping; (4) spring to summer which resulted reduction of vegetation and shallow water; (5) spring to autumn which resulted decrease of vegetation; and (6) summer to autumn which resulted increase of bushes and vegetation . OLI SVM classified data resulted higher overall accuracy and kappa coefficient and thus found suitable for change detection analysis.
1. INTRODUCTION
Change detection is of challenging problem. Remote sensing is used for planning at local and regional level. Remote sensing provides the efficient and cheaper means of spatial and temporal classification of inland water studies (Gardelle et al., 2010; Prigent et al., 2012; Zhang et al., 2015). Landsat-8 Operational Land Imager; OLI superior design is useful for mapping application as compared to previous Landsat series (Irons J. R., Dwyer J. L. Barsi, J. A., 2012; Markham, B. L. et al., 2010; Pehlevan, N., Schott, J. R., 2011; U.S Geological Survey, 2012). Landsat-8 OLI is appropriate for land use/cover mapping (Czapla-Myers, et al., 2015; Flood, N., 2014; Jiag, P., Li, Feng, Z., 2014; Knight, E., Kvaran, G., 2014; Ke, Y., et al., 2015; Pervez, W., 2016; Morfitt., R., 2015; Markham, B., 2014; Roy D., et al., 2014. This paper presents a change detection study of Landsat-8 Operational Land Imager (OLI) data of the study area for the four seasons and for six different cases. The post classification techniquehas been used in this paper due to its advantages. Different change detection methods were used in the literature depending upon its application (Almutairi, A., Warner, T. A., 2010; Hecheltjen, A., Thonfeld, F., Menz, G., 2014. The objective of the paper was: (i) to evaluate SVM classification on OLI data for the four seasons; (ii) to evaluate post classification change detection analysis of OLI SVM classified data for the six cases
2. STUDY AREA AND DATA SETS
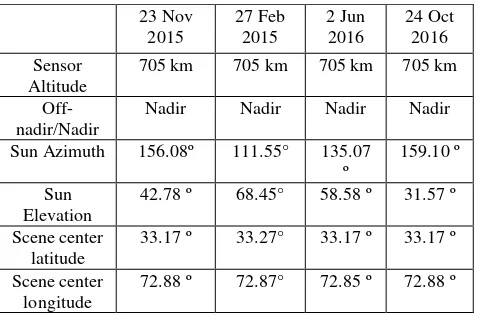
This paper describes change detection analysis of SVM classified OLI data for the four seasons. OLI data parameters of the study area is shown in Table 1.
Table 1 : Imaging geometry conditions and scene center latitudes and longitudes for Landsat-8 OLI
23 Nov
3. RESULTS AND DISCUSSION
3.1 OLI SVM Classified Data and Change Detection Analysis
OLI SVM classified data was used for change detection analysis of six cases.
3.2 Experimental Setup
The ROI were selected by using high resolution imagery and maps. Following values were assigned for experimental setup: Kernel parameter gamma (γ) =1/No of bands= 0.143
Penalty parameter C = 100 pyramid parameter = zero
classification probability threshold = zero
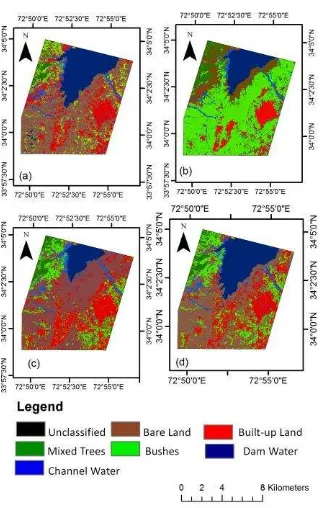
Figure 1.OLI SVM classified data (a) winter (23 November, 2015), (b) spring (27 February, 2016) (c) summer (2 June,
2016), and (d) autumn (24 October, 2016)
3.3 Case 1: Change Detection from Winter to Spring
Change detection matrix (Table 2) from winter to spring shows decrease of spatial distribution of bare land 66.99%, dam water 43.85 %, built-up land 50.95 and increase of mixed trees 9.2%, shallow water 40.4 % and shrub 514.4%. Figure 2 shows a change of category from dam water to channel water, dam water to bushes, and dam water to bare land. Similarly, a change of category from bare land to bushes, bushes to mixed trees, built-up area to bushes and built-built-up area to bare land resulted increase of bushes in spring from winter. Change detection from winter to spring resulted reduction in dam water mapping and increases of bushes.
Figure 2. Change detection results of OLI SVM classified data from winter to spring
3.4 Change Detection from Winter to Summer (Case 2)
Change detection matrix (Table 3) shows decrease of spatial distribution of bare land 16.01%, dam water 32.52%, built-up land 40.3 and increase of mixed trees 22.1%, channel water 181.5% and bushes 121.5%. Figure 3 shows a change of category from dam water to channel water, dam water to bare land. Similarly, a change of category from bare land to bushes, built-up land to bare land, bushes to mixed trees resulted increases of vegetation in summer compared to winter. A change of category from mixed trees to dam water resulted near the shoreline. Change of category from bare land to built-up is due to seasonal variation. Change detection from winter to summer resulted reduction in dam water mapping and increase of vegetation.
Figure 3. Change detection results of OLI SVM classified data from winter to summer
3.5 Change Detection from Winter to Autumn (case 3)
Change detection matrix (Table 4) from winter to autumn shows decrease of spatial distributions of mixed trees 90.81%, bare land 21.50% and increase of channel water 2.1 %, dam water 172.7%, bushes 94.3% and built-up land 16.72%. Figure 4 shows category changes with increase in dam water mapping from bare land to deep water and from bare land to bushes. Similarly, small category changes from built-up land to bare land result due to seasonal variations.
Figure 4. Change detection results of OLI SVM classified data from winter to autumn
3.6 Change Detection from Spring to Summer (case 4)
Change detection matrix (Table 5) from spring to summer shows decrease of spatial distributions of mixed trees 88.35%, channel water 32.97%, bushes 72.75% and increase of bare soil 201.05%, built-up land 157.58% and dam water 288.69%. Figure 5 shows category changes from mixed trees to bushes, bare land to bushes. Similarly category change from bushes to built-up land and bare land to built-up land, bushes to bare land, channel water to built-up land resulted due to decrease of vegetation. Category change from dam water to bare land resulted due to seasonal variation. Change detection from spring to summer resulted reduction of vegetation and shallow water.
Figure 6.Change detection results of OLI SVM classified data from spring to summer
3.7 Change Detection from Spring to Autumn (case 5)
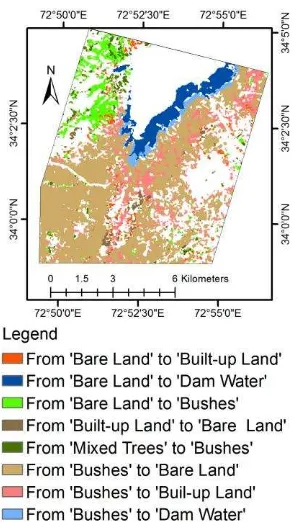
Change detection matrix (Table 6) from spring to autumn shows decrease of spatial distribution of mixed trees 91.59%, Channel water 27.29%, bushes 68.37% and increase of bare land 137%, deep water 385.85% and built-up land 137.96%. Figure 6 shows category changes with increases in dam water mapping from bushes to dam water, bare land to dam water in areas near the shoreline. Similarly change of category from bushes to bare land, built-up land to bare land, mixed trees to bushes resulted decrease of vegetation. Change of category from bare land to built-up land, bushes to built-up land resulted decrease of vegetation. Small category changes from bare land to bushes resulted due to seasonal variation.
Figure 7.Change detection results of OLI SVM classified data from spring to autumn
3.8 Change Detection from Summer to Autumn (case 6)
Change detection matrix from Summer to Autumn shows (Table 7) decrease of spatial distributions of bare land 21.01%, mixed trees 27.78% and increase of dam water 24.99%, channel water 8.48% and bushes 16.04%. Figure 7 shows a category changes with an increase in dam water mapping from bare land to dam water, channel water to dam water in areas near the shoreline. Similarly, category changes from bare land to bushes, built-up land to bushes, mixed trees to bushes resulted increase of bushes. Change of category from bare land to built-up area, built-up area to bare land, and bushes to bare land resulted due to seasonal variations.
Figure7.Change detection results of OLI SVM classified data from from summer to autumn
4. CLASSIFICATION ACCURACY ASSESSMENT
Classification accuracy assessment was carried outby using confusion matrix. The overall classification accuracy for OLI winter , spring, summer and autumn season data were classified by SVM were 92.20 (Kappa coefficient=0.90), 94.81 (Kappa coefficient=0.94), 93.80 (Kappa coefficient=0.92) and 92.77 (Kappa coefficient=0.90) respectively based on the confusion matrix. Thus OLI SVM data is appropriate for change detection analysis.
5. CONCLUSIONS
The results of this study confirmed the potential utility of OLI data change detection analysis The OLI SVM classified data was successfully classified with regard to all six test classes (i.e., bare land, built-up land, mixed trees, bushes, dam water and channel water) after pre-processing and atmospheric correction. OLI SVM classified data resulted higher overall accuracy (more than 92%) and kappa coefficient and thus suitable for change detection analysis. The OLI SVM-classified data for the four seasons were used for change detection analysis of six cases. Case1: change detection from winter to spring resulted reduction in dam water mapping and increases of bushes. Case2: change detection from winter to summer resulted reduction in dam water mapping and increase of vegetation. Case3: change detection from winter to autumn resulted with increase in dam water mapping. Case 4 : Change detection from spring to summer resulted reduction of vegetation and shallow water. Case 5: change detection from spring to autumn resulted decrease of vegetation. Case 6: Change detection from summer to autumn resulted increase of bushes and vegetation.
These results established that the new OLI technology, with its higher overall accuracy suitable for post classification change detection analysis.
Table 2: Change Detection Percentage Operational Land Imager Data from Winter to Spring Season
Class Bare Land Dam Water Mixed Trees Channel Water Bushes Built-up Land
Bare Land 11.4 25.3 0.13 14.6 20.1 18.9
Dam Water 0.004 56.1 0 0.05 0 0
Mixed Trees 1.8 2.3 99.4 0.73 26.6 0.1
Channel Water 1.9 4.2 0.01 52.6 1.4 9.4
Bushes 83.9 11.6 0.5 19.5 51.8 28.7
Built-up Land 0.9 0.5 0 12.5 0.1 42.8
Class Total 100 100 100 100 100 100
Class Changes 88.6 48.8 0.6 47.4 48.2 57.1
Image Difference -66.9 -43.8 9.3 40.4 514.4 -50.9
Table 3: Change Detection Percentage Operational Land Imager Data from Winter to Summer Season
Class Bare Land Dam Water Mixed Trees Channel Water Bushes Built-up Land
Bare Land 61.0 6.5 11.1 4.2 48.5 43.01
Dam Water 0 70.4 0 0 0 0
Mixed Trees 3.9 5.9 68.9 2.0 7.5 0.61
Channel Water 2.5 6.5 1.3 78.5 4.3 5.7
Bushes 30.0 3.9 17.9 3.1 40.3 13.01
Built-up Land 3.7 7.1 0.3 14.1 2.5 38.05
Class Total 100 100 100 100 100 100
Class Changes 40.1 31.61 31.5 21.3 62.7 63.1
Image Difference -16.01 -32.52 22.1 188.5 121.5 -40.3
Table 4: Change Detection Percentage Operational Land Imager Data from Winter to Autumn Season
Class Bare Land Dam Water Mixed Trees Channel Water Bushes Built-up Land
Bare Land 62.6 4.5 0.2 18.4 15.1 27.1
Dam Water 0.02 95.1 91.2 0.3 0 0
Mixed Trees 0.01 0.01 7.9 0 5.6 0
Channel Water 1.75 0.1 0.01 56.2 0.5 5.1
Bushes 19.1 0.1 0.6 3.1 72.1 5.7
Built-up Land 16.5 0.1 0.02 22.1 6.5 62.1
Class Total 100 100 100 100 100 100
Class Changes 37.3 4.9 92.1 43.9 27.9 37.9
Image Difference -21.5 172.7 -90.8 2.1 94.2 16.7
Table 5: Change Detection Percentage Operational Land Imager Data from Spring to Summer Season
Class Bare Land Dam Water Mixed Trees Channel Water Bushes Built-up Land
Bare Land 45.2 22.3 2.6 17.6 67.3 7.2
Dam Water 0 72.5 83.5 0 0 0
Mixed Trees 2.5 0 9.6 0.1 0.7 0
Channel Water 4.6 5.1 0.1 38.3 0.4 0.5
Bushes 28.7 0 3.8 8.7 14.5 1.3
Built-up Land 18.9 0.1 0.2 36.1 17.0 90.9
Class Total 100 100 100 100 100 100
Class Changes 54.7 27.8 90.3 61.6 85.4 9.1
Image Difference 201.1 288.7 -88.3 -32.9 -72.7 157.6
Table 6: Change Detection Percentage Operational Land Imager Data from Spring to Autumn Season
Class Bare Land Dam Water Mixed Trees Channel Water Bushes Built-up Land
Bare Land 20.4 0.02 1.5 13.1 60.3 15.1
Dam Water 29.9 99.9 84.5 13.4 2.8 1.1
Mixed Trees 0.2 0 8.2 0 0.1 0
Channel Water 5.0 0.03 0.1 34.1 1.9 3.5
Bushes 28.0 0 5.3 7.7 18.1 0.9
Built-up Land 16.5 0 0.4 31.6 16.7 79.4
Class Total 100 100 100 100 100 100
Class Changes 79.6 0.1 91.8 65.9 81.8 20.6
Image Difference 137.8 385.8 -91.6 -27.3 -68.4 137.9
Table 7: Change Detection Percentage Operational Land Imager Data from Summer to Autumn Season
Class Bare Land Dam Water Mixed Trees Channel Water Bushes Built-up Land
Bare Land 62.8 0 0.3 9.6 15.9 23.2
Dam Water 17.5 99.9 0.1 33.6 0.1 3.4
Mixed Trees 0.01 0 64.9 0 2.3 0
Channel Water 3.1 0 0 52.1 0.5 2.3
Bushes 4.4 0 34.6 1.3 72.5 11.3
Built-up Land 12.0 0 0.02 3.2 8.6 59.6
Class Total 100 100 100 100 100 100
Class Changes 37.1 0 35.0 47.9 27.5 40.4
Image Difference -21.0 24.9 -27.8 8.5 16.04 -7.6
REFERENCES
Almutairi, A., Warner, T. A., 2010. Change Detection Accuracy and Image Properties: A Study Using Simuated Data. In Remote Sens. 2, 1508–1529.
Czapla-Myers et al., 2015. The ground-based absolute radiometric calibration of Landsat 8 OLI. In Remote Sens. 7, 600–626.
Coppin, P., Jonckheere, I., Nackaerts, K., Muys, B., lambin, E., 2004. Review Article Digital Image change detection methods in ecosystem monitoring: A review. In Int. J. Remote Sens.25, 1565–1596.
Flood, N., 2014. Continuity of Reflectance Data between Landsat-7 ETM+ and Landsat-8 OLI, for both top-of-atmospheric and surface reflectance: A Study in the Australian landscape.In Remote Sens. 6, 7952–7970.
Gardelle, J., Hieraux, P., Kergoat, L. and Grippa, M., 2010. Less rain, more water in ponds: A remote sensing study of the dynamics of surface waters from 1950 to present in Pastoral Sahel (Gourma Region Mali). In Hydrology and earth Sciences 14(2): 309–324. Doi:10.5194/hess-14-309-2010.
Hussain, M., Chen, D., Cheng, A., Wie, H., Stanley. D., 2013. Change detection from Remotely Sensed Images: From Pixel-Based to Object –Based Approches. In ISPRS J. Photogramm
and remote Sensing 80: 91–106.
Doi:10.1016/j.isprs.2013.03.006.
Hecheltjen, A., Thonfeld, F., Menz, G., 2014. Recent advances in remote sensing change detection- A review. In Land Use and Land Cover Mapping in Europe. Manakos, I., Braun, M., Eds.; In Springer Netherlands: Dordecht, The Neterlands, pp. 145– 178 .
Irons, J. R., Dwyer, J. L., Barsi, J. A., 2012. The next Landsat satellite: The Landsat data continuity mission. In Remote Sens. Environ. 122, 11 –21.
Jiag, P. Li, Feng, Z., 2014. Cross-Comparison of Vegetation Indices Derived from Landsat-7 Enhanced Thematic Mapper (ETM_) and Landsat-8 Operational Land Imager (OLI) sensors. In Remote Sens. 6, 310–329.
Ke, Y., Im, J., Lee, J., Gong, H., Ryu, Y., 2015. Characteristics of Landsat 8 OLI-derived NDVI by comparison with multiple satellite sensors and in-situ observations. In Remote Sens. Environ.164, 298–313.
Knight, E., Kvaran,G., 2014. Landsat-8 operational land imager design, characterization and performance. In Remote Sens.6, 10286–10305.
Lu, D., Moran, E., and Hetrick, S., 2011. Detection of Impervious Surface Change with Multitemporal Landsat Images in an Urban-Rural Frontier.” ISPRS J. Photogramm and remote Sensing, 66: 298–306. doi: 10.1016/j.isprsjprs.2010.10.010. Morfitt, R., Barsi, J., Levy, R., Markham, B., Micijevic, E., Ong, L., Scaramuzza, P., Vanderwerff, K., 2015.
Landsat-8 Operational land imager (OLI) radiometric performance on orbit. In Remote Sens. 7, 2208–2237
Musci, L., Muladi, L., Henits, A., Farsang, Albrecht, V., 2014. Large scale UHI Mapping Based on Spatial Information Provided by Young Volunteers. In Carpathian Journal of Earth and Environmental Sciences 9 (2): 31–43.
Markham, B. L., et al., 2010. The Landsat data continuity mission operational land imager (OLI) radiometric calibration. In IEEE Int. Geoscience and Remote Sensing Symp. (IGARSS), pp. 2283–2286 (2010).
Markham, B., et al., 2014. Landsat-8 operational land imager radiometric calibration and stability. In Remote Sens. 6, 12275– 12308.
Pehlevan, N., Schott, J. R., 2011. Investigating the potential of the operational land imager (OLI) for monitoring case II waters using a look-up-table approach. In Pecora 18: Forty Years of Earth Observation-Understanding a changing World, Herndon, VA.
Pervez, W., Valiuddin, Khan, S. A., Khan, J. A., 2016. Satellite-based land use mapping: comparative analysis of Landsat-8, Advanced Land Imager, and big data Hyperion imagery. In J. Appl. Remote Sens. 10 (2), 026004 (2016); doi: 10.1117/1.JRS.10.026004.
Roy, D., et al. 2014. Landsat-8: Science and product vision for terrestrial global change research. In Remote Sens. Environ. 145, 154–172.
Seekell, D. A., and Pace., M. L., 2011. Does the Pareto distribution adequately describe the size sistribution of lakes? In Limnology and oceanography 56 (1): 350–356. Doi:10.4319/lo.2011.56.1.0350.
Schneider, A., 2012. Monitoring Land Cover Change in Urban and Peri-Urbanareas Using Dense Time Stacks pf Landsat Satellite Data a data Mining Approach. In Remote Sens. Environ, 124,: 689–704. Doi:10.1016/j.rse.2012.06.006. Unger et al.J., 2010. Modelling of the Urban Heat Island Pattern Based on the Relationship between Surface and Air temperature. In Quarterly Journal of the Hungarian Meterlogical Service 114; 287–302.
U.S. Geological Survey, “Landsat Data Continuity Mission”, U.S. Geological Survey, Washington, DC (2012).
Verpooter, C., Kutser, T. and Tranvik, L., 2012. Automated mapping of water bodies using Landsat multispectral data. In Limnology and oceanography methods10:1037– 1050.Doi:10.4319/lom.2012.10.1037.
Yuan,F., Swaya, K. E., Loefffelholz, B. C., and Bauer, M. E., 2005. Land Cover Classification and Change Analysis of the Twin Cities (Minnesota) Metropolitan Area by Multi temporal Landsat Remote Sensing. In Remote Sens. Environ, 98, (2– 3):317–328. Doi:10.1016/j.rse.2005.08.006.
Z. Zhang, Z., Dong, Z., Yan, C. and Hu., G., 2015. Change of lake areas in the southeastern part of China’s Badain Jaran Sand Sea and its implications for recharge source. In Journal of Arid Land7 (1):1–9, doi:10.1007/s40333-014-0009-5.