FROM FIELD WORK TO DELIVERABLES. EXPERIENCES ON THE TIN HOUSE
COURTYARD DOCUMENTATION
L. Bello Caballero a, *, D. Mezzino b, A. Federman c, M. Santana Quintero d,
a Dept. of Architecture and Urban Planning, Universidad de Oriente, Ave. Las Américas, S/N Santiago de Cuba – [email protected]
b Carleton Immersive Media Studio, Carleton University - 1125 Colonel By Drive, Ottawa
c Carleton University – 1125 Colonel By Drive, Ottawa – [email protected] d Department of Civil and Environmental Engineering, Carleton University, 1125 Colonel By Drive, Ottawa –
KEY WORDS: Tin House Courtyard, laser scanner, photogrammetry, CAD drawings, BIM models, documentation
ABSTRACT:
The Tin House Courtyard is a property of the National Capital Commission (NCC) in Ottawa, Canada. The site is located within the ‘Mile of History’, a historical route running from Parliament Hill to the Governor General’s residence. Currently, existing assets are under intervention works that include several preservation and renewal actions. Within the broader project, one of the tasks before construction works started was the documentation of the set of facades. The Carleton Immersive Media Studio (CIMS) at Carleton University in Ottawa was commissioned by NCC to conduct the recording of the area. This paper describes the process undertaken from field work to the final deliverable to the client, as well as the issues faced in between. Nowadays, up to date surveying technologies have revolutionized the methodologies for cultural heritage documentation. In this regard, the recording strategy employed encompassed the use of photogrammetry, laser scanner, total station, as well as different pre and post processing software in order to generate the desired outcomes.
1. INTRODUCTION
Starting in 2016, the National Capital Commission (NCC) is undertaking restoration and upgrade work at the Tin House Courtyard to ensure the preservation of the existing heritage buildings. Actions include the restoration of facades; the replacement of roofs, windows, and outdated electrical and mechanical equipment; the improvement of universal accessibility; repairs to foundations; upgrading of ventilation systems; as well as interior renovations (NCC, 2016). Within the broader project, one task was commissioned to the Carleton Immersive Media Studio at Carleton University. CIMS was retained to conduct the documentation of the site, in order to create digital records before the construction works began.
International seminal documents within the heritage documentation field have noted the significant role of creating records as an integral part of conservation. Particular importance is given to those produced prior to intervention actions (ICOMOS, 1996; Letellier, 2007; UNESCO, 2012). To that end, available tools and methodologies should accurately capture – among other characteristics– dimensions, shape, colour, textures, materials, and spatial configuration. Those reasons endorse the results of this work, which aimed at providing digital registries as a resource to support decision-making and as a m emory for posterity.
Current techniques and technologies for data collection and processing were used to generate the final product. Indirect scene capturing tools (Santana et al., 2007) such as a terrestrial laser scanner, high dynamic range cameras and total station were essential for field recording. Acquired raw data was processed by means of raster graphics editor, coordinate system interpretation,
* Corresponding author
photogrammetric, and point cloud management software. Moreover, 2D drawings and 3D models were generated in CAD and BIM systems respectively. This paper describes the process from site recording to the production of these deliverables. It also refers to the different issues faced in both field work within a busy urban environment, and desktop data management.
2. THE SITE: TIN HOUSE COURTYARD
According to the Archaeological Monitoring, Soil Sampling Report retained by NCC from Stantec Consulting Ltd., the first evidence of a structure close to the site dates back to early 1831. Before that, much of the area that eventually became Lower Bytown was a cedar swamp. Significant changes were already visible a decade later, as archival documents confirm the existence of brick and wooden structures around the area. A map from 1851 describes a slow growth with almost no variations in the district, except for one wooden construction eventually removed. (Stantec Consulting Ltd., 2015)
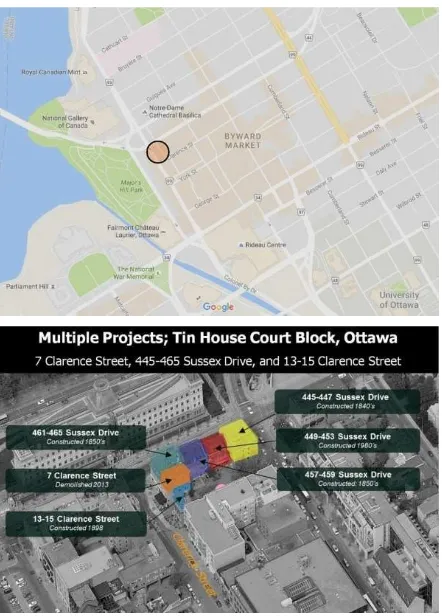
Redevelopments of the area took place in the later 20th century when other uses like parking lots were incorporated. Nowadays, the Tin House Courtyard is located within the Byward Market, a historical part of Lower Bytown in the City of Ottawa. Its surrounding areas have been heavily densified due to urban growth (Stantec Consulting Ltd., 2015). Currently, the multiple projects undertaken by NCC encompass the intervention on the buildings that compose the bloc (NCC, 2016). (Fig. 1)
Figure 1: Site location within the Byward Market in Ottawa, and aerial view indicating the set of buildings. Sources:
Google maps and NCC, 2016.
3. RECORDING STRATEGY
The digitization of the built environment has gradually been improved with the introduction of technology able to produce different outcomes from one work session. However, a procedural mapping strategy is important due to the wide variety of options existing in documentation, thereby creating an equally wide spectrum of user expectations. Tool variables such as availability, speed, precision, field operability, and portability, as well as site’s constraints, need to be considered (Santana et al., 2007). Therefore, the selection of a proper recording method, data management platforms, and criteria for presentation are crucial to reaching optimal results.
Currently, data acquisition technologies such as laser scanning and photogrammetry have become –when accessible– integral to heritage documentation (Hayes et al., 2015). Likewise, software platforms –e.g. CAD and BIM systems– have enriched the depiction and analysis of architectural records (Letellier, 2007; Cheng et al., 2015; Biagini et al., 2016). From this perspective, once the project was commissioned by NCC, a strategy for documentation was planned. It considered three main stages: data collection; data processing, and generation of outcomes. (Fig. 2)
Figure 2: Strategy for the documentation of the Tin House Courtyard. Source: authors
3.1 Data collection
The process of data collection encompassed two field work sessions. During the first one, a large amount of data was collected in seven hours. A second session of approximately four hours was necessary to record missing features due to site constraints such as: vehicular traffic, constant passers-by, and the presence of a diplomatic seat on Sussex Drive. The lattermost limited the use and placement of equipment –e.g. using a drone for aerial photography–. The survey was planned by taking field notes to optimize the use of the laser scanner, the total station, and the digital camera. Accordingly, three tripods helped to switch devices’ positions for a better time saving. A short description of the employed instruments follows:
Total Station: Leica Geosystems TS11, distance accuracy of 2 mm and angular 2 ppm for line work. Surveyed points were located in the facades of the building set. Moreover, extra control points for resection were placed surrounding the site. A total of 19 points related to the instrument location plus 42 points in the facades were measured.
Laser Scanner: Faro Focus 3D X 330. The particular ease in the operability and portability of this machine helped to nimbly move and capture data throughout the site. In each second of work, 976 000 points were recorded, with a precision of +– 2mm. In the first session, 17 stations were required, while in the second only six were sufficient to complete missing data. Each scan was configured to have a point density of 7.8mm at a 10m distance. In order to reference the point clouds, the data acquired with the laser scanner was ultimately combined with the measured points obtained from the total station.
3.2 Data processing
The large dataset acquired during field work was processed following two steps. The first one, included necessary operations to convert ‘raw data’ into compatible formats, and ultimately readable files. The second was more addressed to produce the deliverables. Accordingly, the software tools used for point cloud management, coordinate system interpretation, raster graphic and vector editors are described here:
Point cloud management: different software permitted to read the ‘raw data’ stored in the laser scanner, and edit the resulting global point cloud. Moreover, an animation was created for improved condition visualization and virtual walk-through. To these ends, proprietary tools like Scene, Autodesk Recap and Geomagic helped to conduct the different operations.
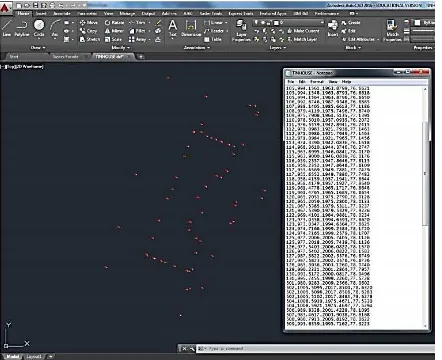
Coordinate system interpretation: the local coordinate system generated by means of the total station was retrieved in both, ‘txt’ format and vector format. The first was useful to reference the photogrammetric project, while the second helped to visualize points position and measure distances in Autodesk AutoCAD. (Fig. 3)
Figure 3: Surveyed points in CAD environment, and their respective coordinates.
Raster graphic editors: the large imagery dataset was imported into Adobe Photoshop to convert from raw Nikon ‘NEF’ files to a ‘positive’ file format for storage, and further processing in Agisoft Photoscan. To conduct the photogrammetric project, it was necessary to separate the operations in four chunks according to each one of the line of facades, i.e. Clarence St., Sussex Drive, Murray St., and the courtyard. In the case of the 360° context view, Hugin software was employed for image composition.
Vector editors: Autodesk AutoCAD, and later on Autodesk Revit. Firstly, these products were used to create 2D elevation drawings on the basis of the scaled orthophotos retrieved from photogrammetry and the laser scanner point cloud. Secondly, the NCC showed interest in having a 3D model with details about dimensions, materials, colours, constructive elements, and decorations. Therefore, a BIM model was created. This operation consumed more time due to the complexity of modelling objects (doors, windows) and constructive structures (mouldings, walls).
4. DOCUMENTATION REGISTRIES (OUTCOMES)
The use of different survey techniques, advanced instruments, and the links between all virtual technologies employed, served as the platform to generate outcomes which describe the site’s features at a certain moment in time. In this regard, geometries and shapes, textures, colours, dimensions, exterior appearance of buildings, scale, and the context were among the features recorded for posterity. Digital registries such as JPG file orthophotos, 2D CAD drawings, virtual walk-throughs, and a 3D BIM model are of the various resources kept for further studies:
Orthophotos: besides their role to assist in the generation of elevation drawings, these scaled graphics are of significant importance. The possibility to integrate in one file the buildings’ real appearance, colours, dimensions, details, and external conditions, is definitely an advantage compared to former ways to produce records. In addition, the relative low-cost, along with the reduced time and flexibility in data acquisition, are also added benefits. Accessible resources like a digital camera, and a software are enough to achieve results.
Accordingly, both details and the broader context were captured during field work. In the same manner, this approach allowed the team to move freely without the need of creating special survey facilities within a busy urban environment. It also permitted the ability to wait for temporary obstacles to displace (e.g. pedestrians, cars) with no further consequences in data capturing. However, parts of the roofs are missing due to the constraints determined by the presence of a diplomatic seat, which did not authorize the use of supplementary data capturing devices; for example, a drone. (Fig. 4)
Figure 4: From photogrammetric project to orthophoto generation.
Figure 5: 2D Drawing generation out of an orthophoto in CAD environment.
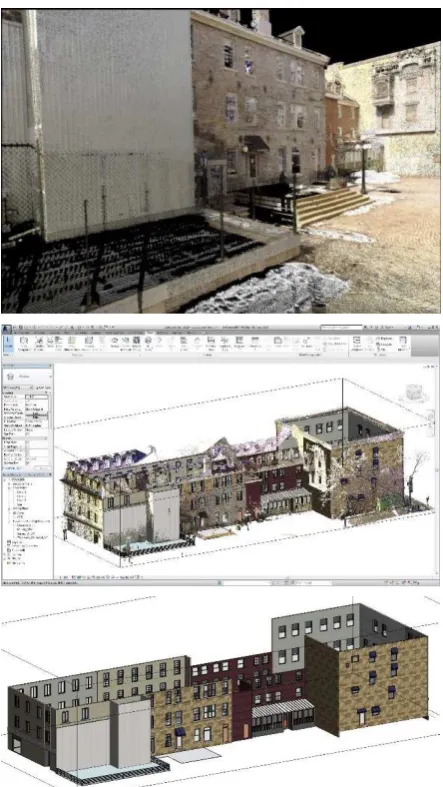
Point cloud: typically, point clouds are ‘the mean’ to achieving a further result. Nevertheless, their capability for integrating a large amount of reliable data on the existing conditions makes a point cloud to be an ‘end’ itself. Moreover, it is a resource for dissemination and communication with non-experts by creating animated walk-throughs (Fig. 6). This outcome is relatively uncomplicated to produce with modern technologies like the laser scanner, though, some constraints were faced during field work. A second session to acquire missing data was required due to unexpected eventualities, for instance, the permanence of pedestrians, and vehicles while scanning.
3D BIM model: has been the ultimate approach to address built cultural heritage documentation and analysis (Fai et al., 2011; Logothetis et al., 2015). According to Cheng et al. (2015), among the most important generic processes of BIM is to “generate a parametric model that needed to convert the surface of constructed facilities to the desired model.” Furthermore, designers can use it to explore alternative concepts, conduct value engineering and optimize their designs; while contractors can ‘rehearse’ construction and prepare shop and fabrication drawings (Cheng et al., 2015). In view of that, the BIM model aimed at keeping a record that does not only store building features’ properties, but also can be a tool in the management of life cycle processes (Fai et al., 2011). (Fig. 6)
Figure 6: Walk-through on the point cloud. BIM model partially constructed out of the point cloud.
5. CONCLUSIONS
Following the principles for the documentation of historic buildings and sites, this work was addressed to create records for posterity before intervention actions took place. To that end, state-of-the-art survey techniques and digital technologies for documentation were employed to acquire and store relevant data from the Tin House Courtyard. The equipment, as well as the software tools used, produced different results ranging from 2D vector and image files, to a 3D BIM model. The various outcomes compose an information set on shapes, dimensions, materials, textures, colours, constructive details, and decorative elements. Further studies and construction works can use these records as a base to support decision-making.
6. LESSONS LEARNED
During the course of this work two important lessons were learned:
ii. There is no one established way to achieve results within the documentation field. Available resources, and site constraints will determine the use of a specific approach. Likewise, a variety of digital technologies should be employed in order to produce records for different purposes; ranging from traditional representation, to a more complex visualization of the building or site.
ACKNOWLEDGEMENTS
It is essential to acknowledge the opportunity given by the National Capital Commission in Canada to conduct this work. Also, to the Carleton Immersive Media Studio at Carleton University in Ottawa for providing the equipment for on-site survey, and further desktop data processing.
REFERENCES
Biagini, C., Capone, P., Donato, V., Facchini, N., 2016. Towards the BIM implementation for historical building restoration sites. Autom. Constr. 71, 74–86. doi:10.1016/j.autcon.2016.03.003 Cheng, H.-M., Yang, W.-B., Yen, Y.-N., 2015. BIM applied in historical building documentation and refurbishing. ISPRS - Int. Arch. Photogramm. Remote Sens. Spat. Inf. Sci. XL-5/W7, 85– 90. doi:10.5194/isprsarchives-XL-5-W7-85-2015
CIPA, I., 2013. The CIPA 3x3 rules. http://cipa.icomos.org/fileadmin/template/pdf/3x3-
23_10_2013.pdf. Accessed: 2015-03-14
Fai, S., Graham, K., Duckworth, T., Wood, N., Attar, R., 2011. Building information modelling and heritage documentation, in: Proceedings of the 23rd International Symposium, International Scientific Committee for Documentation of Cultural Heritage (CIPA), Prague, Czech Republic. pp. 12–16.
Hayes, J., Fai, S., Kretz, S., Ouimet, C., White, P., 2015. Digitally-Assisted Stone Carving of a Relief Sculpture for the Parliament Buildings National Historic Site of Canada. ISPRS Ann. Photogramm. Remote Sens. Spat. Inf. Sci. II-5/W3, 97– 103. doi:10.5194/isprsannals-II-5-W3-97-2015
ICOMOS, 1996. PRINCIPLES FOR THE RECORDING OF MONUMENTS, GROUPS OF BUILDINGS AND SITES.
Letellier, R., 2007. Recording, Documentation, and Information Management for the Conservation of Heritage Places. Guiding Principles. The Getty Conservation Institute, Los Angeles, USA.
Logothetis, S., Delinasiou, A., Stylianidis, E., 2015. Building Information Modelling for Cultural Heritage: A review. ISPRS Ann. Photogramm. Remote Sens. Spat. Inf. Sci. II-5/W3, 177– 183. doi:10.5194/isprsannals-II-5-W3-177-2015
NCC, 2016. Upcoming work in Tin House Court area | National Capital Commission [WWW Document]. URL http://www.ncc- ccn.gc.ca/property-management/what-we-manage/upcoming-work-tin-house-court-area (accessed 6.12.16).
Santana Quintero, M., Blake, B., Eppich, R., 2007. Conservation of Architectural Heritage: The Role of Digital Documentation Tools: The Need for Appropriate Teaching Material. Int. J. Archit. Comput. 5, 239–253.
Stantec Consulting Ltd., 2015. Archaeological Monitoring, Soil Sampling Program at 7 Clarence Street, Ottawa, Ontario. Ottawa, ON, Canada.