RAPID VISUALIZATION OF GLOBAL IMAGE AND DEM BASED ON SDOG-ESSG
Bo Haiguanga, Wu Lixina,b,*, Yu Jieqingc, Yang Yizhoud, Xie Leia
a College of Geoscience and Surveying Engineering, China University of Mining and Technology, Beijing, 100083, P.R. China - [email protected] b Key Laboratory of Environment Change and Natural Disaster, Beijing Normal University, Beijing, 100875, P.R. China – [email protected]
c School of Environment Science and Spatial Informatics, China University of Mining and technology, Xuzhou, Jiangsu, 221116, P.R. China d College of Resources and Civil Engineering, North-eastern University, Shenyang, Liaoning, 110819, P.R. China.
Commission: IV-WG5
KEY WORDS: SDOG-ESSG, rapid visualization, LOD, layers and blocks, data culling, GPU parallel compute
ABSTRACT:
Due to the limit of the two-dimension and small scale issues, it’s impossible for the conventional planar and spherical global spatial grid to provide a unified real three-dimensional (3D) data model for Earth System Science research. The surface of the Earth is an important interface between lithosphere and atmosphere. Usually, the terrain should be added into the model in global changes and tectonic plates movement researches. However, both atmosphere and lithosphere are typical objects of three-dimension. Thus, it is necessary to represent and visualize the terrain in a real 3D mode. Spheroid Degenerated Octree Grid based Earth System Spatial Grid (SDOG-ESSG) not only solve the problem small-scale issues limited, but also solve the problem of two-dimension issues oriented. It can be used as real 3D model to represent and visualize the global image and DEM. Owing to the complex spatial structure of SDOG-ESSG, the visual efficiency of spatial data based on SDOG-ESSG is very low. Methods of layers and blocks data organization, as well as data culling, Level of Detail (LOD), and asynchronous scheduling, were adopted in this article to improve the efficiency of visualization. Finally, a prototype was developed for the quick visualization of global DEM and image based SDOG-ESSG.
1. INTRODUCTION
With data acquisition, storage and visualization technique development, Global image and DEM are widely used in ‘Digital Earth’ research area. In global image and DEM visualization area the most widely used 2D global grid is longitude-latitude spherical grid, such as Google Earth[1] and NASA World Wind[2],beyond that, the discrete global grids (DGG)[3], such as QTM[4], SEAHDG[5], 30-Side Polyhedron Grid[6] is used for the representation of global image and DEM. Although the spherical 2D grid is widely used, the real Earth is a 3D entity, 2D grid is not unified on the dimension with the Earth. Compare with 2D spatial grid, the 3D spatial grid such as Spheroid Degenerated Octree Grid based Earth System Spatial Grid (SDOG-ESSG)[7] not only solve the problem small-scale issues limited, but also solve the problem of two-dimension issues oriented. With SDOG-ESSG, plenty visualization experiments were implemented, such as 3D modelling of global lithosphere[8] and NCEP data[9]. But the complex of SDOG-ESSG makes the SDOG-SDOG-ESSG model visualization inefficiently. The developments of visualization algorithm and hardware technique provide approaches to increase the efficiency of SDOG-ESSG model visualization. The ROAM[10] algorithm provides the earliest dynamic terrain visualization method, by using CPU calculation, the algorithm can reducing the rendering data in real time dynamically. Other CPU rendering algorithm such as Batched dynamic adaptive meshes (BDAM)[11] is the improvement of ROAM. In the past decades, along with GPU develops, the performance of float computing in GPU has been escalated. The CPU rendering algorithm is not very suitable for current GPU[12]. The GPU rendering algorithm such as Geometry clipmaps[13] and Chunked LOD[14] are also used for dynamic terrain rendering. For large-scale data visualization such as global image and DEM, both a unified
spatial data frame and a suitable mechanism is needed. In this article, a rapid visualization method of SDOG-ESSG model is proposed, which is based on layers and blocks storage model, data culling, LOD control and dynamic scheduling. Finally some experiments were implemented.
The remainder of the paper is organized as follows. Section 2 provides a layers and blocks data model based on SDOG-ESSG. Section 3 describes our approach to culling and dynamic scheduling SDOG-ESSG model. Section 4 the mechanism in the paper is verified by the experiments. Section 5 concludes and discusses future directions. Section 6 is the acknowledgement of the financial support of the paper.
2. LAYERS AND BLOCKS DATA MODEL
2.1 SDOG-ESSG Multi-layers Data Model
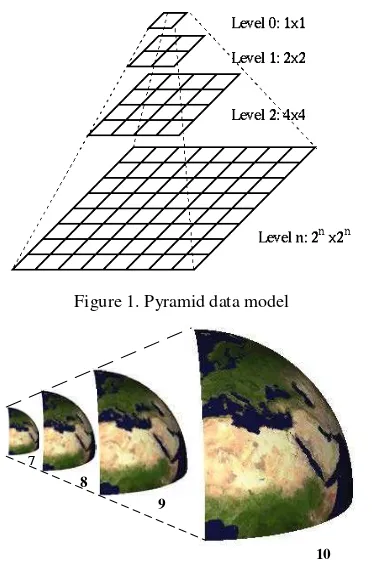
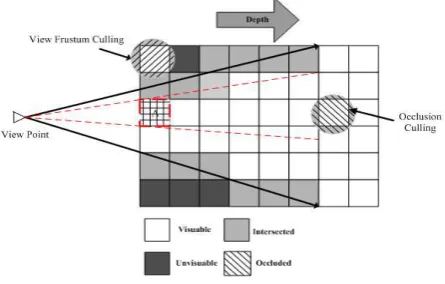
Similar with the pyramid data model (Ratio as 2), although there are some degenerated SDOG-ESSG cells, on vertical orientation, the SDOG-ESSG is a hierarchical data model, which character can be used to build a raster pyramid data model, such as high-resolution global image and DEM, as shown in figure 1, the range of each level remain unchanged, but the resolution of each level decrease by the ratio of 2. It is much easier and faster to visualization the lower level data, and this data model is widely used on data visualization area. Multi-layers SDOG-ESSG image representation is shown in figure 2, the SDOG-ESSG cell is filled with the image data (level 7~8). Algorithm 1 provides an approach to generate the pyramid model of SDOG-ESSG, by recursion children codes generating, we can get multi-level SDOG-ESSG codes with ratio of 2. GesCellType function is used for getting the type of SDOG-International Archives of the Photogrammetry, Remote Sensing and Spatial Information Sciences, Volume XL-4/W2, 2013
ESSG code and Ges2Level function is used for getting the level of SDOG-ESSG code.
Figure 1. Pyramid data model
10 7
8
9
Figure 2. Multi-layers SDOG-ESSG image representation
Algorithm 1 Generation of SDOG-ESSG children codes
Input:
fathercodes: vector of SDOG father codes Output:
childcodes: vector of SDOG children codes
1: childcodes.clear()
2: for i: 0->fathercodes.size() do 3: get=GesCellType(father codes[i]) 4: level=Ges2Level(fathercodes[i]) 5: if level=0 do
11: childcode=fathercodes[i]<<3 | m 12: childcodes.push_back(childcode) 13: end for
14: case GT_LG: 15: for m:0->2 do
16: childcode=fathercodes[i]<<3 | m 17: end for
18: case GT_SG: 19: for m: 0->3 do
20: childcode=fathercodes[i]<<3 | m 21: childcodes.push_back(childcode) 22: end for
23: end case 24: end for
2.2 SDOG-ESSG Multi-blocks Data Model
Mostly the data of computer operations involved is often only a subset of the global data, in order to dispatch these subset data, it is not enough to build a hierarchical layers model, on the horizontal orientation, it’s also need to build a multi-blocks data model. As shown in figure 3, each data block can be identified by the SDOG code, which is independent and unique. By using the (C, T, A) model, global data can be modelled in a uniform spatial frame. In addition to this, when interaction happened during the visualization, it is important to find the data that should be rendered and schedule them to memory quickly. Therefore, a rapid and accurate index is needed, as shown in figure 4, the multi-blocks SDOG-ESSG model data can be index by the SDOG code, which can provide a unique spatial bounding box.
Figure 3. Hierarchical blocked multi-resolution data storage model based on SDOG-ESSG
Root
SDOG0 SDOG1 SDOGn SDOG1
Figure 4. Structure of SDOG-ESSG Index tree
Equation (1) shows the relationship between the Principle Subdivision Level (PSL) and the Further Subdivision Level (FSL), PSL named as m and FSL named as a. Re is the radius of
where, RES0 is the resolution of level-0 SDOG-ESSG grid, we can get the PSL (m) with equation (2).
International Archives of the Photogrammetry, Remote Sensing and Spatial Information Sciences, Volume XL-4/W2, 2013 ISPRS WebMGS 2013 & DMGIS 2013, 11 – 12 November 2013, Xuzhou, Jiangsu, China
log ( ) 1
3. DATA CULLING AND DYNAMIC SCHEDULING
3.1 Data culling based on SDOG-ESSG
Based on the layers and blocks data model, the visual data are subset of the global data mostly, so there is need to find a data elimination strategy to culling the invisible data. As shown in figure 5, each diamonds represents a SDOG-ESSG block, by using the multi-blocks data model, the culling algorithm’s computation complexity can reduce from O(N) to O(N/m). Both the view frustum and SDOG code represents a spatial bounding-box, by calculation the spatial relationship between the view frustum and SDOG-ESSG grid blocks, we can get the visibility of each blocks. On the other hand, due to the cover from depth and horizon, occlusion culling and horizon culling is also needed.
Figure 5. SDOG-ESSG blocked-data elimination strategy based on view-frustum culling
As shown in figure 6, the object O is the bounding sphere of a SDOG-ESSG block, e is the representation of the center of the Earth, v is the viewpoint, h is the intersection point of the sight
Equation (6) can be gotten from equation (3), (4) and (5), where
vois the distance between the viewpoint and the center of the
Earth, Ro is the radius of the bounding sphere, Re is the radius of the Earth. vo is the threshold, if the distance between SDOG
data the center of sphere bounding box and the center of the Earth is less than vo, this cell is visible, unless, this cell should
be culling.
3.2 Dynamic scheduling mechanism
There is no need to keep the precision of SDOG-ESSG model visualization unchanged during the visualization interaction happening. Usually the Level of Detail (LOD) control is needed,
when the viewpoint is further we need a coarser level, otherwise, we need a finer level. In this paper, the relation between screen grid and SDOG-ESSG grid is shown in figure 7 and equation (7).
Figure 6. SDOG-ESSG blocked-data elimination strategy based on horizon culling
Figure 7. Relation between screen grid and SDOG-ESSG grid
(7)
Where m, winSize, Re, Ld , dfar refer to main level of SDOG-ESSG, the size of render window, the radius of the Earth, the pixel number of the center SDOG-ESSG grid, and the distance from viewpoint to the frustum’s far plane, respectively.
As shown in equation(7) the main level of SDOG-ESSG is determined by pixel number of the center SDOG-ESSG grid and distance from viewpoint to the frustum’s far plane, the radius of the Earth and size of the render window is constant.
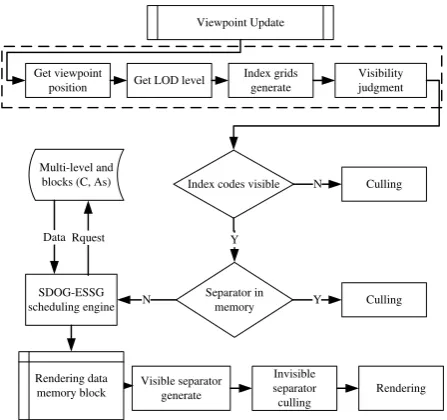
When the viewpoint update, the visualization data in the memory should be update. The mechinasm of the ddynamic scheduling based on multi-hierarchical and multi-blocks scheme is shown in figure 8, and the processing procedure is shown in table 1.
LOD control provides an approach to get the sutible precision of SDOG-ESSG blocked model, but it is still not enough to get an flency interaction. As layers and blocks SDOG-ESSG model is saved out of core, plenty of IO time is consumed, it is need to separate the IO accessing and rendering process into different threads. As shown in Figure 9, thread 1 is used for viewpoint updata, interaction control and data rendering; thread 2 is used for visable SDOG code generation and asynchronous
sche-2
International Archives of the Photogrammetry, Remote Sensing and Spatial Information Sciences, Volume XL-4/W2, 2013 ISPRS WebMGS 2013 & DMGIS 2013, 11 – 12 November 2013, Xuzhou, Jiangsu, China
duling. In this way, we can get a flency interaction during the dynamic visualizatoin.
Multi-level and blocks (C, As)
SDOG-ESSG scheduling engine
Separator in memory Index codes visible
Y
N Culling
Y N
Rquest
Culling Data
Visible separator generate
Invisible separator culling
Rendering Rendering data
memory block
Viewpoint Update
Get viewpoint
position Get LOD level
Index grids generate
Visibility judgment
Figure 8. Dynamic scheduling based on multi-hierarchical and multi-blocks scheme
Algorithm 2 Procedures of dynamic scheduling based on multi-hierarchical and multi-blocks
Step 1: Get the viewpoint position Pw, get LOD level L with Equation (7);
Step 2: Get the index SDOG grids with L and get the visibility of these index grids, culling the invisuable grids;
Step3: Search the rendering data memory block, if the separator is already in the memory, then culling this index code, else go to Step 4;
Step 4: Get the visible multi-level and blocks (C, As) data with the SDOG-ESSG engine, put the visible and unprocessing data into rendering data memory block, the data is stored as priority queue, then go to Step 5;
Step 5: Genetate sepatators with coin3D rendering API, which is organized as SoSeparators;
Step 6: Put these SoSeparators into the base SoSeparators, then remove the invisible and different level separators, then the scene will be updated.
Viewpoint Update Interaction
Control
Visible SDOG Code Generation
Thread1 Thread2
Asynchronous Scheduling Viewpoint
Infomation
Data Rendering
…
…
Block1
Block2
Figure 9. Mechanism of multi-thread data scheduling
4. EXPERIMENTS
4.1 Experiments Environments
Experiments were designed under environments of table 1. A prototype system was developed with C++\Qt\Coin3D, which implements the mechanism proposed in the paper.
Table 1. Parameters of experiments environments
Name Parameters
Operating System Windows 7(32) CPU Intel Core i3 (2.40G Hz)
GPU
NVIDIA NVS 3100M (600M Hz, 16 SP) GPU Memory: 512MB
Memory 2G
4.2 Experiments Data
Global scale image and DEM data source was used to test the mechanism proposed in this paper. We get the experimental image data from the blue marble project (http://visibleearth.nasa.gov/view.php?id=57752), which is organized by National Aeronautics and Space Administration (NASA); we get the experimental DEM data from GTOPO30 project(http://eros.usgs.gov/#/Find_Data/Products_and_Data_A vailable/gtopo30_info), which is organized by United States Geological Survey (USGS). The information of experimental data sources is shown in table 2. Both the image and DEM data should be organized as the multi-level and blocks (C, As) data, as shown in figure 4.
Table 2. Basic information of experimental data sources
Name land_shallow_topo_2
1600.tif GTOPO30
Resolution 0.016666666670 0.00833330 Size 21600*10800 43200*21600
Extent W180 0
~E1800, S900~N900
W1800~E1800, S900~N900
Band number 3 1
Volume (MB) 173.55 2448
4.3 Result and analysis
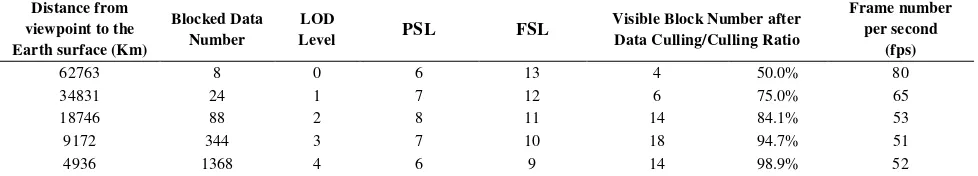
As shown in table 3, along with the distance from viewpoint to the Earth surface decrease, the LOD level increase as equation (5), the blocked data number is increased as the LOD level increasing, the principle subdivision level (PSL) and further subdivision level (FSL) determine the resolution of the blocked data together. The data culling ratio is increase as the LOD level increased. And the Frame number per second (fps) is larger than 24, which ensure the interaction fluently. Global image and DEM visualization result is shown as figure 10 and figure 11, at different level and different angle.
5. CONCLUSIONS AND FUTURE WORKS
In the paper we proposed a rapid visualization mechanism, which combine the layers and blocks data model, LOD control, data culling and asynchronous data scheduling, experiments International Archives of the Photogrammetry, Remote Sensing and Spatial Information Sciences, Volume XL-4/W2, 2013
shows that this mechanism can provide a fluency interaction, which is useful to SDOG-ESSG model rapid visualization.
Figure 10. Global image and DEM visualization based on SDOG-ESSG (Different Level)
Figure 11. Image and DEM visualization based on SDOG-ESSG (Different View Angle)
As the development of hardware technique, especially GPU parallel computing, it is a possible way to combine the GPU parallel computing and SDOG-ESSG model visualization together, and this will be our future research issues.
Table 3. Rendering efficiency based on mechanism
Distance from viewpoint to the Earth surface (Km)
Blocked Data Number
LOD
Level PSL FSL
Visible Block Number after Data Culling/Culling Ratio
Frame number per second
(fps)
62763 8 0 6 13 4 50.0% 80
34831 24 1 7 12 6 75.0% 65
18746 88 2 8 11 14 84.1% 53
9172 344 3 7 10 18 94.7% 51
4936 1368 4 6 9 14 98.9% 52
6. ACKNOLEDGEMENT
This paper is jointly supported by Natural Science Foundation of China Key Program (No. 40930104) and National Basic Research Program of China under Grant (No. 2011CB707102).
REFERENCES
1. Sheppard S R J, Cizek P., 2009. The ethics of Google Earth: Crossing thresholds from spatial data to landscape visualization. Journal of environmental management, 90(6), pp: 2102-2117.
2. HOGAN P., 2006. NASA World Wind//Geological Society of America Abstracts with Programs. 39(1), pp: 42. 3. Sahr K, White D, Kimerling A J., 2003. Geodesic discrete
global grid systems. Cartography and Geographic Information Science, 30(2), pp: 121-134.
4. Dutton G., 1996.Encoding and Handling Geospatial Data With Hierarchical Triangular Meshes[C]. Processing of 7th International Symposium on Spatial Data Handling, 43(1), pp:34-43.
5. BEN J, TONG X, ZHANG Y, et al., 2006. A Generation Algorithm of Spherical Equal-Area Hexagonal Discrete Gird and Analysis of Its Deformation. Geography and Geo-Information Science, (1), pp: 001.
6. Bernardin T, Cowgill E, Kreylos O, et al., 2011. Crusta: A new virtual globe for real-time visualization of sub-meter digital topography at planetary scales. Computers & Geosciences, 37(1), pp: 75-85.
7. Wu, L., & Yu, J., 2009. A new digital earth reference model: Spheroid-based 3d grid for earth system (3DGES). In The Sixth International Symposium on Digital Earth International Society for Optics and Photonics. pp: 784003-784003.
8. YU J Q, WU L X, Zi G J, et al., 2012. SDOG-based multi-scale 3D modeling and visualization on global lithosphere. Science China Earth Science, 55(6), pp: 1012-1020. 9. Yu, J., L. Wu, Z. Li., 2012. An SDOG-based intrinsic
method for three-dimensional modelling of large-scale spatial objects. Annals of GIS, 18(4), pp: 267-278. 10. Mark Duchaineauy., 1997. ROAMing Terrain: Real-Time
Optimally Adapting Meshes. IEEE Visualization’97 Proceedings. Los Alamitos, California:IEEE ComputerSociety Press, pp: 81-88.
11. P. Cignoni., 2003. BDAM-Batched Dynamic Adaptive Meshes for High Performance Terrain Visualization[C]. Eurographics, 22(03), pp: 505-514.
12. Nguyen H. GPU Gems 3: programming techniques for high-performance graphics and general-purpose computation. 2007.
13. Losasso F, Hoppe H., 2004. Geometry clipmaps: terrain rendering using nested regular grids. ACM Transactions on Graphics (TOG), 23(3), pp: 769-776.
14. Ulrich T. Rendering massive terrains using chunked level of detail control. SIGGRAPH Course Notes, 2002, 3(5).
International Archives of the Photogrammetry, Remote Sensing and Spatial Information Sciences, Volume XL-4/W2, 2013 ISPRS WebMGS 2013 & DMGIS 2013, 11 – 12 November 2013, Xuzhou, Jiangsu, China