A COMPARATIVE ANALYSIS OF RESOURCESAT-2 LISS-3 AND LANDSAT-8 OLI
IMAGERY
E.Venkateswarlu, T.Sivannarayana, K.V.Ratna Kumar
DPG&A, SDAPSA, NRSC, Balanagar, Hyderabad, India- (venkateswarlu_e, sivannarayana_t,ratna_kv)@nrsc.gov.in
KEY WORDS: LISS-3, OLI, inter-intra band, correlation coefficient, land cover, classification, vegetation indices, accuracy.
ABSTRACT:
Linear Imaging Self Scanning Sensor (LISS-3) onboard Resoucesat-1 and 2 Satellites have been used extensively for various land cover-land use applications. In this study, we examined the potential of using Resourcesat-2 LISS-3 images in the absence of LANDSAT-8 Operational Land Imager (OLI) images. This paper compares the capabilities of LISS-3 sensor with OLI sensor. LISS-3 images were selected for comparison because of their close resemblance in electromagnetic spectrum range with LS-8 OLI images. Images of LS-8 OLI and RS-2 LISS-3 of the same area in Andhra Pradesh were used to evaluate the comparative performances based on the intra-inter band correlation, spectral vegetation indices and land cover classification. The results showed that in most cases the LS-8 OLI and the RS-2 LISS-3 images are comparable. This study also indicated that LISS-3 images could fill the data gaps in OLI images for land-cover studies, vice versa.
1. INTRODUCTION
Resourcesat-2: The Resourcesat-2 with enhanced capabilities is a follow on of Resourcesat-1, launched on 20 April 2011. It has three cameras mounted on a single platform with a high resolution sensors LISS-IV, medium resolution LISS-3 and a coarse resolution AWiFS. It provides continuity of remote sensing data for various national and international projects. The core objective of this mission is to support remote sensing data for integrated land and water resources management at micro level, with improved spectral and spatial coverage. This data also supports many projects in diversified fields of applications like agricultural crop discrimination and monitoring, crop acreage / yield estimation, precision farming, water resources, forest mapping, infrastructure development, disaster management, snow and glacier studies, coastal zone management, urban landscape, locating groundwater potential zones etc,. It has the capability to capture the data globally through the on-board Solid State Recorder having 400 GB capacity apart from making the data available to the ground stations in real time.
Landsat 8: The Landsat 8 satellite images the entire Earth every 16 days in an 8-day offset from Landsat 7. It carries two instruments: Operational Land Imager (OLI) sensor and Thermal Infrared Sensor (TIRS). Landsat 8 Operational Land Imager (OLI) and Thermal Infrared Sensor (TIRS) images consist of nine spectral bands with a spatial resolution of 30 meters for Bands 1 to 7 and 9. New band 1 (ultra-blue) is useful for coastal and aerosol studies. New band 9 is useful for cirrus cloud detection. The resolution for Band 8 (panchromatic) is 15 meters. Thermal bands 10 and 11 are useful in providing more accurate surface temperatures and are collected at 100 meters. These sensors both provide improved signal-to-noise (SNR) radiometric performance quantized over a 12-bit dynamic range. Improved signal to noise performance enable better characterization of land cover state and condition.
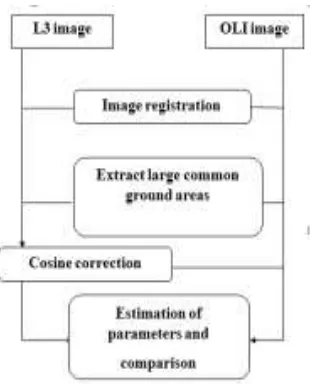
2. DATA AND METHODOLOGY
Table 1 shows the comparison between Landsat-8 OLI with Resourcesat-2 LISS-3 sensors. The LISS-3 is similar to OLI in visible bands and differs in near infrared band. Only images acquired in identical seasons were considered. The available images were further screened based on the absence of cloud cover. However, when multiple cloud free images were available, the images acquired closest to each other are selected for inclusion in the study. Data covering part of Hyderabad is selected from LISS-3 and OLI for comparative analysis. Due to different referencing schemes and scene framing, OLI scene is covered in two LISS-3 scenes. Both images are registered and large common area is extracted. Due to different output resolutions, OLI image is resampled to 24m for comparison, similar to LISS-3. Correction is applied to remove solar irradiance variations over the whole image due to different sun angles and path radiance differences on the two dates.
The International Archives of the Photogrammetry, Remote Sensing and Spatial Information Sciences, Volume XL-8, 2014 ISPRS Technical Commission VIII Symposium, 09 – 12 December 2014, Hyderabad, India
This contribution has been peer-reviewed.
Landsat-8
Operational Land Imager (OLI)
Resourcesat-2
Linear Imaging Self Scanning sensor (LISS-3)
Bands Wavelength
(micrometers)
Resolution (meters)
Bands Wavelength
(micrometers)
Resolution (meters)
Band 1 - Coastal aerosol 0.43 - 0.45 30 - - -
Band 2 - Blue 0.45 - 0.51 30 - - -
Band 3 - Green 0.53 - 0.59 30 Band 2- Green 0.52 - 0.59 24
Band 4 - Red 0.64 - 0.67 30 Band 3 - Red 0.62 - 0.68 24
Band 5 - Near Infrared
(NIR) 0.85 - 0.88 30
Band 4 - Near Infrared
(NIR) 0.77 - 0.86 24
Band 6 - SWIR 1 1.57 - 1.65 30 Band 5 - SWIR 1.55 - 1.70 24
Band 7 - SWIR 2 2.11 - 2.29 30 - - -
Band 9 - Cirrus 1.36 - 1.38 30 - - -
Table 1: Spectral bands comparison between LS-8 OLI and RS-2 LISS-3 sensors
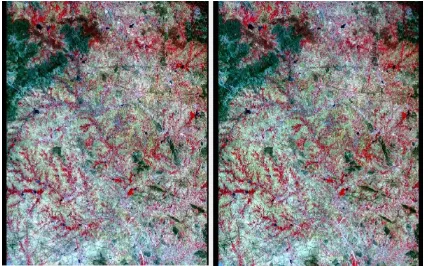
Fig-1: AOI covered in LISS-3 (left) and OLI (right)
Resourcesat-2 LISS-3 Landsat-8 OLI
Path-Row 99-60, 61 144-48
Date of Pass 15-04-2013 13-04-2013
Scene centre time (hh:mm:ss) 05:33:07.643809 (row-60)
05:33:27.899981(row-61)
05:11:28.479429
Sun elevation /Azimuth angles 69.97 / 111.21 65.62 / 106.11
Bands 2345 3456
Resampling Cubic Convolution Cubic Convolution
Projection/Datum UTM / WGS84 UTM / WGS84
Correction level Terrain corrected Ortho corrected
Output resolution (m) 24 30
Table 2: Characteristics of the images used in the study
The International Archives of the Photogrammetry, Remote Sensing and Spatial Information Sciences, Volume XL-8, 2014 ISPRS Technical Commission VIII Symposium, 09 – 12 December 2014, Hyderabad, India
This contribution has been peer-reviewed.
3. COMPARISON OF LISS-3 AND OLI IMAGERY- RESULTS
The results of intra band correlations between two images showed the similarities in bands of Landsat-8 OLI and Resourcesat-2 LISS-3 (Table 3, 4). The intra band correlation in LISS-3 and OLI are very similar. The correlation coefficient between bands 2 & 3 and bands 3 & 4 in LISS-3 is high. The same pattern was also observed in OLI image. Band 2 is also highly correlated with all other three bands in both sensors.
Table 3: Intra band correlation coefficients of L3
Table 4: Intra band correlation coefficients of OLI
The results of inter band correlations between two images showed the similarities in bands of OLI and LISS-3 (Table 5). The inter band correlation coefficients also showed that the bands of OLI images are correlated to the corresponding bands in LISS-3. Low correlation indicates its independence in information and high correlation indicates high data redundancy.
Table 5: Inter band correlation coefficients of L3 and OLI
Four land cover classes were identified in the study area using an unsupervised classification method. These classes include urban, vegetation, open field and water. It was found that LISS-3 image was classified more pixels than the OLI in 2,3; Landsat image was classified more pixels in class-1,4 (Table 6). However, some of these differences could be attributed to the differences in spatial resolution.
Table 6: Land-Cover classification (pixels)
Normalized Difference Vegetation Index (NDVI), Simple Ratio (SR) and Transformed Normalized Vegetation Index (TNDVI) were used to study the relative measurement performance and calculated from LISS-3 and OLI images. Correlation coefficients were calculated on vegetation index layers created from both images.
Vegetation index Correlation between LISS-3 and OLI
NDVI 0.66
SR 0.66
TNDVI 0.69
Table 7: Correlation between the vegetation indices
The results of these experiments (Table 7) indicate that vegetation indices created from both images are correlated each other. Low correlation may be attributed to the time difference between the acquisitions of images.
4. CONCLUSIONS
LISS-3 and OLI sensors are very similar in various aspects including image quality, spectral band width though there are some basic differences like spatial resolution. Similar band ranges and high resolution images of LISS-3 could make a better substitute for Landsat-8 images. In terms of spectral similarity, intra band correlations of OLI and LISS-3 images show higher than 90%. Inter band correlation coefficient between RS-2 and Landsat-8 images show higher than 60% except for band-4.
The correlations of multiple vegetation indices are about and above 60%. Also, the results of land use land cover classification show the differences of average 14% in the final land use land cover classes. These experiments show how LISS-3 image is similar spectrally to OLI image.
REFERENCES
A Comparative Study of Terra ASTER, Landsat TM, and SPOT HRG data for Land Cover Classification in the Brazilian Amazon by Dengsheng Lu*, Mateus Batistella§, Emilio F. Moran*, and Evaristo E. de Miranda.
A comparative analysis of CBERS and LANDSAT data by Shrinidhi Ambinakudige, Jinmu Choi, Sami Khanal, Department of Geosciences, Mississippi State University, Mississippi State. The International Archives of the Photogrammetry, Remote Sensing and Spatial Information Sciences, Volume XL-8, 2014
ISPRS Technical Commission VIII Symposium, 09 – 12 December 2014, Hyderabad, India
This contribution has been peer-reviewed.