FUSION OF RANGE-BASED DATA AND IMAGE-BASED DATASETS FOR EFFICIENT
DOCUMENTATION OF CULTURAL HERITAGE OBJECTS AND SITES
J. L. Lerma, M. Cabrelles, S. Navarro
Universitat Politècnica de València (UPV), Photogrammetry & Laser Scanning Research Group (GIFLE), Department of Cartographic Engineering, Geodesy and Photogrammetry. C° de Vera s/n, Building 7i, 46022 Valencia, Spain - [email protected],
[email protected], [email protected]
KEY WORDS: terrestrial laser scanning; photogrammetry; cultural heritage; documentation; registration; recording
ABSTRACT:
Nowadays it is possible to measure accurately dense point clouds either with aerial/terrestrial laser scanning systems or with image-based solutions (namely image-based on photogrammetric computer vision algorithms such as structure-from-motion (SfM)), from which highly detailed 3D models can be achieved. Besides, direct tools in the form of simple devices such as rulers, compass and plumb-lines are usually required in simple metric surveys, as well as high-end surveying and geodetic instruments such as robotized image-based total stations and GNSS (probably to a lesser degree but still required) to set the archaeological/architectural recording project in a global reference frame. With all this gamut of image-based and range-based sensors and datasets (in the form of coordinates, point clouds or 3D models), in different coordinate systems (most of the times local for each device), lack of uniform scale, orientation and levelling, the fusion of data tends to be cumbersome. This paper presents an efficient way to fuse and merge different datasets in the form of point clouds/3D models and geodetic/UTM coordinates. The new developed 3DVEM – Register GEO software is able to handle datasets coming from both direct and indirect methods in order to provide unified and precise deliverables.
1. INTRODUCTION
Documentation of cultural heritage can be undertaken with a wide range of direct and indirect measuring techniques to satisfy conservation needs based on the project scope and the recourses. Different requirements such as thoroughness, level of detail and accuracy have to be specified before the metric survey.
It is up to the information provider the right selection of either direct or indirect measuring techniques (Böhler, 2006). In principle, indirect techniques such as photogrammetry and LiDAR are more appropriate for measuring large and complex objects and sites. Direct tools such as GNSS receivers, total stations and even measuring tapes can also satisfy metric performances in the form of positioning, size and geolocation.
The flexibility of imaging sensors to acquire quickly and easily pictures, altogether with its widespread availability, and from them, point clouds and 3D models, and by-products, altogether with affordable hardware and the low-cost imaging software solutions has widening the number of specialists making use of point clouds and 3D models specially for recording and documentation of cultural heritage. However, the wide range of measuring tools yields neither the same level of detail nor the same level of accuracy. Laser scanning techniques are not considered anymore better 3D approaches than photogrammetric computer vision solutions but still optional and complementary. And unfortunately, there are still significant performance differences depending on the user’s handling of the same technique. Therefore, there is a huge demand in effective training and adoption of right solutions, despite recent 3D solutions seem more and more automatic, and the deliverables might satisfy quick 3D visualisations from diverse viewpoints, but not accurate reconstructions.
As 2D/3D data of any object and site can be provided in different formats, from different positions and orientations, levels of detail and metric quality, the benefit of merging, registering and fusing data into common reference frames, either Cartesian (global/local) coordinate frame or cartographic coordinate frame such as UTM can be not underestimated.
The registration (also known as alignment) of 3D data in the form of either multiple laser scanning datasets or range 3D images is a topic that has devoted huge attention in the scientific community. Two categories can be identified: pair-wise registration and simultaneous registration of multiple point clouds (Deng, 2011). Besides, other categories include the availability of artificial markers: targetless, as variants of the Iterative Closest Point (ICP) algorithm developed by Besl and McKay (1992); and target-based, in the form of sphere, cone, paddle and paper types (among others) that can be identified automatically by the software. Becerik-Gerber et al. (2011) confirmed the best results with the sphere targets in all tests (indoor/outdoor, phased-based/time-of-flight), compared to rotating paddle targets, being the flat paper targets the least accurate but the cheapest ones. Other approaches take into account feature-based registration algorithms which extract, match and model either lines or planes in overlapping 3D areas. Nevertheless, optimum results are not always guaranteed and target-based implementations satisfy most demanding implementations.
Registration usually refers to determine up to six degrees of freedom (three rotations and three rotations) in any 3D transformation to set common coordinate systems. Typical examples might be laser scanning data sets as well as laser scanning and total station datasets. Artese et al. (2014) demonstrate empirically that similar laser scanning datasets yield different registration results depending on the software used. Nevertheless, fusion integrates up to seven degrees of freedom, including the even scale. Therefore, whenever we are The International Archives of the Photogrammetry, Remote Sensing and Spatial Information Sciences, Volume XL-5/W7, 2015
dealing with 3D point clouds derived from SfM image-based solutions neither oriented, scaled nor translated, and metric data in the form of tape distances, compass and goniometric data, total station and laser scanning data, up to 7 parameters will have to be determined in the fusion step, not only to yield overall data onto a common reference system, but also clean data either in regular or even datasets (point clouds and/or 3D models). Therefore, whether the fusion step is well-undertaken, less filtering will be required afterwards to achieve best results, independently of the quality of the used measuring systems.
Georeferencing can be understood as the process of positioning, orienting, scaling and translating (i.e. transforming) metric 3D data (e.g. point cloud and 3D model) to a cartographic system such as the Universal Transverse Mercator (UTM). Many software packages exist to deliver non-referenced datasets in the form of 3D point clouds and/or 3D models. Besides, many GNSS navigators exist that deliver 3D coordinates in WGS84 with up to decimetre error (although most of the times it can be meter and decametre). However, tape measuring distances can be determined with enough accuracy (few millimetres). The fusion of all these data is not obvious when dealing with different reference frames.
Fabado et al. (2013) presented the initial set of low cost 3DVEM software modules developed by the Photogrammetry & Laser Scanning Research Group (GIFLE, 2013) at the Polytechnic University of Valencia (Spain) to handle 3D datasets. The effectiveness of the new GEO (from georeferencing) software module available on 3DVEM – Register GEO is presented herein to record different archaeological and architectural objects and sites. The final aim is to fuse a wide range of datasets acquired on site by different team members.
The measuring techniques used to record the site were a time-of-flight laser scanner and multi-image convergent photogrammetry, despite other datasets might have been used, GNSS, compass, plumb-line and, last but not least, a ruler.
2. FUSIONING CASE STUDIES
Different case studies will be presented to show the effectiveness of 3DVEM – Register GEO to undertake fusion from multiple sources.
2.1 Cova Remígia archaeological site
Cova Remígia (Remigia Cave, Fig. 1), placed in the Gasulla ravine, Ares del Maestre, Castellón, is part of the UNESCO World Heritage Site’s Rock Art of the Mediterranean Basin of the Iberian Peninsula (UNESCO, 1998). The corpus of late prehistoric mural paintings provides and exceptional picture of human life. It is possible to identify more than 450 Levantine art motifs painted on a curved 28 m long rock shelter.
2.1.1 Measuring techniques: A Leica ScanStation 2 time-of-light laser scanner system was used for the overall point cloud acquisition. The whole cave was digitized from four scan positions, acquiring up to 4.6 million points. In addition, from each scan station, four HDS rotating paddle targets were measured. Fig. 2 displays the setup of one scan position on site.
Figure 1. Partial view of Remigia Cave targeting Shelters IV-VI
Figure 2. Terrestrial laser scanning setup targeting targeting Shelters I and II
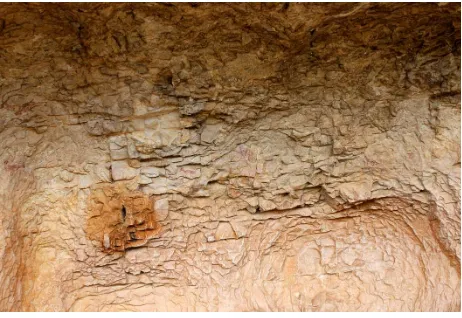
As part of the metric survey, a set of high resolution images were taken with the Canon EOS-1Ds Mark III digital camera. A detail of one of the pictures is displayed in Fig. 3. These images were used to deliver both high resolution and high accuracy 3D point clouds from which motifs would be recreated as accurately and realistically as possible, as recommended by Domingo et al. (2013), to facilitate the understanding of the rock art with the rock surface.
Figure 3. Example of high resolution image used to create high resolution point clouds of certain areas within Shelter IV The International Archives of the Photogrammetry, Remote Sensing and Spatial Information Sciences, Volume XL-5/W7, 2015
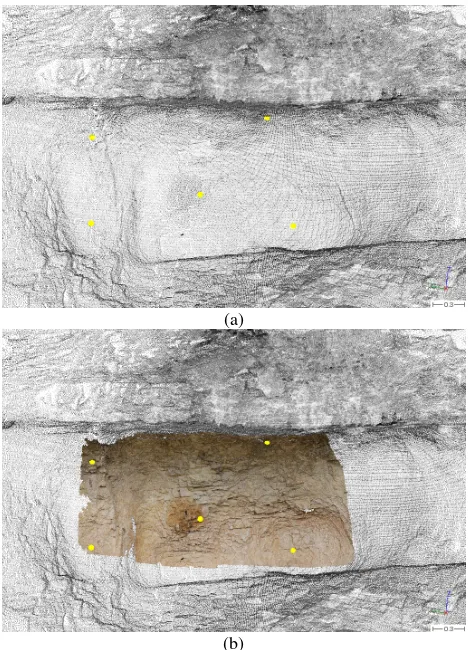
An overall root mean square error (RMSE) of 2 mm was achieved in the registration of the four scans in 3DVEM – Register. Fig. 4 displays the two datasets, one derived from the laser scanning survey and the other from the photogrammetric survey.
Figure 4. Input datasets: in grayscale, registered laser scanning point cloud data; in colour, photogrammetric point cloud.
2.1.2 Fusion: Five homologous (matching) points were identified to carry out the fusion between both datasets. They are presented in yellow in Figs. 4 and 5. The results of the 3D transformation adjustment in 3DVEM – Register GEO are presented in Fig. 6. It is worth noticing that despite the RMSE is negligible, standard deviation errors still exits for both rotations and translations. These estimates are crucial to confirm the validity of the merging process.
(a)
(b)
Figure 5. Set of homologous points (in yellow) measured to merge both datasets: a) laser scanning point cloud data (in greyscale); b) integrated dense colourful photogrammetric point
cloud.
Figure 6. Results of the 3D transformation adjustment in 3DVEM – GEO in the global Cartesian coordinate system
2.2 Petra archaeological site
For the Petra archaeological site in Jordan, in particular the Obelisk Tomb and the Bab As-Siq Triclinium (Fig. 7), control points (in the form of targets) were placed and distributed across the monument. Afterwards, terrestrial imagery were acquired on site from which dense photogrammetric point clouds and eventually 3D models were achieved and merged with additional terrestrial laser scanning surveys. Information about the effective integration of photogrammetry and laser scanning to document both monuments can be found in Lerma et al. (2011). UTM cartographic coordinates of the control points (targets) were provided in the ellipsoid World Geodetic System 1984 (WGS84).
Figure 7. The Obelisk Tomb and the Bab As-Siq Triclinium in Petra
In order to merge the relative photogrammetric dataset (local reference system) and the control points (UTM reference system), eight signalised homologous points were used. The results achieved with the Adjustment command in 3DVEM – GEO are presented in Fig. 8, after deactivating one control point (Point 1009) due to large errors in the 3D transformation. The International Archives of the Photogrammetry, Remote Sensing and Spatial Information Sciences, Volume XL-5/W7, 2015
Figure 8. Results of the 3D transformation adjustment in 3DVEM – GEO in the UTM coordinate system
2.3 Architectural monument
An easy solution after a complex survey inside the Reconditorio (13th century occluded room attach to the upper side of the sacristy, measuring 3.2 m (L) x 2.5 m (W) x 4.7 m (H)) in the Cathedral of Valencia is presented next. The mission was to fuse a vaulted 3D model of the roof onto a 2D CAD of the same room. For this merging process from 3D to 2D, two tie points (Fig. 9) were measured on the model (with 3DVEM – 3D Viewer, Editor & Meter). The steps of the 3D command interface in 3DVEM – GEO are presented in Fig. 10, where first the first point is translated 10 m in X, Y and Z-axes, and second both tie points are used to set the X axis, from 1st to 2nd. The mathematical results of the 3D transformation are presented in Fig. 11.
(a)
(b)
Figure 9. Vaulted 3D model: a) raw (used tie points in red); b) registered and aligned 3D model along the X axis
Figure 10. 3D transformation in 3DVEM – GEO: Main window
Figure 11. Exterior orientation parameters and transformed coordinates after carrying out the 3D transformation with
3DVEM – Register GEO
2.4 General purpose 3D object’s positioning
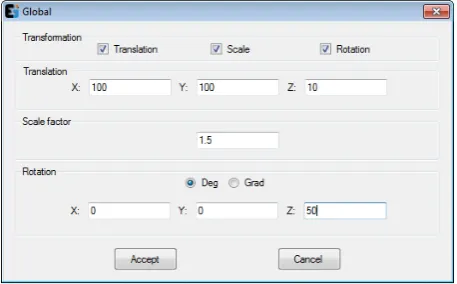
Image-based photogrammetric computer vision solutions based on SfM as well as any other local/relative measuring techniques are rarely positioned globally. Furthermore, control points are not always available. In case they were, the Adjustment command presented in Section 2.2 would fit best the 3D transformation. On the contrary, constant constraints (instead of control points) may exist in the form of position/translation, scale and rotation (Fig. 12). For these kinds of case studies, simple tools are required to either translate, scale or rotate a whole data set. This Global solution is particularly useful to information users used to record with easy devices such as rulers, GNSS navigators and compasses in smartphones, plumb-lines, etc.
Figure 12. Global transformation in 3DVEM – GEO
For instance, the constant values presented in Fig. 12 correspond to the values required to rotate 50º around the Z axis, scale 1.5 times the input data, and move a 3D point cloud/model to the global position (100, 100, 10).
3. DISCUSION AND CONCLUSION
The set of case studies presented in this study represent a small example of possibilities related to the effective 3D transformation of digital 3D objects/models/point clouds. The gamut of devices and technologies that rely on 3D measurements is steadily increasing.
In the market there are many tools able to handle 3D transformations to fuse datasets from diverse sources. However, not all of them provide an integrated range of possibilities to georeference datasets under different circumstances. Furthermore, there is a significant smaller number of software solutions when these datasets have to be integrated accurately into cartographic coordinate systems such as the UTM coordinate system. In fact, the fusion of data acquired from different devices is usually not well-understood, and many systematic errors are derived from highly accurate recording technologies.
The powerful, low cost and easy-to-use 3DVEM – Register GEO is launched to help both information users and information providers to handle 3D data from different sources into common Cartesian/cartographic coordinate systems. The software offers maximum flexibility to the user to fuse and merge data from different sources, applying not only simple (and useful answers) but also sophisticated ways with estimates, which are carefully integrated into a common user interface.
Further tests will be carried out in the future to confirm the fusion performance under challenging scenarios.
ACKNOWLEDGEMENTS
The authors acknowledge the research project HAR2014-59873-R from the Spanish Ministerio de Economía y
Competitividad.
REFERENCES
Artese, S., Altomare, C., Lerma, J.L., Zinno, R., 2014. Terrestrial laser scanning registration analysis and its effects on a masterpiece dome. EuroMed 2014 Proceedings, pp. 89-99.
Becerik-Gerber, B., Jazizadeh, F., Kavulya, G., Calis, G., 2011. Assessment of target types and layouts in 3D laser scanning for registration accuracy. Automation in Construction, 20(5), pp. 649-658.
Besl, P.J., McKay, N.D., 1992. A method for registration of 3-D shapes. IEEE Transactions on Pattern Analysis and Machine
Intelligence, 14(2), pp. 239-256.
Böhler, W., 2006. Comparison of 3D laser scanning and other
3D measurement techniques. Taylor & Francis, London, pp.
89-100.
Deng, F., 2011. Registration between Multiple Laser Scanner
Data Sets. Laser Scanning, Theory and Applications, InTech,
pp. 449-472.
Domingo, I., Villaverde, V., López-Montalvo, E., Lerma, J.L., Cabrelles, M., 2013. Latest developments in rock art recording: towards an integral documentation of Levantine rock art sites combining 2D and 3D recording techniques. Journal of
Archaeological Science, 40(4), pp. 1879-1889.
Fabado, S., Seguí, A.E., Cabrelles, M., Navarro, S., García-De-San-Miguel, D., Lerma, J.L., 2013. 3DVEM Software Modules for Efficient Management of Point Clouds and Photorealistic 3D Models. In: The International Archives of the Photogrammetry, Remote Sensing and Spatial Information
Sciences, Vol. 40, Part 5/W2, pp. 255-260.
Lerma, J.L., Navarro, S., Cabrelles, M., Seguí, A.E., Haddad, N., Akasheh, T., 2011. Integration of laser scanning and
imagery for photorealistic 3D architectural documentation.
Laser Scanning, Theory and Applications, InTech, pp. 414-430.
UNESCO, 1998. Rock Art of the Mediterranean Basin on the Iberian Peninsula. http://whc.unesco.org/en/list/874 (3 Jul. 2015).


