Vol. 43 (2000) 223–238
Keeping up with the Joneses: competition and
the evolution of collusion
Huw David Dixon
∗Department of Economics and Related Studies, University of York, Heslington, York YO 1 5DD, UK
Received 10 May 1999; received in revised form 13 December 1999; accepted 14 December 1999
Abstract
An economy consists of many markets, each of which is a duopoly. Firms must earn normal-profits in the long-run if they have to survive. Normal-profits are interpreted as the long-run limit of average profits in the whole economy. We adopt an aspiration based model of firm behaviour, linking it to the economy with the requirement that in the long-run, the profit aspiration must be at least as great as normal-profits. We assume that the joint-profits can be maximized with symmetric payoffs, and with very few other assumptions are able to show that the (almost) global attractor is the cooperative outcome. © 2000 Elsevier Science B.V. All rights reserved.
JEL classification: L13; D4; C7
Keywords: Aspirations; Learning; Evolution; Average-payoff
1. Introduction
“The best monopoly profit is a quiet life” Hicks (1935).
“This is the criterion by which the economic system selects survivors: those who
realize positive profits are the survivors; those who suffer losses disappear” Alchian
(1950, p. 213)
It has long been argued that firms must earn at least normal-profits to survive in the
long-run.1Failure to achieve this will activate some market mechanism such as bankruptcy,
the possible replacement of managers by shareholders, or takeover. In general, we can think of the mechanisms as reflecting the operation of the capital market in its widest sense.
∗Tel.:+44-1-904-433788; fax:+44-1-904-433759. E-mail address: [email protected] (H.D. Dixon).
1There are obvious exceptions here, such as non-profit organisations and owner-managed firms. We are
consid-ering the “typical” managerial public corporation.
The capital market reflects the aggregate performance of the economy as represented by average profitability. In this paper the level of normal-profits is taken to be the average level of profits in the economy and explores the implications of this hypothesis in the context of an economy consisting of many oligopolistic markets. Under fairly general assumptions
there are powerful long-run forces pushing the firms in each market towards collusion.
What differentiates the approach here is that the evolution of the economy is inherently social, in that it is the level of average profits in the whole economy over time which drives the behaviour of firms.
We model the behaviour of firms using an aspiration based model of bounded rationality. Firms at any time adopt a pure-strategy. If they are achieving their aspiration level, then they are likely to continue with the same strategy (Hick’s “quiet life” alluded to in the opening quote). If however, they are below their aspiration level then they are likely to experiment and try something new. This approach has been put forward both as a good model of
individual decision making in the mathematical psychology literature Lewin (1936) and
Siegel (1957) and as a model of organizational decision making with relevance to the firm Simon (1947,1981), Cyert and March (1963) and Kornai (1971). Furthermore, we adopt a formulation which allows the aspiration level to be endogenous (as in Borgers and Sarin, 1997; Karandikar et al., 1998; Palomino and Vega-Redondo, 1999), reflecting the past and the current profitability of the economy.
The key feature of this paper is to link together the aspirations of firms with the level of normal-profit by requiring that in the long-run the aspiration level of all firms is to have at least normal-profits. The structure of the economy envisaged is that of an economy consisting of a large number of identical duopolies. Firms have a finite strategy set, and we need assume very little about the structure of the payoff matrix of the constituent duopoly game, except that the joint-payoff can be maximized by a payoff-symmetric outcome. We need to make some assumptions about aspirations and experiments: if firms are achieving their current aspiration level, then they do not experiment, whilst if they are below aspiration they do. In the case that firms decide to experiment and try out a new strategy, we need assume only that the probability of choosing any particular strategy is bounded away from zero over time.
The main result of the paper is Theorem 1, which states that the collusive (joint-profit maximizing) outcome is the (almost) global attractor for this economic system. What is
novel about this result is that cooperation is not only possible, but almost inevitable. In the
case of the Prisoner’s dilemma the dominant strategy of defection will disappear, and all firms will end up cooperating.
The intuition behind this result is that if one or both firms is behaving competitively, then one or both of the firms will earn relatively low profits and experiment. The only state of rest is where both firms in an industry are earning at least average profits: in the long-run, this can only happen if all firms in the economy are collusive. If a firm deviates from the collusive outcome, there is a sense in which it will be “punished” as the other firm searches for an acceptable outcome. Hence the profitability of short-term deviations from collusion is not sufficient to undermine it in the long-run.
between firms in particular markets. Rather, it is the economy-wide social pressure of the capital markets forcing firms to earn average profits in the long-run that enforces collusion. In Section 2 of the paper, we outline the basic model in terms of payoffs and strategies. In Section 3, we consider how the economy/population evolves over time, and state the main results. Section 4 explores two examples: the PD and Cournot duopoly. In Section 5, I consider an example to explore the model when payoffs are not quite symmetric: if we allow for aspirations to be a little below average, then collusion still has a large basin of attraction (although other attractors will exist). In Section 6, I discuss the recent related literature, and then conclude.
2. The model
Time is discrete and eternal, witht = 0, . . . ,∞. There are K pure-strategies, k =
{1, . . . , K}.Π is theK×K matrix of payoffsπij, whereπij is the payoff when strategy
iplays strategyj. We can define the set of pairs of strategies asL: whereL ≡ {(i, j ) :
(i, j )∈ {1,2, . . . , K}2andi ≤j}, so thatL=#L= 1
2K(K+1). Elements ofL(r, q ∈
L)may sometimes be referenced by the underlying pair (i, j ).Ais the set of subsetsA
ofL:A≡ {A:A⊆L}. In particular, the set of payoff-symmetric pairs is Sym ≡ {q ∈
L: πij =πji}. The average payoff earned by a pairq is:π(q)≡ 12(πij+πji). Define (a)
Maxav=maxq∈Lπ(q), (b)2 Π S=maxq∈Symπ(q), (c)S=arg maxq∈Symπ(q).
Assumption 1 (A1). Π S=Maxav.
Assumption 1 requires that the maximum joint-payoff can be attained at a payoff-symmetric pair of strategies. For example, consider the standard Prisoner’s dilemma (PD) with
Π =
2 0
a 1
where 2 is the cooperative payoff, 1 the payoff when both defect, 0 the sucker’s payoff anda > 2 the double-crosser’s payoff. A1 is satisfied ifa ≤ 4: that is the combined defect/sucker payoff is less than the combined cooperative payoff. This is of course the standard assumption in the PD. In fact, if we consider any symmetric payoff function
U (x, y), wherexandybelong to a compact strategy setX⊂Rand generateΠby taking
a finite subset ofX(e.g. constructing a grid), then A1 is satisfied ifUis strictly concave.
The economy consists of a continuum of marketsλ∈[0,1], each consisting of a duopoly.
Jt(A, λ)is a characteristic function, such thatJt =1 iff duopolyλis playing some pair
q ∈Aatt, which defines the Borel measurePt :A→[0,1]
Pt(A)≡
Z 1 0
Jt(A, λ)dλ
Pt(A)gives the proportion of markets that have duopolies of typeq ∈Aat timet.
The average level of profits att in markets with pairq ∈Ais3
¯ Πt(A)=
X
q∈A
Pt(q)
π(q) Pt(A)
The average level of profits in the economy att isΠ¯t = ¯Πt(L).
2.1. Aspirations and learning
In any one period, a firm plays a pure strategy. As in the Atkinson and Suppes (1958)
“finite Markov model” there is a probability that at timet +1 the firm will switch from
the strategy it plays att: the key difference with the present paper is that we use an explicit
aspiration based model.
Each firm follows the following simple learning rule. It has an aspiration levelαt. If it is
earning less thanαt, then it decides to experiment with probability 1; if the firm is earning
at leastαt, then it will continue with the existing strategy. In this paper, we assume that all
firms share the same aspiration level, with the aspiration level satisfying the condition that in the long-run it has to be no less than average profits. This seems a reasonable assumption reflecting the role of capital markets in industrialized economies.
Assumption 2 (A2). There exists{νt}such thatνt ≥0,νt →0 ast→ ∞and
αt ∈[Π¯t −νt, Π S]
One possibility satisfying A2 is to have αt = ¯Πt (Dixon, 1995). The upper bound
is imposed because it ensures that aspirations are not overoptimistic: under A1 it is not
possible for all firms to earn overΠ S. The results of this paper would not hold if firms had
aspirations which were in excess ofΠ Sin the long-run (e.g. if firms aspired to the highest
payoff achieved in the past by an individual firm, this might well exceedΠ S).4
Given that a firm decides to experiment, we can define its conditional switching
proba-bilities:st(i, g)is the periodtprobability that a firm switches from strategyito strategyg,
conditional upon deciding to experiment. These probabilities will reflect the learning pro-cess of the firms: it could be based upon imitation, best response or random noise or some mixture. The only restriction we put on switching behaviour is that switching probabilities are bounded away from 0.
Assumption 3 (A3, Conditional switching probabilities). There existsγ >0 such that for alli, g∈ {1, . . . , K}, t =0, . . . ,∞,st(i, g)≥γ >0.
The assumption that switching probabilities are bounded away from zero captures the notion that there might be some noise in the switching process. Since this can be arbitrarily
3For convenient shorthand, I representP
t({q})asPt(q), the proportion of markets adopting actions in the
singleton set{q} ∈A.
small, we do not consider this to be a demanding assumption. Whilst we assume for sim-plicity that all firms have the same aspiration level and conditional switching probabilities,
the results go through if we allow for firm specific attributes.5
Whilst we have interpreted switching behaviour as the same firm in two periods changing behaviour, the formal model would be exactly the same if we think of a different firm in each period. For example, a firm in a particular market might exit (due to bankruptcy or death). In this case the switching probability would pertain to the “place” of the firm: the probability that next period the firm taking the place of the existing firm would play a particular strategy.
3. The evolution of the population
At any time t, we can divide the set of markets into two groups: (i) AAt the “above
aspiration” markets and (ii) BAt the “below aspiration” markets in which one or both firms
have profits strictly below aspiration. Since the payoffs of each firm are determined by the pair of strategies played at its market, we can classify markets according to the pair of strategies played at that market
AAt = {(i, j )∈L:πij≥αtandπji≥αt}, BAt =L−AAt
Sinceαt may vary with time, the set of pairs AAt ⊆Lwill in general vary over time.
The two subsetsSand Sym are time invariant. Clearly, under A1 and A2,S⊆AAt for all
t. Furthermore, define BSymt ≡BAt∩Sym.
The evolution of the population is captured by the proportion of markets that belong
to strategy pairs in these sets: in particular,Pt(S)is the proportion of industries which are
collusive at timet. Under A1 and A2 the sequencePt(S)satisfies some important properties.
First note that (a) there existsP∗∈[0,1] such thatPt(S)→P∗and (b) ifPt(S) >0 for
somet, thenPτ(S) >0 forτ ≥t andP∗>0. These both stem from the fact thatPt(S)
is monotonic and bounded. Monotonicity follows since once an industry is colluding, its profits must be at least equal to the economy average (A1) and hence they do not switch strategy (A2).
We first prove that the proportion of industries with one or both firms below aspiration
Pt(BAt)tends to zero fast enough.
Lemma 1 (based on A1–A3). P∞t=0Pt(BAt)is bounded.
Proof. First, we establish thatPt(BSymt)→0. Consider the change in the proportion of
firms in duopolies with strategy pairs inS,Pt(S)−Pt−1(S). This change is the result of
5In a longer and more general version of the paper (CEPR Discussion Paper 1810, same title) I allowed for
inflows: a lower bound on inflows isγ2Pt−1(BSymt−1)(from A2 and A3 and the definition
finding a lower bound for inflows, and an upper bound for outflows into Sym
Pt(Sym)−Pt−1(Sym)≥γ2Pt−1(BAt−1)−Pt−1(BSymt−1)
The lower bound for inflows comes from the fact that if at least one firm is belowαt, it
may experiment and choose the same strategy as its competitor (A3): if both experiments
they may choose a payoff symmetric pair with a probability of at leastγ2. The upper bound
on outflowsPt−1(BSymt−1)is based on the assumption that all industries in the subset
BSymt−1leave Sym. Hence:
Lemma 1 states that the proportion of markets where one or both firms are below least as-piration tends to zero. The reasoning here is in two stages. First, consider payoff-symmetric markets with both firms below aspiration: some of these will become collusive, and since
Pt(S)is bounded it follows that the proportion of payoff-symmetric pairs must go to zero.
The second step is to show that for the proportion of payoff-symmetric pairs to go to zero, so mustPt(BAt).
Theorem 1 (based on A1–A3). IfPt(S) >0 for some t, then ast→ ∞:
1. Pt(S)tends to 1,
2. Π¯ttends toΠ S.
Proof. 6 From the definition for average profits, for allt:
¯
Πt = ¯Πt(L)=Pt(S)Π¯t(S)+Pt(AAt −S)Π¯t(AAt−S)+Pt(BAt)Π¯t(BAt) (1)
6Theorem 1 can also be proven using standard results in the Theory of Markov Processes (see, e.g. Futia, 1982,
By definition,Π¯t(AAt−S)≥αt, and from A2αt ≥ ¯Πt−ηt, so that whenPt(S) >0
(1) becomes
¯ Πt ≥
Pt(S)Π S+Pt(AAt−S)ηt+Pt(BAt)Π¯t(BAt)
1−Pt(AAt−S)
(2)
SincePt(S)+Pt(AAt−S)+Pt(BAt)=1, and the limit ofPt(S)isP∗>0, and of
Pt(BAt)is 0 (Lemma 1), the limit ofPt(AAt−S)=1−P∗. Hence (2) implies
lim inf
t→∞Π¯t ≥Π S
Since lim supΠ¯t ≤Π Sit follows that limΠ¯texists and equalsΠ S, withP∗=1.
The intuition behind Theorem 1 is fairly clear. The pair(s) S is an absorbing state in the Markov process. From Lemma 1, the proportion of firms with one or more firms below aspiration will tend to zero, so that all firms will be at or above average profits. The only
way that this is possible is to have all firms earningΠ S. We requirePt(S) >0 for some t
in order to avoid the process getting stuck at a position where all markets earn exactly the
average at a level belowΠ S. In Section 4, we examine the Prisoner’s dilemma and Cournot
duopoly to illustrate each of these points in a concrete way.
Whilst the intuition is fairly clear, the exact evolution ofPtandΠ¯tis open to a wide variety
of possibilities under A1–A3. In particular, the path of both can be highly non-monotonic, and Theorem 1 does little to tie down the nature of the path towards the long-run stationary state. This would require the examination of specific models for the evolution of
aspira-tions and the switching probabilities.7 However, Theorem 1 does establish the long-run
properties of a very wide class of learning processes.
One interpretation of the result is a model of group selection. However, it should be noted that individual firms cannot choose whom they play against: they can only choose their own behaviour. Groups are selected, but only indirectly by the market mechanism: in duopolies that are too competitive, profits of one or both firms are eventually below aspiration, becom-ing unsustainable. Thus the process outlined in this paper can be interpreted as one where nature (the economy) selects the optimum degree of competitiveness (the cooperative solu-tion). Note that Alchian’s original argument (1950) (quoted at the opening of this paper) was conducted at the level of the individual firm: either the atomistic competitor or a monopoly. However, in duopoly the individual firm’s profits depends upon the joint-strategy of the firms: hence it is the joint-strategy that is chosen. Whilst the motivation of our arguments is similar in spirit, the conclusions reached in a strategic environment are very different.
4. Examples: the PD and Cournot duopoly
In this section we will illustrate how the process described in this model operates in two concrete examples. First, the abstract but popular PD model. This is used in particular to
7In Dixon and Lupi (1996), we simulate in detail several different switching rules (imitation, best response,
Fig. 1. The PD withΠPDand 2< a <4.
show how the relaxation of any of A1–A3 means that the convergence to collusion might be overturned. Second, we use the more concrete example of Cournot duopoly to illustrate how the model works when there is random switching behaviour.
4.1. Prisoner’s dilemma
We consider two cases of the PD:
ΠPD=
2 0
a 1
, ΠPD∗ =
2 −a
a 1
wherea >2,k= {c, d},L= {cc,cd,dd},S= {cc},Π S=2,K =2,L=3. WithΠPD,
A1 is satisfied ifa ≤4: withΠPD∗ for anya >2.
The evolution of the population inΠPDcan be represented on the unit simplex in Fig. 1,
where each point represents a three-vector of proportions of markets playing each strategy pair. We represent the iso-average payoff loci on the simplex: these are linear and parallel since the average payoff is a linear combination of the payoffs for each strategy pair, with
slope 12(a−2).Π¯ = 12ais the dotted straight line passing through corner all-cd;Π¯ =2
passes through all-cc,Π¯ =1 passes through all-dd.
The dynamics of this system are straightforward. Average profits must lie in the interval
[1,2]. Except in the case where P (dd) = 1 andΠ¯t = 1, we thus have: AAt = {cc};
BSymt = {dd}; BAt −BSymt = {cd}. From any point except where P (dd) = 1, all
trajectories will lead to the apex whereP (cc)=1.
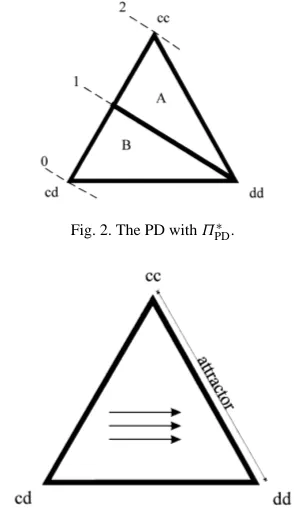
WithΠPD∗ the sucker-payoff is−a, so thatπ(cd)=0. This extends the possible range of
average profits to [0,2]. The iso-profit loci are downward sloping as in Fig. 2: the minimum
is represented by the dotted line through the cd vertex, and the maximum by the dotted line
through cc. The line passing through dd is theΠ¯ =1 line.
The dynamics here are different depending on whether the economy is in region A or B. In region A,Π >¯ 1, so that AAt = {cc}, BSymt = {dd}, BAt−BSymt = {cd}. In region
B,Π¯ ≤1, so that AAt = {cc,dd}, BAt = {cd}. With the simple learning model, only firms
playing c at cd markets will experiment, so that the trajectories must be horizontal lines in
B. Hence we can see why we need to assume thatPt(cc) > 0 for somet in Theorem 1:
Fig. 2. The PD withΠPD∗ .
Fig. 3. Best response experimentation with no noise.
Theorem 1 gives sufficient conditions for all-cc to be the attractor. We will now illustrate how dropping some of the key assumptions will open the possibility that all-cc ceases to
be the attractor. We have already seen whyP (cc) > 0 is necessary to rule out all-dd in
ΠPD∗ . Next consider a violation of A3: noiseless best-response experimentation, where firms
below aspiration switch to the best-response to their competitor. In bothΠPD∗ andΠPD,
the best response isd(the strictly dominant strategy). In this case the pairs divide into two
disconnected sets: there can be no flow into or out of{cc}, and{dd}is an absorbing state.
The only flows in this system are from{cd}to{dd}. The resultant dynamics are represented
in Fig. 3, where the attractor is the northeastern edge of the simplex, where there are no
{cd}markets. The paths to this are simply the horizontal lines: the economy starts off with
an initial proportion of{cc}markets, and eventually all the rest will become{dd}. However,
whilst the example of noiseless best-response experimentation is an interesting illustration of what can happen when A3 is violated, it is not at all robust. Any level of switching
noise8 γ >0, no matter how small, will lead to Theorem 1 becoming valid again, and{cc}
absorbing all markets, so long asPt(S) >0 for somet.
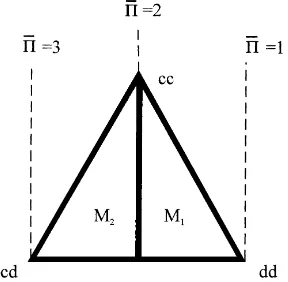
Lastly, what happens when A1 is violated? For simplicity, let us consider theΠPDpayoff
matrix, witha =6 so that Maxav=3> Π S=2. The iso-payoff loci in Fig. 4 are vertical,
passing through all-cd(Π¯ =3), all-cc(Π¯ =2)and all-dd(Π¯ =1). There are two different
8By this I mean that there is a probablityγthat the non-best responsecis chosen (possibly by mistake), so that
Fig. 4. Violation of Al PD withΠPDanda=6.
regions: in M1,Π <¯ 2, so that AAt = {cc}, BA= {dd,cd}; whilst in M2, AAt = ∅, whilst
BAt = {cc,dd,cd}. What exactly happens depends upon the exact switching technology.
With random switchingst(c, d) =st(d, c) = 21, the equilibrium is a point inM2where
P∗(cc)=0.125,P∗(dd)=0.5,P∗(cd) =0.375 withΠ¯ =2.125. There is a perpetual flow of markets between the three pairs of strategies.
4.2. Cournot duopoly
Perhaps the simplest economic application of our model is to Cournot duopoly
with-out costs, so that the two firms in any duopoly produce with-outputx andy, and the price is
P =max[0,1−x−y], and the profits of the firms are xP and yP, respectively. In this case we
have the set S with a unique element: it is the joint profit maximizing (JPM) pair where each
firm produces 0.25 (half of the monopoly output 0.5). Furthermore,Π S=Maxav=0.125,
so that A1 is satisfied. With the random switching rulest(i, j ) =1/K for alli, j, which
satisfies A3.
We9 allowed for 21 firm types. Choosing a grid of granularity 0.025 over the range10
0.1–0.6, perturbing it slightly by moving 0.325 to 0.333 (13), so that the Cournot–Nash
output was included. HenceK=21 andL=231. The simulations were initiated from the
initial position with a uniform distribution over all pairs. The results of the simulation are depicted in Figs. 5a and b. In Fig. 5, we see the path of average profits over time: in Fig. 5a the evolution of population proportions of the JPM market (0.125, 0.125) and the symmetric Cournot market are depicted (note that the proportions are measured on a logarithmic scale). From Fig. 5b, we see that the average profits converge to the symmetric joint profit maximum of 0.125. However, the time path of profits is non-monotonic: at particular times there appear large drops in profit. The reason for this is quite intuitive. As the average profit level increases, it surpasses that of one or both firms, which start to experiment. The profits of firms at those markets will then on average fall below the population average as
9I would like to thank Paolo Lupi for implementing these simulations for me in Gauss.
10We did not allow for a wider grid range (e.g. [0,1]), because the additional strategies are often ones with very
the firms disperse over some or all output pairs. The effect of this can be quite dramatic: the discontinuity is particularly large when a symmetric market goes critical, since both firms at each such market begin to experiment and spread across all possible output pairs. However, whilst the time-series of profits is non-monotonic and “discontinuous”, there is a clear upward trend and convergence to 0.125.
From Fig. 5a, the proportionP (S)is monotonic, but not smooth. Corresponding to the
discontinuous falls in population average profit, there are jumps in the proportion of firms at the JPM market, corresponding to the jumps in average profit. The proportion of firms
at the Cournot pair(13,21)is a highly non-monotonic time series. The first thing to note is
that in the initial stages of the simulation, the proportion of Cournot markets exceeds the proportion of JPM markets. This can occur because during this period the Cournot pair is
also in the set AAt: until average profits reach 19, the Cournot pair will “absorb” markets
from BAt. The fact that the Cournot pair attracts more than JPM is due to the fact that early
on more markets in BAtcan reach the Cournot pair than JPM. However, after 50 iterations,
the Cournot pair has a smaller proportion than the JPM pair, and is in BA most of the time. The time-series of the Cournot market type is not atypical: most pairs except JPM have a similar time-series profile. The convergence of the proportion of markets towards type JPM is steady but slow: this is because the probability of hitting JPM from other locations is small throughout the simulation: from each market in which both firms experiment there
is a probability of 4421 of moving to JPM. Convergence is in general quicker with fewer
strategies and non-random switching rules. We explore more specific rules in the Cournot model using simulations in Dixon and Lupi (1996).
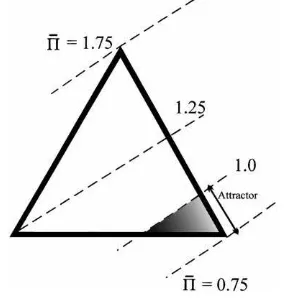
5. Asymmetric payoffs: an example
Whilst Theorem 1 holds for models where there are symmetric payoffs, in the sense that the payoff for an individual depends only on the strategies played and not the identity of a player. What if the payoffs are not symmetric? This has been analyzed for the case of an economy consisting of asymmetric Cournot duopolies in Cabelka (1999). In this paper, I will consider a simple example to illustrate some of the general issues raised. Consider a
perturbed PD in which the payoff of player B isεless than the other player A for any given
strategy pairing. For example, B might an inefficient firm. Denote the game as PD(ε)
2,2−ε 0,3−ε
3,−ε 1,1−ε
In this case,{cc}will not be an attractor under the dynamics of A1–A3. To see why, note
that if all pairs were playing{cc},then the average payoff would beΠ¯ = 2−12ε. The
inefficient firm would be earning below aspiration, hence under A2 it would experiment. One way to restore the result is to assume that the inefficient firm has lower aspirations:
this is not at all unreasonable if one thinks of aspirations coming from within the firm.11
11In fact, if we adopt the view the aspiration level reflects the external pressure from the capital market thenν
Fig. 6. The PD with an inefficient firm:ε=ν=0.5.
Let us amend A2 to allow for inefficient firms to have aspirations bounded away from the
average by someν >0.
Assumption (A2′). Letν≥0. For inefficient firms the aspiration level isαˆt = ¯Πt−ν; for
efficient firmsαt = ¯Πt.
This assumption reduces to A2 whenν=0. An exhaustive formal analysis of this model
lies beyond the scope of this paper. However, I will consider a special case wherev=ε=
0.5 with random switching. The unit simplex representing the population distribution is
shown in Fig. 6.
The iso-average profit lines are the same as in Fig. 1 witha =3, except shifted down
by 0.25 (12ε)to reflect the lower payoffs of inefficient firms. Let us consider each type of
industry pair:
• {c, c}This will be an absorbing state. Average profitsΠ¯ ≤ 1.75, so thatαˆ ≤ 1.25.
Inefficient firms will earn 1.5, which exceeds aspiration (efficient firms also earn above
aspiration of course).
• {c, d}. The cooperator will always be below aspiration and the defector always above as-piration irrespective of whether they are inefficient or not. Hence, with random switching,
50 percent of{c, d}industries will become{d, d}.
• {d, d}. Both efficient and inefficient firms will be meeting their aspiration ifΠ¯ ≤ 1: neither ifΠ >¯ 1. The inefficient firms earn 0.5, andαˆ ≤0.5 iffΠ¯ ≤1; efficient firms
earn 1 andα= ¯Π.
Hence for the shaded region in the bottom right corner of the simplex, whereΠ¯ ≤ 1
there is no flow out of{d, d}and only from{c, d}to{d, d}.Thus the northeast border of
the shaded area is an attractor for the shaded region, with the dynamic being horizontal, since the limiting distribution isP∗(cc)=P0(cc);P∗(dd)=1−P0(cc). ForΠ >¯ 1 (the
unshaded region), both types of firm wish to experiment in{d, d}industries: hence there is
a flow from{d, d}of 25 percent to{c, c}and 50 percent to{c, d}, and a flow of 50 percent
The size of the shaded area is determined by the size ofvandε: in the case wherev=ε,
asε→0 the attractor and its basin of attraction shrink to zero (as the iso-profit linesΠ¯ =1
andΠ¯ =1−12εwill converge). Hence if there is only a little asymmetry in payoffs, most
of the simplex will converge to collusion{c, c}.
This example illustrates the general point that the model can be adapted to allow for asymmetric payoffs and maintain the result that collusion has a large basin of attraction. The key point is that the assumption about aspirations needs to be altered to allow inefficient firms to earn below average, but not too much. Allowing aspirations to remain too far below average may well mean that a range of other attractors is introduced into the model.
6. Related literature
There are several recent papers related to ours.12 The closest is Palomino and
Vega-Redondo (1999). This paper considers a population of players who a randomly matched, and play the Prisoner’s dilemma. The mean payoff is known in each period, and this determines
the aspiration level.13 If a player is earning below aspiration with its current strategy,
then it switches with a positive probability to the other strategy. They find that for certain parameters, all paths converge to a situation with a strictly positive proportion of cooperators. Our paper differs in that we do not have random matching, and that we consider a very general class of games under A1 (of which the PD is one example).
Bendor et al. (1994) and Karandikar et al. (1998) both consider a two player game, where individual behaviour is driven by a similar aspiration based model. In Bendor et al. (1994) aspiration levels are constant over time, and they impose the condition that the
individual aspiration levels are equal to the long-run individual average payoff14 (consistent
aspirations); in Karandikar et al. (1998) aspirations can evolve, but are determined by
individual payoff histories. In both papers, there are multiple long-run equilibria, which in general include cooperative outcomes. The key difference between our own paper and these papers is the social dimension: here it is the population average which ultimately
determines the aspiration level.15
The local interaction literature ((Ellison, 1993; Oliphant, 1994; Ellison and Fudenburg, 1995) is similar in that here firms only interact with their market competitors. However, the key interactions in our paper are not only local, but also social via the population av-erage payoff. Our results hold even if the individual firms ignore the existence of their competitors, and consider themselves to be solving a non-strategic problem. This feature also differentiates our paper from other learning models (e.g. Blume and Easley, 1992; Marimom and Grattan, 1995). More similar to our approach are papers where there is global interaction through the population average action ((Banerjee, 1992; Canning, 1992).
12Chiappori (1984) also considers the issue of natural selection and optimisation. However, for him survival is
based on non-negative profits, not profits at or above average.
13In fact, they assume a partial adjustment model, so that the aspiration level changes in accordance with the
difference between the current level and average profits.
14“A minimal requirement for a model of endogenous aspirations is that in the long-run, aspirations should not
be out of line with the average payoffs accumulated from experience” ((Bendor et al., 1994, p. 9).
Lastly, there is a theoretical and experimental literature on learning in oligopoly settings (Kirman, 1995), which again focuses on isolated markets and does not have the social dimension.
One paper which derives a very different result to ours is Vega-Redondo (1997), which considers a single market and obtains the result that imitation of Cournotian competitors leads to the Walrasian outcome. The reason for this result is that it considers only a single market, so that the performance of a single firm is compared only to the performance of its competitors. Since more aggressive behaviour (i.e. producing a lager output) earns higher profits, firms will tend to increase output until the Walrasian equilibrium is achieved. This does not happen here because of the social dimension: the move towards more competition in one market would be prevented when profits fall below the average in the economy.
7. Conclusion
In this paper we have formulated a simple model of social learning which is based on an information structure and matching technology suggested by the economic application of oligopoly, and with a learning model in which aspirations are linked in the long-run to the population average payoff. The results of the paper are very simple and very powerful: the model predicts perfect collusion (cooperation), even in the case where collusion implies the use of a dominated strategy (as in the Prisoner’s dilemma). The model does not require strong assumptions on the learning process or payoff matrix, and Theorem 1 will certainly hold in symmetric versions of most economic models.
The results as derived depend on certain assumptions as sufficient conditions. Some of these are more crucial than others. The assumption that there is a continuum of markets and agents is not crucial: analogous result would hold if there were a finite number (see Cabelka, 1999). The assumption that the economy consists of many identical duopolies is more crucial. In Section 5, I considered an example with asymmetric payoffs: the results of Theorem 1 held in a modified form only after changing the assumption about aspirations. Whilst I would conjecture that the result is robust in a similar way to other generalizations, it
remains to carry out the formal analysis of the model under the assumption ofn-firm markets,
non-identical markets, and equilibrium under entry. Lastly, it would be very interesting to model the process of the capital market itself more explicitly.
Acknowledgements
References
Alchian, A., 1950. Uncertainty, evolution and economic theory. Journal of Political Economy 58, 211–222. Atkinson, R., Suppes, P., 1958. An analysis of two-person game situations in terms of statistical learning theory.
Journal of Experimental Psychology 55, 369–378.
Banerjee, A., 1992. A simple model of herd behaviour. Quarterly Journal of Economics 110, 797–817. Bendor, J., Mookherjee, D., Ray, D., 1994. Aspirations, adaptive learning and cooperation in repeated games.
CENTER Discussion Paper 9442.
Borgers, T., Sarin, R., 1997. Learning through reinforcement and the replicator dynamics. Journal of Economic Theory 77, 1–14.
Blume, L., Easley, D., 1992. Evolution and market behaviour. Journal of Economic Theory 58, 211–221. Cabelka, S., 1999. Keeping up with others in similar conditions; Evolving towards tacit collusion. Mimeo.
University of York.
Canning, D., 1992. Average behaviour in learning models. Journal of Economic Theory 57, 442–472.
Chiappori, P.A., 1984. Selection naturelle et rationalite absolue des enterprises, Revue Economique 35 (1), 87–107. Cyert, R., March, J., 1963. A Behavioural Theory of the Firm. Prentice-Hall, Englewood Cliffs, NJ.
Dixon, H., 1995. Keeping up with the joneses: aspirations and experiments without random matching. York DP 96/12.
Dixon, H., Lupi, P., 1996. Learning with a known average: a simulation study of alternative learning rules. In: Proceeding of the Third International Conference in Computing and Finance, Stanford, July 1997.
Ellison, G., 1993. Learning, local interaction and coordination. Econometrica 61, 1047–1071.
Ellison, G., Fudenburg, D., 1995. Word-of-mouth communication and social learning. Quarterly Journal of Economics 110 (1), 93–125.
Futia, C., 1982. Invariant distributions and the limiting behavior of markovian economic models. Econometrica 50, 377–408.
Hicks, J., 1935. Annual survey of economic theory: the theory of monopoly. Econometrica 3, 1–20.
Karandikar, R., Mookherjee, D., Ray, D., Vega-Redondo, F., 1998. Evolving aspirations and cooperation. Journal of Economic Theory 80, 292–331 .
Kirman, A., 1995. In: Kirman, A., Salmon, M. (Eds.), Learning in Oligopoly: Theory, Simulation and Experimental Evidence (Chapter-5).
Kornai, J., 1971. Anti-equilibrium. Elsevier, Amsterdam.
Lewin, K., 1936. Principles of Topological Psychology. McGraw-Hill, New York.
Marimom, R., Grattan, E., 1995. On adaptive learning in strategic games. In: Kirman, A., Salmon, M. (Eds.), Learning and Rationality in Economics. Blackwell, Oxford.
Oliphant, M., 1994. Evolving cooperation in the non-iterated Prisoner’s dilemma; the importance of spatial organisation. In: Brooks, R., Maes, P. (Eds.), Proceedings of the Fourth Life Workshop. MIT Press, Cambridge, MA.
Palomino, F., Vega-Redondo, F., 1999. Convergence of aspirations and (partial) cooperation in the Prisoner’s dilemma. International Journal of Game Theory, 28 (4), 465–488.
Siegel, S., 1957. Level of aspiration and decision making. Psychological Review 64, 253–262.
Simon, H.A., 1947. Administrative Behaviour: A Study of Decision-Making Processes in Administrative Organisations. Macmillan, New York.
Simon, H.A., 1981. The Science of the Artificial. MIT Press, Cambridge, MA.