1
MODELLING THE TENSILE BEHAVIOR OF
PLAIN CONCRETE
UNDER FLEXURAL LOADING
1A. L. Han, 2S. Tudjono and 3A.S. Pamungkas
1Department of Civil Engineering, Diponegoro University, Semarang, Indonesia
Email: [email protected]
2Structural and Material Laboratory, Diponegoro University, Semarang, Indonesia
Email: [email protected]
3Master program in Structural Engineering, Diponegoro University, Semarang, Indonesia
Email: [email protected]
ABSTRACT
The tensile behavior of plain concrete is customary assumed to be linear, and the stiffness modulus is approached by the value of the initial tangent stiffness modulus in compression. However, even two decades ago the contrary was proven by the experimental results on plain concrete in direct tension. The stress-strain behavior of concrete in tension was demonstrated to be highly non-linear, even at very low stress levels. One of the major difficulties in obtaining an accurate tensile stiffness response is to achieve a uniform tensile stress in the section, without creating stress concentrations at any point along the section. These stress disparities will lead to micro crack initiation and falsely recorded responses. A non-linear Finite Element Model (FEM) based on the anisotropic material approach, was developed to produce the load-displacement response of a concrete beam loaded with a two point loading system. The load-displacement curves and stress-strain curves were validated to laboratory tested specimens having identical material properties. It was shown that the stiffness behavior of plain concrete in flexure is non-linear, and follows a quadratic function. The research work also covered the evaluation of two failure criteria.
Keywords: tensile-flexure behavior, finite element modeling, anisotropy, load-displacement response
1 INTRODUCTIONS
Concrete is a non-homogeneous material consisting of the mortar matrix and the aggregates. The characteristics of this material exhibit a high compressive strength but a very low tensile strength. The low tensile strength of concrete initiates the formation of micro-cracks in the material. These micro-cracks result in a strain discontinuity and decrease the stiffness of concrete material. If a concrete structure is subjected to an incremental monotonic load, the cracks will propagate, and the stiffness of the material will decrease consequently.
Tensile failure of concrete is always a discrete phenomenon. It is therefore only possible to describe the tensile behavior of the un-cracked material using the stress-strain relationship in tension (CEB-FIB, 2010). It was found
that at stress levels of 90% to the tension strength ftm micro cracks significantly reduce the stiffness of the material (Hillerborg, 1983). In reinforced concrete analysis, it is customary to neglect the contribution of tensile capacity to a structure. This is due to the fact that the tensile strength is very low, measuring only about 10% if compared to the compression strength. In cracked section analysis, the tensile capacity is always neglected, because the tensile stresses induced by the flexural moment are detained by the bond between the concrete and reinforcement.
It is difficult to model an accurate constitutive stress-strain relationship in tension due to the limitation in available testing methods. Tensile testing methods readily accessible are: the direct pull-off test, the Brazilian splitting test, and the flexural test. Most codes of practice (CEB-FIB, 2010; Bamforth et al., 2008) present the relationship in a very simplified manner, either linear or bi-linear. The real tensile behavior of concrete is non-linear (Evans and Marathe, 1968; Maher and Darwin, 1977; Shah et al., 1995; Hillerborg et al., 1976) and even tension stiffening is suggested by researchers (Hu and Schnobrich, 1990; Vecchio and Collins, 1986; Chen and Saleeb, 1982). It is therefore important to construct a precise and accurate representation of the stress-strain relationship in tension.
Attempt has been made to precisely construct this stress-strain relationship of concrete in tension by construction a Finite Element Model (FEM). To analyze the accuracy and correctness of the written program, laboratory based specimens were prepared, and tested under the exact same loading condition as the FEM. The properties of the concrete material were obtained from laboratory tested specimen as well, and these data functioned as input to the FEM. The Visual Basic language was used to generate the program algorithms.
2 FINITE ELEMENT MODELLING
2.1 CONSTRUCTION OF THE FINITE ELEMENT MODEL
2.1.1 Failure Criteria
2 were considered, the Kupfer-Hilsdorf-Rusch’s failure envelope and the Mӧhr-Coulomb failure criteria.
Based on the principal stresses acting on a given Gauss point, the Kupfer-Hilsdorf-Rusch envelope (Kupfer et al., 1969) distinguishes the failure mode into three criteria: bi-axial compression, bi-bi-axial tension and compression-tension. The failure envelope of the bi-axial tensile stresses lies in the first quadrant of the envelope. A crack is formed when the principal major tensile strain exceeds the ultimate uni-axial tensile strain. The third quadrant is characterized by crushing of concrete, when all principal stresses are in compression. In this area, the confinement effect creates an additional increase in strength, reaching a value of 1.2 to the strength in uni-axial compression. The principal stress relationship in this zone is expressed by an ellipse and is expressed as:
�
���+���� − + ���� −���� = (1)
Where:
ɑ = fi (fcm) b = f2 (fcm) c = f3(fcm)
�� �� = � �� + ���+ � ��ℎ � = , , (2)
TABLE 1. Parameters for equation 2 (CEB-FIB, 2010)
i 1 2 3
ai 1.1496.10-4 1.7305.10-5 -1.1685.10-4
bi -0.0246 -0.00270 0.01830
ci 1.9955 0.80962 -0.23946
The second and fourth quadrants are the tension-compression regions. The tension-tension-compression region is the most intriguing, since the failure mode is defined by a combination of cracking in tension and crushing of concrete in compression. The bi-axial compression-tension failure envelope is simplified as a linear relationship which is expressed as:
� + [���
���] � = ��� (3)
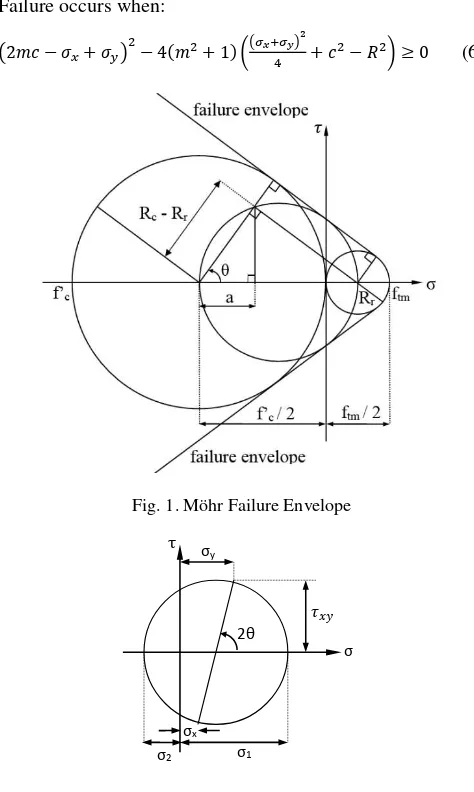
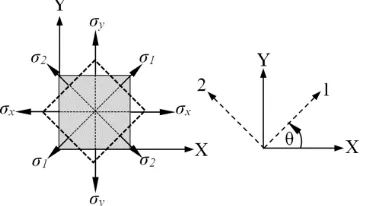
The Möhr criterion is represented by the envelope that describes the critical state of stresses over a range of differential stresses (Fossen, 2010). Two exact critical states of stresses in concrete are acknowledged, these are the uni-axial tension and the uni-uni-axial compression failure. Based on these two critical cases, the Möhr failure envelope is as shown in Figure 1. Failure occurs when the Möhr circle for a combination stress (Fig. 2) intersects with the boundaries of the failure envelope. For a bi-axial stress combination of ( 1, 1) and ( 2,2), the equation for the simplified envelope was written as (Tudjono et al., 2012):
τ = σ −στ −τ � + τ − � σ −στ −τ (4)
The equation was simplified as:
τ = � + (5)
Failure occurs when:
( − � + � ) − + ((� +� ) + − � ) (6)
Fig. 1. Möhr Failure Envelope
Fig. 2. Combination Stress 2.1.2 Material Behavior
Since the non-linearity of the FEM was based on the adjustment of the stiffness matrix, the material matrix was up-dated as a function of increasing stresses. The concrete constitutive stress-strain relationship was approach by the CEB-FIB 2010 code. The tangent stiffness method for defining the material stiffness E was chosen in modeling. Since this will create a negative value for the post-peak of the stress-strain curve, the formulation as proposed by Chen and Saleeb (1982) was chosen. The material matrix was written as:
[�] = [� �
� �
� �
�
] (7)
Where :
� =� +� + ��� � and � =�� � −�
(8)
E1 and E2 are respectively the modulus of elasticity in the major and minor principal strain directions. The
stress-σy
σx
σ
σ1 σ2
2θ
3 strain relationship of the material was based on the CEB-FIB 2010 for uniaxial compression and expressed as:
�
��� = − [ �.�−�
+ �− �] for ε ε� (9)
Where:
� = ��
�� (10)
∶ the plasticity number
� : is the initial tangent modulus = . ��� /
(GPa)
�� : is the secant modulus at peak stress (MPa) �� : is the strain at peak load (mm/mm)
For programming purposes, the strain and plasticity numbers are presented as a function of the compression strength and formulated as:
��= . for |��| (11) ��= − − |��| + . for < |��| < (12) ��= . for |��| (13) = − . |��| + . (14)
The stress-strain relationship in uni-axial tension is expressed as a bilinear relationship.
���= . |��| ⁄ for fcm ≤ 50 (15) ���= . . [ + . |��| + ] for fcm > 50 (16)
Where:
ftm : is the tension strength in uni-axial tension (MPa) fcm : is the peak stress of concrete in uni-axial compression (MPa)
2.1.3 Nonlinearity of Concrete
At early loading stages the material is considered isotropic, thus E1 = E2 = E0. At advanced loading stages, non-linearity was implemented by the introduction of the non-linearity index β (Ottosen, 1979). After cracking, the global axis was replaced by the local axis where the rotation angle between global and local axis depended on the direction of the cracked Gauss point under consideration. At this point the behavior was considered anisotropic. The stresses and strains were evaluated based on their local axes 1 and 2 (Fig.3). In programing, failure of Gauss points was modeled by introducing a significantly small number for the modulus of elasticity. A value to the power of minus six (10 -6) was considered appropriate to represent failure. This
technique was chosen to avoid a zero value for the determinant of the stiffness matrix.
Fig. 3. Global axes and local axes of elements
2.1.4 Algorithm to Terminate the Finite Element Program
The algorithms chosen for solving the stiffness matrix was the Gauss elimination. At every loading stage an iteration process was necessary to obtain a convergent state between the external and internal forces. Since an artificial Gauss failure was created by introducing a small number for the modulus of elasticity, a numerical representation was required to terminate the running of the program. Two methods were used simultaneously; the first by assigning a given value to define the singularity of the stiffness matrix, and secondly by mandating a maximum ratio of the (i+1)th displacement to the ith displacement.
3 EXPERIMENTAL TESTING
3.1 VALIDATION SPECIMENS
The test specimens for validating purpose were two concrete beams (A1 and A2) with a cylindrical compressive strength of 38 MPa. The beams had a cross-sectional dimension of 100 mm x 176 mm, and a length of 2000 mm. The cement was a PPC type 1 while the sand was a local product from the Muntilan, Central Java area. The coarse aggregate had a maximum size of 20 mm.
3.2 EXPERIMENTAL TEST SET UP
The beam was loaded with the two-point loading system, distanced at 640 mm from the center (Indriyanto and Pamungkas, unpublished). The beam was simply supported with bearings a distance of 1920 mm apart. The load was transferred to the beam via a steel WF beam functioning as transfer element. Load and displacement was measured using a load cell type CLC-500 kNA with a capacity of 500 kN and a sensitivity of 1.5mv/v and three LVDT’s type CDP-25M having a rated output of 10000x10-6 strain and a sensitivity of 2000x10-6 strain/mm. Type PLC-60-11 strain gauges were placed at the compression area of the beam as controlling element. All strain gauges, LVDT’s and the load cell were connected to the data logger type TDS-303. The detail of the test setup is illustrated in Figure 4.
4 4 RESULTS AND ANALYSIS
4.1 ANALYSIS TO THE DEVELOPED FEM
Due to the symmetric nature of the model, a half beam was constructed for the FEM. This was preliminary to reduce running time. The data such as concrete cylindrical compression strength f’cand Poisson’s ratio were inserted as input data. The compression strength was measured to be 38 MPa while a Poisson’s ratio of 0.2 was recorded. The FEM was meshed into a hundred elements, 25 in the direction of the X axes, and 4 in the direction of the Y axes (Fig. 5). The finesse degree for this meshing was obtained after running a series of sensitivity analysis on the model. A very fine meshing will result in a better representation of the beam, but will on the other hand increase the running time significantly. The sensitivity analysis was conducted by comparing the resulting ultimate loads and displacements. A convergence in outcome marked the minimum requirement of the meshing, necessary to represent the beam’s behavior correctly.
Fig. 5. FE beam under incremental loading
The resulting load-displacement response was presented graphically (Fig. 6).
Fig. 6. FEM result of load-displacement relationship in tension The stress-strain response at the node that represented the position of the strain gauge for the experimental specimen, was extruded from the FEM program, and represented graphically (Fig. 7).
4.2 EXPERIMENTAL RESULT
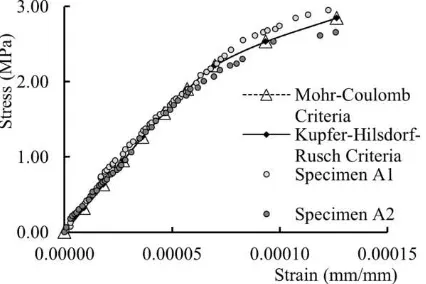
The corresponding load-displacement response and stress-strain response of the experimentally tested beams A1 and A2 were plotted graphically and are shown in Figure 8 and Figure 9.
Fig. 7. FEM result of stress-strain relationship 4.3 VALIDATION PROCEDURE
The FEM Program was validated to ensure its accuracy and correctness. The method chosen for this purpose was to superimpose the load-displacement curves and the stress-strain response resulted by the FEM program against the experimental data. For the load-displacement response, the horizontal axes represented the displacement in mm, and the vertical axes the load in kN, while for the stress-strain data, the horizontal axes stood for strain in mm/mm and the vertical axes for the stresses in MPa for the node under consideration. The dots were originating from the experimentally tested beams, while the curves stand for the FEM generated responses. The comparison of the load-displacement curves and the stress-strain curves are shown in Figure 8 and Figure 9 (Indriyanto and Pamungkas, 2013).
Fig. 8. Validation of load-displacement relationship
5
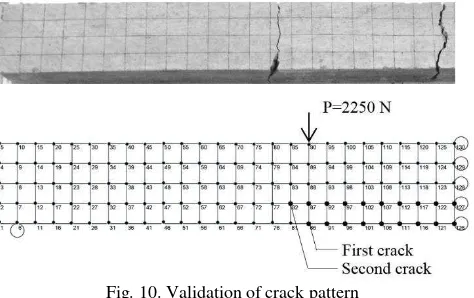
Visual comparison of the beam’s cracking pattern was
also accessed as validation tool. Fig. 10 shows the cracking of the experimental beam, and the crack initiation as predicted by the FEM program.
Fig. 10. Validation of crack pattern
4.4 EVALUATION OF THE PROGRAM BASED ON THE VALIDATIONS
The experimental data from specimens A1 and A2 showed only a small degree of deviation to one and another, from hereon it could be concluded that the specimens could serve as excellent validation tool to the proposed FEM.
The analysis of the load-displacement curves, stress-strain curves and the visual observation of the cracking pattern revealed that the developed FEM program was able not only to represent the behavior of a plain concrete beam under increased monotonic loading, but could also predict the crack initiation and propagation to a high accuracy degree. The ultimate load and displacements were correctly predicted by the FEM, and the obtained stiffness behavior of the beam reflected a very close representation to the actual behavior. As for the cracking pattern, the cracking of experimental specimens was initiated at the most extreme fiber in tension, at the center of the beam. The FEM weight shifted the extreme tension region to the center of the beam.
5 CONCLUSION
The flexural behavior of plain concrete subjected to a two-points loading system was modelled numerically. The result of the load-displacement and the stress-strain responses were validated to identical experimentally tested beams. This validation showed that the FEM constructed based on the constitutive model as mandated by the CEB-FIB 2010 was able to predict both the load-displacement and the stress-strain response in of a plain concrete beam in tension to a high accurate degree. The developed FEM program could thus serve as a sophisticated tool to analyze the tensile behavior of plain concrete.
The Möhr-Coulomb and the Kupfer-Hilsdorf-Rusch criteria resulted in similar outcomes both in terms of the
load-displacement, the stress-strain behavior and the cracking pattern of the beam, suggesting that both the failure envelopes represented the behavior of plain concrete correctly. It could be concluded from hereon that the models are most suitable for the utilization of FEM programs.
The inaccuracy in initial crack prediction resulted by the FEM could be corrected by introducing the self-weight of the beam as input to the program. However, the crack propagation was predicted correctly by the FE model, the cracks spread from the bottom fibers to the neutral axes of the beam, as was the case with the experimental specimen.
Non-linearity of plain concrete in tension under flexural loading was confirmed by both the FEM and experimental test results. An almost linear response was noticed at levels as low as 10% to the ultimate load, and prior to reaching Concrete Industry Publication (CCIP). ISBN 978-1-904482-39-0. in press.
2. Chen, W. F. and Saleeb, A. F. (1982). “Constitutive equations for engineering material, Vol. 1: Elasticity and modeling”, John Wiley and Sons, IBN 0-471-09149-9. in press. Institute of Technology, Lausanne, Switzerland. in press.
5. Fossen, H. (2010). "Structural geology", Cambridge University Press, ISBN 978-0-521-51664-8. in press.
6. Hillerborg, A., Modéer, M. and Petersson, P. E. (1976). “Analysis of crack formation and crack growth in concrete by means of fracture mechanics and finite elements”, Cement and Concrete Research, Vol. 6, No. 6, pp. 773-782. in press.
7. Hillerborg, A. (1983). “Analysis of One Single Crack”, in Fracture Mechanics of Concrete, Development in Civil Engineering 7, Elsevier Science Publisher, Amsterdam, editor: Wittman, pp.223-249. in press. 8. Hu, H and Schnobrich, W. C. (1990). “Nonlinear Analysis of
Cracked Reinforced Concrete” ACI Structural Journal, Vol. 87, No. 2, pp. 199-207. In press.
9. Indriyantho, B. R. and Pamungkas, A. S. (2013). "Study of rupture behavior by numerical simulation", Thesis, Civil Engineering Department, Diponegoro University, Semarang-Indonesia. unpublished.
10. Kupfer, H., Hilsdorf, H. K. and Rusch, H. (1969). “Behavior of concrete under biaxial stresses”, American Concrete Institute Journal Proceedings, Vol. 66, No. 8, August 1969, pp. 656-666. in press.. 11. Maher, A. and Darwin, D. (1977). “Microscopic Finite Element
Model of Concrete”, Proceedings of the First International Conference in Mathematical Modeling, St. Louis, Vol. III, pp. 1705-1714. in press. 12. Ottosen, N. S. (1976). “Constitutive model for short-time loading
of concrete”, ASCE Journal of the Engineering Mechanics Division, Vol. 105, No. EM1, pp. 127-141. in press.
13. Shah, S. O., Swartz, S. E. and Ouyang, C. (1995). "Fracture Mechanics of Concrete: Applications of Fracture Mechanics to Concrete, Rock and other Quasi-brittle Materials", John Wiley and Sons, ISBN 0-471-30311-9. in press.
14. Tudjono, S., Han, A. L. and Hariwijaya, L. H. (2012). “Reinforced Concrete Finite Element Analysis Incorporating Material Nonlinearity and Failure Criteria Aspects”, Applied Mechanics and Materials, Vol. 284-287, Innovation for Applied Science and Technology, pp. 1230-1234, www.scientific.net. in press.