HUMAN RESOURCE PERFORMANCES OF THE PLANTATION AND
WORKSHOP DIVISIONS IN THE TRACTOR READINESS SERVICE
FOR THE OPERATION OF SUGARCANE PLANTATION AT PT SWEET
INDO LAMPUNG
Kinerja Sumber Daya Manusia pada Divisi Plantation dan Workshop dalam Pelayanan Kesiapan Traktor untuk Operasional Perkebunan Gula Tebu
di PT Sweet Indo Lampung
1
Olivia Wibisono, 2Lestari Rahayu Waluyati, 2Dwidjono Hadi Darwanto
1
Sugar Group Company
2
Faculty of Agriculture, Universitas Gadjah Mada St. Flora Bulaksumur Yogyakarta
Diterima tanggal : 4 Mei 2017 ; Disetujui tanggal : 6 November 2017
ABSTRACT
The aims of this paper are to investigate the human resource performances at the workshop division in fixing damage tractors and to determine factors influencing their performances, and also to analyze the human resource performances on the plantation division in operating tractors to support the operation of sugarcane plantation. The survey method was conducted to collect primary data from the plantation and workshop divisions employees of PT Sweet Indo Lampung (PT SIL). Likert scale was applied to measure and determine variables of human resource performance and other relevant variables. Multiple linear regression models were used for the analysis measurement of human resources performances. The results show that human resource performances in the workshop and plantation divisions to operate tractors are in good category, but it still has to be improved. This includes the timelines to finish the work, obedience and loyalty of the employees, work planning and ability to manage the work. The factors that have positive influence on human resource performances are compensation, work environment, work relationship, and employee potential. The factor that has negative influence is expectation in developing performance. The longer time needed to repair the tractors was caused by the spare parts stock, number of mechanics that can handle the tractor, the workers skill and teamwork. Factors that cause damage on tractors are lack of maintenance, sloping area in
sugar cane plantation, and lack of operators skill.
Keywords : human resource, plantation, sugarcane, tractors
INTISARI
Workshop merupakan bagian penting dalam pengelolaan perkebunan gula skala luas yang mengandalka n mekanisasi, terutama dalam hal perawatan dan perbaika n traktor. Tujuan penelitia n ini adalah untuk mengetahui kinerja karyawa n workshop dalam memperbaiki kerusakan traktor dan faktor yang mempengaruhinya serta mengetahui kinerja karyawan divisi plantation dalam pengatura n penggunaa n traktor untuk kelancara n operasional kebun. Metode sur vey diguna ka n untuk menda pa tka n da ta primer kar ya wa n ba gia n
Olivia Esteevani Wibisono Lestari Rahayu Waluyati Dwidjono Hadi Darwanto
workshop da n plantation di P T Sweet Indo La mpung (P T SIL). Pengukur a n variabel kinerja karyawan dan variabel lain dalam penelitian ini dilakuka n dengan menggunakan skala Likert. Di lain pihak, pengukura n analisis variabel kinerja karyawan dan variabel lain dalam penelitian ini dilakukan dengan menggunakan analisis regresi linier berganda. Hasil analisis menunjukkan bahwa kinerja karyawa n di bagian workshop dan plantation yang terkait dengan traktor berada dalam kategori baik namun masih harus ditingkatkan la gi. F a ktor kompensa si, lingkunga n da n hubunga n ker ja , ser ta potensi ka r ya wa n ber penga r uh positif terhada p kinerja ka r ya wa n, seda ngka n ha r a pa n pengemba nga n kinerja berpengaruh negatif. Penyebab lamanya waktu penyelesaian perbaikan kerusakan traktor adalah ketersediaan spare part, kecukupa n jumlah karyawan, terutama mekanik, serta ketrampila n dan kerjasama tim. Penyeba b kerusaka n traktor adala h kurangnya per a wa ta n, sloping a rea da n kur a ngnya ketr a mpila n oper a tor. Kiner ja ya ng per lu ditingka tka n a da la h ketepa ta n wa ktu da la m penyelesa ia n peker ja a n, keta a ta n a ta u loyalitas, perencanaa n dan kemampua n mengatur pekerjaan. Peningkata n jumla h dan kualita s mekanik serta operator juga perlu diupayakan.
Kata Kunci : sumberdaya manusia, perkebunan, tebu, traktor
INTRODUCTION
Sugar Group Companies (SGC) is the Indonesian large company to produce sugar, bolstered by three main factories, that is, PT Gula Putih Mataram
(GPM), PT Sweet Indo Lampung (SIL),
PT Indo La mpung P er ka sa (ILP), and
one ethanol distillery company, i.e., PT
Indo Lampung Distillery (ILD). The total
area of the cane farm together with the factories is about 60,000 hectares, located in two regencies: Lampung Tengah and Tulang Bawang, in the Province of Lampung. Each sugar factory has its own organizational structure, but similar to each other, and they employ a total of about 50,000 permanent workers.
PT SIL manages a cane farm covering an area of about 22,000 hectares and composes of five plantation divisions. Each division manages about 3,000 –
The ratoon tally will determine the land area to be replanted; for example, in the case of three times ratoon, the land area that must be prepared for replanting is 20 – 25% from the total area in each division for RPC. For twice ratoon, the land area that must prepared for RPC is 35%. Hence, the higher the RPC percentage, the greater the land area should be prepared for replanting. To do so, tractors will be needed to work out the land mechanicaly. Consequently, the greater the land area to prepare for RPC, the higher the demands of tractor units. Actually, the tractors are mostly utilized to prepare the land. However, they also serve to distribute the fertilizer into the soil for the ratoon cane.
Generally, the needs for tractors in each division at PT SIL is about 20 units to pull the implements and 20 additional smaller tractors to support farm activities. The tractors’ working capacity depends on the farm activities; for instance, for plowing the soil to prepare an RPC of 15 hectares, it requires four tractors. In addition, for harrowing the soil, it needs two tractors in full capacity of 7 hours following the usual procedures in preparing the soil. The ratoon cane activities include cutting the stubbles, distributing the fertilizers into the soil and controlling the cane pest and diseases. Supporting tractors are also available as reserve. They are not used to
pull the implements and do not operate to prepare the soil. Therefore, these tractors have less problems and can work properly as needed.
When some tractors are broken, the functioning ones must replace them immediately. Recently, almost 50% of tractors at PT SIL are under maintenance. Thus, the well-functioning tractors must work in shifting. One operational shift for the tractor is 7 hours, so the second shift normally takes four additional hours of operation. This implies that one tractor may operate heavily for 11.5 – 12.5 hours/day, including a night shift (tractor is equipped with the light for night shift like regular car). Occasionally, some tractors are forced to operate for 3 shifts. The broken tractors should be sent to the central workshop which is located far from the plantation. To transport the broken tractor is time consuming since it must be towed by the other tractor, leaving its task to pull the implement. In turn, another tractor should replace them and is forced to work in 3 shifts a day. Consequently, the operator must also work more than one shift.
is about 6 months, including the factory maintenance. Consequently, this requires cane harvesting of about 100 – 125 ha/ day in order to achieve the same 6 months period of harvesting and milling.
R e c e n t l y, h o w e v e r , t h e c a n e production decreased and this implied to lower milling capacity due to lack of cane supply. For example, the dry season in 2015 caused a low cane production of about 60 tons/ha. Consequently, the milling period must be extended and some factories should work 10% longer than its usual capacity.
It is clear that the capacity of human resources in the plantation division plays important role to achieve the targeted production. In addition, it must be supported by the availability of main equipment, such as tractors that are provided by the workshop division. Accordingly, higher cane production and its sustainability require high performance as well in human resources in both workshop and plantation divisions.
Various aspects that may influence the performance of human resources considered in this work are the following: (a) employee’s potential, (b) employee’s skill and capability, (c) compensation and employee’s protection, (d) employee’s expectation, (e) working environment, (f) opportunity for employee’s development, (g) working period, (h) work attitude and work behavior, (i) work load, (j)
employee’s loyalty towards company, (k) work experience, and (l) education level. Therefore, to attain the right policies for human resources requires a thorough evaluation on every level in both workshop and plantation divisions.
Regarding the operation of plantation at PT SIL, in this work, we undertake to study in-depth the following questions: • How is the performance of the workshop
division to handle the broken tractors and what factors do affect them? • How i s t he performanc e of t he
plantation division to manage the use of tractors in supporting the field operation?
Masnuhardi and Setiaji (2004) analyzed that organization and compensation can increase employee’s productivity. Almigo (2004) found that the higher the employee’s satisfaction in their work, the higher their work productivity.
Subsequently, Siradjudin (2007) examined that (1) personal characters have a positive relationship on both work satisfaction and work motivation but not on work performance, (2) competent leaders give positive impacts on work satisfaction, work motivation, and work performance, (3) good leadership have positive impacts on work satisfaction, work motivation, and work performance, (4) leader’s communication ability has positive impacts on work satisfaction, work motivation and work performance, (5) work satisfaction has a positive relationship both on motivation and work performance, (6) work motivation has a positive impact on work performance.
A c c o r d i n g t o R i d j a l ( 2 0 0 6 ) , statistically, variables, such as rewards, social security, education level, skills, facilities, age, personal characters, attitude, and moral values give real influences on the work performance. Ade (2007) find out that salary raise, work environment, and the opportunity to perform well at work will be followed by employee’s high productivity.
The study performed by Insan (2008) using SEM (Structural Equation Modeling)
showed that innovative reward systems, work environment, work ability may significantly affect employee’s work motivation. In other words, good reward systems correspond strongly to an increase of their work motivation. Similarly, better work environments will surely create better work motivations and when the employees have higher motivation, this may acquire a good impact on work performance. When the employees have higher ability to work, they will lead to higher work performance, higher rewards, work configuration, better work environment, higher motivation, multitasking ability, and eventually the better work performance.
METHODS
The data acquired in this work were collected both qualitatively and quantitatively through surveying our respondents who involved in the tractor operations in both workshop and plantation divisions. Qualitative variables were measured by using Likert scale in the range of 1 – 3, where 1 = excellent, 2 = very good and 3 = good. Quantitative variables use units that correspond to the variable themselves.
Employee work performance measurement
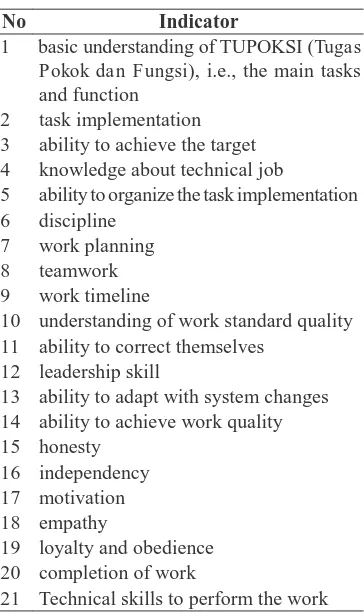
Table 1. Performance Indicator
No Indicator
1 basic understanding of TUPOKSI (Tugas Pokok dan Fungsi), i.e., the main tasks and function
2 task implementation 3 ability to achieve the target 4 knowledge about technical job
5 ability to organize the task implementation 6 discipline
7 work planning 8 teamwork 9 work timeline
10 understanding of work standard quality 11 ability to correct themselves
12 leadership skill
13 ability to adapt with system changes 14 ability to achieve work quality 15 honesty
16 independency 17 motivation 18 empathy
19 loyalty and obedience 20 completion of work
21 Technical skills to perform the work
These data were measured from our respondents and we made several tests to validate the data and their reliability.
Technical training
There are 6 indicators adopted in this work to measure the technical training. The first indicator is how the leader monitor and put attention to the employee to develop their work ability and working skills. The second indicator is how the leader gives the opportunity to the employee to participate in the technical training. The third indicator is how the leader gives the opportunity to the employees to develop and enhance their personality. The fourth
indicator in technical training is how suitable the material delivered according to the type of work. The fifth indicator is how the material of the technical training is delivered both from the inside and outside of the company. Finally, the sixth indicator is how the technical training develops their self-capability and improve the work quality.
Work environments
Work environment variables were measure d by adopti n g 4 indicator s including: (1) work physical environment and facilities provided by the company; (2) incentives and reward system; (3) loyalties to the company; and (4) job training in accordance with the type of work.
Work compensations
leisure activities provided by the company. The eight indicator is about the transport facility provided by the company. The ninth indicator concerns about the sport facility available for the employees. The tenth indicator asks about the religious facility from the company. The eleventh indicator interrogates the company policy about the retired compensation. The twelfth indicator is about the company policy on workplace accident insurance. The last indicator is about non-financial rewards.
Work relationship and communication
To measure the work relationship and communications, we adopted here 14 appropriate indicators that assess the relationship between leader and its employees as well as among colleagues. First indicator asks whether employees are willing to help each other when they encounter difficulties in their work. Second indicator is about workload distribution. Third indicator is how the leader guides and gives direction to the employees. Fourth indicator is how the leader conveys the message to the employees at work. Fifth indicator is how the leader appreciates and gives rewards to the good employees.
Next, for the sixth indicator, we measured the involvement of the employees in both formal and informal situation related to the job at the company. The seventh indicator is how the employees response to the policy made by the leader.
The willingness to accept advices from colleagues and leader is the eighth indicator. Next, we measured how they work together as a team in the ninth indicator. We also tried to measure how good the work relationship between leader and employee in the tenth indicator. Subsequently, the eleventh indicator measured whether the work environment is sufficiently pleasant and in harmony. The twelfth indicators concerns how adequate the company provides work equipment and facilities that may influence work relationship and communication. The thirteenth indicator is how the employees maintain good relationship with their colleagues. Finally, the last indicator examines whether they feel secure working at the company.
Work career development
There are 4 indicators in work career development measured for the employees: (1) the company provides the opportunity for career development; (2) the company provides the opportunity for personality development; (3) the company provides the opportunity for the employees to involve in work training to develop the technical skill; (4) the company provides the education for the employees.
Work quality
S their responsibility; (3) accordance of their experience with the task and their responsibility; and (4) accordance of their ages with the task and their responsibility.
Validity Test
Validity test is made to measure the level of validity of the instruments adopted in this work (Masnuhardi, 2004). The valid instrument will have high validity score, while lower score will show the less valid in the instrument. The criteria of hypothesis test on the validity test are:
1. When the r-square (corrected item total
correlation) is higher than the r-table,
= s t a n d a r d d e v i a t i o n o f t h e corresponding item score
= standard deviation of scale score
Reliability Test
Reliability test is made to measure how reliable the variables adopted for the questionnaire (Kurniawati, 2015). Basically, if the tests give similar results after several measurements to the same objects, then the results are considered reliable. Otherwise, if the results varied significantly, then they are not reliable. The reliability test utilizes the criteria of alpha coefficient score (α), as follows.
2
S 2 21 1 2
then the instrument is considered valid, 2. When the r-square (cor rected item instruments is determined by computing the corrected item-total correlation coefficient
reliability on some variables are considered: a. high when α > 0,50
= item-total correlation coefficient before being corrected
= item-total correlation coefficient after being corrected
0 1 X 3 4 5 performance development (4 items), the employee’s potential (4 items), are all valid. This is shown from the correlation score of each variable item with the error percentage in the range of 1% (***), 5% (**), or 10% (*). We note, however, that the work environment variable is not reliable because of the Cronbach Alpha score yields 0.283.
Multiple regression model was also applied to determine the influence factor on work performance of the employees and formulated as (Daywin, et al., 1999):
responsible for 3,000 – 5,000 hectares. Normally, every year about 35% or about 6,500 hectares of the land are used for replanting, and the remaining land, about 65%, is used for ratoon cane. Machinery activities are important for both replanting and ratoon cane.
Farm activities at the cane site strongly depend on the availability and the functioning of heavy equipment of tractor units. At PT SIL, the plantation division is either the tractors user or operator, while the workshop division is responsible to repair and maintain the tractor unit.
There are two type tractors used compact during the land preparation. work environment score, X
c o m p e n s a t i o n s c o r e , X
= work
= w o r k On the other side, medium tractors are used for land preparation before communication and relationship score,
= career development score, X = employee’s potency, education and work
planting the canes, such as plowing, harrowing, track marking, ripper and basal furrower. Presently, the number of experience score, a 1 8 …a = coefficients of
tractors available at the site is 10 units, regression, and ε = error.
RESULTS AND DISCUSSION
For the total area at PT SIL cane site that is about 20,000 hectares, activities until post harvesting in each farm should be performed by machinery equipment. As previously mentioned, PT SIL has five plantation divisions, and each division is
while the ideal number for the optimum operation (without counting any broken tractor) is more than 20 units.
Several factors that may cause damage for tractors and, thus, should be repaired at the workshop are the following: a. Old tractors are vulnerable and have
c. Operator’s skill d. Lack of maintenance e. Tractor brands f. Tractor accidents
g. The operational change from manual tractors into automatic (electronic) tractors
The damage tractors can be divided into two types, light to medium damage (electric, brakes, hydrolics) and heavy damage (engine, gear, transmission). The workshop division should also pay attention to the stock availability of their spare parts.
Respondent Characteristic
E m p l o y e e s w o r k i n g a t t h e workshop and plantation divisions are mostly male workers, and only 3.66% employees are female working at the administration division. About 82.9% employees are married with the number of family is 3 persons in average. Most of the employees are graduates from high school with the average age of 36.7 years old. Total length of working time for day workers is 8.2 years and for permanent staffs is 15.2 years.
Work Performance Factors
Employees Performance
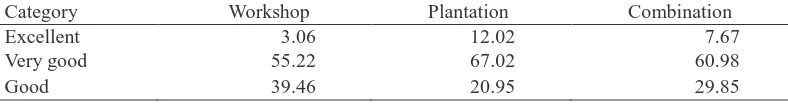
As mentioned previously, employee performances in operating and maintaining the tractors are measured by 21 indicators. The analysis results show that most of the employees qualifies as very good (see Table 2, workshop = 55.22%, plantation = 67.02%, and combination = 60.98%). Although in overall the employee performances are qualified in very good category, we found that some work performances still need more improvements. They include: (1) technical ability on the job arrangement, (2) work discipline, (3) the ability to work together as a teamwork, (4) self- improvement capability, (5) honesty and work intensively, (6) work independently, (7) empathy towards the leaders, employees and colleagues, and (8) the obedient towards the leaders.
Work Relationship
Work relationship was measured by 14 indicators that describe how the relationship was going between employees and t heir leader s and amon g t heir colleagues. The results show that the work relationship is in very good category (see
Table 2. Employee Performances of Workshop and Plantation Division (%)
Category Workshop Plantation Combination
Excellent 3.06 12.02 7.67
Very good 55.22 67.02 60.98
Good 39.46 20.95 29.85
Table 3, combination = 50.17%, workshop = 48.15% and plantation = 52.56%). Some indicators in work relationship that need to be improved are: (1) more attention to other colleague when they are in need while doing their job, (2) work delegation and distribution, (3) work relationship between
the leader and (4) working condition, (5) work relationship among the work colleagues.
Work Compensation
Wo r k c o m p e n s a t i o n f o r t h e e mpl o yee s i s consi dere d excel l en t
Table 3. Work Relationship Performances of Workshop and Plantation Division(%)
Category Workshop Plantation Combination
Excellent 21.28 20.51 20.91
Very good 48.15 52.56 50.17
Good 30.57 26.91 28.83
Source: Primary data analysis, 2017
Table 4. Work Compensation performances of Workshop and Plantation Division (%)
Category Workshop Plantation Combination Excellent 50.28 53.65 52.50 Very good 36.96 38.46 37.43 Good 12.76 7.88 10.32
Source: Primary data analysis, 2017
Tabel 5. Employees Technical Training performances of Workshop and Plantation Division
Category Workshop Plantation Combination
Excellent 50.41 17.79 33.54
Very good 35.37 49.31 42.48
Good 14.23 34.40 23.78
Source: Primary data analysis, 2017
Tabel 6. Employee Potential performances of Workshop and Plantation Division
Category Workshop Plantation Combination
Excellent 6.98 5.77 6.40
Very Good 59.30 67.95 63.41
Good 33.72 26.28 30.18
Source: Primary data analysis, 2017
Table 7. Employee performance Development of Workshop and Plantation Division
Category Workshop Plantation Combination
Excellent 56.40 23.08 40.55
Very good 28.49 44.37 36.28
Good 15.12 32.05 26.22
Table 8. Correlation test on the variables influencing the employees work performance
Variabel X1 X3 X4 X5 X6 X1 1.000 0.1359 0.1739 0.4806 0.0994 X3 0.135 1.000 0.4965 0.2844 0.3635 X4 0.173 0.4965 1.000 0.4773 0.5899 X5 0.480 0.2844 0.4773 1.000 0.2840 X6 0.099 0.3635 0.5899 0.2840 1.000
Source: Primary data analysis, 2017 Notes:
X1:technical training X3:work compensation X4:work relationship X5:work development X6:employees potential
(see Table 4, combination = 52.25%, workshop = 50.28%, and plantation = 53.65%). Some improvements needs to be conducted: (1) employees salary regarding the employees performance, (2) the work incentive system, (3) religious facility and (4) work retirement system. The variable of salary compared with the daily expenses is considered excellent (combination = 54.88%, workshop = 53.66% and plantation = 55%). Some suggestions from the employees to improve the work compensation is that the company should consider to increase their salary.
Technical Training
The technical training in the company is considered very good (see Table 5, c om bi na t i on = 42.48%, workshop = 35.37%, and plantation = 49.31%). Some variables that still need more improvements regarding technical training are (1) the
suitability on technical training and the type of work, and (2) how to deliver the material of technical training.
Employees Potential
In average, employees potential is in very good category (see Table 6, c om bi na t i on = 63.41%, workshop = 59.30%, and plantation = 67.95%. Some improvements suggested for the employees potential are the ability to accomplish the work and the employees responsibility.
Employee Performance Development
Table 9. Heteroscedasticity Test
Notes
F statistic 0.6999 Prob
F (5.74)
0.6252
Obs R 2 3.6127 Prob
chisquare (5)
0.6064
Scaled explained SS 5.1467 Prob
chisquare (5)
0.3982
F statistic 0.6999 Prob
F (5.74)
0.6252
Obs R 2 3.6127 Prob chisquare (5) 0.6064
Scaled explained SS 5.1467 Prob 0.3982
Source: Primary data analysis, 2017
chisquare (5)
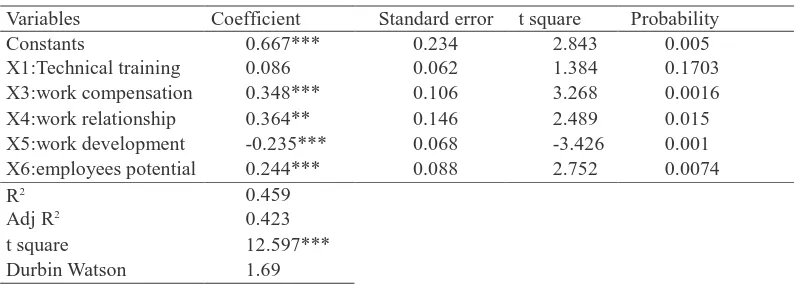
Table 10. Regression analysis result on employees work performance
Variables Coefficient Standard error t square Probability
Constants 0.667*** 0.234 2.843 0.005
X1:Technical training 0.086 0.062 1.384 0.1703
X3:work compensation 0.348*** 0.106 3.268 0.0016
X4:work relationship 0.364** 0.146 2.489 0.015
X5:work development -0.235*** 0.068 -3.426 0.001
X6:employees potential 0.244*** 0.088 2.752 0.0074
R2 0.459
Adj R2 0.423
t square 12.597***
Durbin Watson 1.69
Source: Primary data analysis, 2017
F a c t o r s I n f l u e n c i n g E m p l o y e e s
Performance Q
We also measured factors that influence employees work performance b o t h o n w o r k s h o p a n d p l a n t a t i o n divisions using the regression model of Ordinary Least Square (OLS). First, this regression model has no multicolinearity issue (see Table 8), that is, no strong correlation in the independent variables (r = 0.8 or more).
Second, this regression model has no heteroscedasticity issue (no constant
variance), as shown by the heteroscedasticity test in Table 9.
Third, the residual is normally distributed, as inferred from the insignificant Jarque Bera test. The regression analysis test result shows some factors, listed in Table 10, that influence the employees performance both on workshop and plantation divisions.
The analysis result shows that the determination coefficient (R2) is 0.423,
technical training, work compensation, work relationship, work development, as well as employees potential on work experience and education. They are altogether influencing the employees work performance both on workshop and plantation divisions.
In fact, we found that technical training factor do not influence the employees work performance since the technical training may influence the employees technical ability, but do not directly affect the employee performance. M o r e o v e r , t h e f a c t o r s t h a t g a v e influences directly to the employees work performances are work compensation, work relationship and communication, work development, and employees potential in work experience and education. Work compensation can be in the form of wage, salary, and incentive that might influence directly to the employees performance. The higher compensation usually leads to high employee performances. Employees work relationship and communication (among colleagues, leaders and employees) are considered very good, meaning that this factor plays important role for better employees work performance. On the other hand, employees expectation in work development is negatively related to the employees work performance. The reason is because the company still does not fully encourage the employees or hinder them to perform better at their work. However,
the employees potential has a positive relationship with employees performance. Education and knowledge level along with the longer and more experiences at work will support positive employees work performances.
Obstacles and Suggestion for Work
Performance Improvement
Some obstacles influencing work performance both on the workshop and plantation divisions are as follows:
1. The report on damage tractors did not describe the real situation, so it took longer to repair the tractors.
2. Limited tools were available to repair the tractors because most tools were broken.
3. PR was delayed due to the mechanic has to re-analyze the damage unit. 4. Emotional and attitude factors that
must be improved in each individual person and as a team
5. Inefficient time to collect the spare parts
6. Incentive system
7. Minimum tools for repairing the tractors
8. The distance issue bet wee n the plantation and workshop
9. The employees did the work outside of their responsibility and capabilities and work overtime
12. T h e l i mi t a t i o n o f p r o f e s s i o na l mechanic, in number and in quality 13. Limitation of tools availability and
work location access
14. Slow internet connection that delayed the delivery report and inventory 15. Longer administration process that
delayed the working process 16. Limitation on communication tools 17. The broken spare part should be
reported on work order letter (SPK) 18. Higher number of damage tractors
cause the limited operating tractor 19. Communication gap
Some policies have been changed at the workshop that became centralized and on the procedures for spare part inventory, repairing the tractor, as well as incentive system, especially for the overtime incentive. However, these new policies need two months for the employees to adjust themselves. There are some suggestions proposed to the company, i.e.,
1. Improvement for spare part inventory procedure
2. Improvement for damage units
3. Improvement for work incentive system
4. Re-evaluate the final work
5. Communication improvement among the leaders and employees
6. Improvements on communication between stakeholder
7. Improvements on internet connectivity b e t we e n st a k e h o l d e r f o r e a si e r administration process and work finishing
8. Willing to learn new things
9. Experience trading with the colleagues and leaders
10. Rewards for employee achievement 11. Improvement for spare part and tools
availability
12. E m p l o y e e s s h o u l d a c c e p t t h e responsibility from the leaders
13. Employees should establish good teamwork between the leaders and employees.
The employees work performance should be improved by some suggestions, such as to conduct good communication and teamwork between leaders and employees, new system at spare part inventory and repairing tools for damage tractors, and to arrange better work distribution for mechanic and system improvement with the latest technology.
CONCLUSION AND SUGGESTION
Conclusion
• Employee performances both on workshop and plantation division are generally good.
performances. On the other side, career development desire has negative effect on the work performance.
Suggestions
• The work performances that need t o i m p r o v e a r e w o r k t i m e l i n e appropriateness, obedience and loyalty, work planning and work organizing. • Communications, teamwork, tools
and spare part availability, tractor maintenance system, task distribution among the mechanics and administration systems should be improved by using the latest technology.
REFERENCES
Almigo, Nuzsep, 2004. Hubungan Antara Kepuasan Kerja dengan Produktivitas Kerja Karyawan Studi Kasus di PT. Pupuk Sriwijaya. Jurnal PSYCHE,
Vol. 1: No.1 : 50-60.
Ambarwati, Ninik, 2015. Pengaruh Motivasi dan Pengembangan Karir Terhadap Kinerja Pegawai dengan Kepemimpinan Sebagai Variabel Moderasi di Puskesmas Grobogan K a b u p a t e n G r o b o ga n . J u r n a l Manajemen Sumber Daya Manusia
Vol.9: No.2 : 112-124.
Aswin, D. B., 2013. Pemelihara a n da n Perbaikan Traktor di Workshop PT.
Indo Lampung Perkasa. Departemen
Teknik Mesin dan Biosistem Fakultas Pertanian Institut Pertanian Bogor. Bogor.
Daywin, F.J. et al., 1999. Mesin-mesin
Budida ya La ha n Ker ing. Proyek
Peningkatan Perguruan Tinggi Institut Pertanian Bogor. Bogor.
Dessler, G. 2010. Ma na jemen Sumber
Da ya Ma nusia (10 ed.) (P.Rahay,
penerj.) Jakarta: PT Indeks.
Haerani, A. 2001. Kajian Awal Perancangan Ala t da n Mesin untuk Budida ya
Sa yur a n. Skripsi. Jurusan Teknik
Pertanian. IPB. Bogor.
Insan Imarnusani, 2008. Pengaruh Quality of Work Life Terhadap Kinerja Karyawan pada Rumah Sakit Bunda Purwakarta. J ur na l Ekonomi da n
Bisnis Indonesia 15 (2) : 225-246.
Kurniawati. 2015. Pengaruh Kepuasan Kerja dan Komitmen Organisasional T e r h a d a p K i n e r j a d e n g a n Organizational Citizenship Behavior sebagai Variabel Moderasi. Jurnal
Sumber Daya Manusia 9 (1): 1 -10.
Nugroho, Edi, 2005. Analisis Faktor – faktor Motivasi Kerja Karyawan dalam Hubungannya dengan Kinerja Ka rya wa n PT. Pa c i fi c Mi l e ni a Pangan Makmur. Jurnal Dayasaing
3 (1) : 19-27.
Permana, Yudha Indra. 2015. Pengaruh Kemampuan Kerja, Motivasi dan Kompensas i Ter hada p Kinerj a K a r y a w a n d i L i n g k u p S M K Kesehatan Bakti Indonesia Medika Ngawi. J urna l Manajemen Sumber
Da ya Manusia 9 (2) : 137 – 144.
Praptiestrini, 2015. Pengaruh Budaya O r g a n i s a s i Te r h a d a p K i n e r j a Karyawan di PT. Tiga Serangkai Pustaka Mandiri Surakarta. Jurnal
Sumber Daya Manusia 9 (2) : 171
– 180.
Ridjal, Syamsul. 2006. Analisis Kinerja Karyawan Industri Besar di Sulawesi Selatan. Jurnal Analisis 3 (1): 9 – 52.
Savitri, 2015. Pengaruh Budaya Organisasi, Komunikasi, Kompensasi dan Disiplin Kerja Terhadap Kinerja Karyawan Rumah Sakit Assalam di Gemolong Kabupaten Sragen. Jurnal Sumber
Daya Manusia 9 (2): 189 – 195.
Siradjuddin, 2007. Analisis Pengaruh Perilaku Kepemimpinan Terhadap Kinerja Karyawan BPR/BPRS di Sulawesi Selatan. Analisis 4 (2): 77-90.
Wahyudi . 2006 . Anali s i s P engaru h Ga ya Ke pe m i m pi na n, Mot i va si dan Lingkungan Kerja Terhadap Kinerja Pegawai. Junal Sumber Daya Manusia 1(1) : 1 – 14.
Yudistiro, Indra Agung. 2015. Pengaruh Kecerdasan Emosional, Lingkungan Kerja dan Disiplin Terhadap Kinerja Guru dengan Komitmen Organisasi Sebagai Moderasi. J ur na l Sumber