12th UBAYA INTERNATIONAL ANNUAL SYMPOSIUM ON MANAGEMENT
ISBN: 978-979-99365-9-2 1119
The Selection of Classification Methods in Kano Model for Service Industry
Yenny Sari
Industrial Engineering, Faculty of Engineering, University of Surabaya Raya Kalirungkut, Surabaya 60293, Indonesia
E-mail: [email protected]
ABSTRACT
Kano Model is a model that aims to categorize the attributes of service based on how well the attributes satisfy the needs of customers. Kano model is able to classify the service attributes into three categories, namely Must-be (M), One-dimensional (O) and Attractive (A) categories. The Must-be (M) category is a category that includes a must have attribute, the Attractive (A) category consists of a surprising service attribute to consumers and the One-dimensional (O) category is a category of attribute that the better its quality of fulfillment, the more satisfied of customers’ feeling. In order to get the classification of A/O/M, several methods had been used i.e. Conventional, If-then and Better Worse methods. However, the usage of these different methods generated different categories for the same attribute. Thus, this paper showed a set of researches over six various service industries that used those three classification methods and the comparison among the methods in order to select the most appropriate methods in determining the categories for the service attributes. The result showed that, supported by a statistical testing at significant level 0.10, If-then method is selected as the most appropriate method to classify the Kano category.
Keywords: Kano category, classification, service industry
1. RESEARCH BACKGROUND
The improvement of service quality becomes a major concern for both private and government organizations in achieving customer satisfaction. The triggers of the improvement of service quality can be caused by the complaints of the public facilities that have been provided (especially for services provided by the government) as well as the fierce competition that faced by private business (especially related to commercial services industry) which requires an organization to be able to survive or even to improve continually. In improving the quality of services provided, many organizations are measuring the customer satisfaction using the Service Quality (SERVQUAL) model throughout the analysis of gap between perceived and expected service (Parasuraman, et al. [9]) in which a customer is satisfied if the perceived service exceeded the expected service. Some researches had been done related to improvement of the quality of service industry by using the SERVQUAL model (see Tan & Pawitra [18], Sari et al. [14], Hartono et al. [4]), showed that customers tend to express their dissatisfaction that caused many attributes of services should be focused for improvement.
However, it is aware that not all of the services attributes that being improved can increase customer satisfaction level effectively. Kano model (Kano [5], Berger [2]) is then used widely for classifying the quality of service into several levels or different categories (see also
Puspitasari et al. [10], Tan & Pawitra [18]), the categories of service attribute can be (a) Must
12th UBAYA INTERNATIONAL ANNUAL SYMPOSIUM ON MANAGEMENT
ISBN: 978-979-99365-9-2 1120
dissatisfaction. This attribute is often referred to as a "must have" or "basic" requirement of a
service; (b) One-dimensional (O), a category of the attribute that the better quality of its
fulfillment, the customers feel more satisfied, and vice versa. The attribute is known as
"more/less is better" and become the competitive service attribute; (c) Attractive (A), a
category in which the attribute provided will be able to make customer feel surprised. This
attribute becomes the differentiation attribute, and (d) Indifferent (I), a category of the
attribute that its fulfillment does not effect on customer satisfaction significantly, (e) Questionable (Q), sometimes customers are satisfied or dissatisfied with the presence of the attributes in this category, so it is not clear whether the attribute in this category is expected or
not expected by the consumer, (f) Reverse (R), consumers are not satisfied if these attributes
are exist, but consumers will be satisfied if the attribute does not exist. The first four categories (M/O/A/I) are the primary categories that had been seek throughout Kano model while the last two categories (R/Q) are usually used to test the validity of customers’ answer. Based on the classification of the service attributes, some organizations had been done the improvement on service quality by focusing on the attributes with the categories of Attractive and One-dimensional (Tan & Pawitra [18]) which give a reduction on the numbers of service attributes that need to be improved (Sari et al. [14], Hartono et al. [4])
To determine the Kano categories for those service attributes, several methods had been introduced (Berger [2], Walden [19]) i.e. Conventional, If-then, Better and Worse method. The classification using different methods, however, give different results, for an instance, a service attribute “waiting area for the passengers in Juanda Airport” (Sari [17]), the classification of Conventional method give a category of indifferent meanwhile If-then method classify the certain attribute into an attractive category. The differences among the classification result brought complications for further analysis (see also MacDonald [7]), and raises a presumption of certain categorization method may produce better classification. Therefore, the objectives of this research are to compare different methods of Kano classification in various fields of service industry and to obtain the most appropriate classification method to determine the category of Kano.
2. LITERATURE REVIEW
12th UBAYA INTERNATIONAL ANNUAL SYMPOSIUM ON MANAGEMENT
ISBN: 978-979-99365-9-2 1121
Table 1 – Kano Evaluation Table
Service Attribute Dysfunctional
1. like 2. must-be 3. neutral 4. live with 5. dislike
Functional
1. like Q A A A O
2. must-be R I I I M
3. neutral R I I I M
4. live with R I I I M
5. dislike R R R R Q
Kano Categories: A (Attractive), O (One-Dimensional), M (Must-be), I (Indifferent),
Q (Questionable) and R (Reverse)
Figure 1 – Four Primary Categories of Kano (modified form Berger [2])
1. Questionaire Functional form of
the question 1. I like it that way2. It must be that way 3. I am neutral
4. I can live with it that way 5. I didn’t like it that way Disfunctional form
of the question 1. I like it that way2. It must be that way 3. I am neutral
4. I can live with it that way 5. I didn’t like it that way
2. Evaluation table Product requirement
Func
tiona
l 1
2 3 4 5
Disfunctional
1 2 3 4 5
O
3. Table of result Service attribute
The receptionist and information desk is visually appearing ...
A O M I R Q Total Category
1 1
5
O
12th UBAYA INTERNATIONAL ANNUAL SYMPOSIUM ON MANAGEMENT
ISBN: 978-979-99365-9-2 1122
According to Berger [2] and Walden [19], there are several ways that can be used to determine Kano category, as mentioned below:
1. Conventional method, the determination of Kano category based on the greatest frequency
of Kano selected category.
2. If-then method, it is a statistical modification which is also known as Blauth’s Formula, in
which Kano category is determined from:
If (one-dimensional + attractive + must be) > (indifferent + reverse + questionable),
then the Kano category is maximum from (one-dimensional, attractive, must be)
If (one-dimensional + attractive + must be) < (indifferent + reverse + questionable),
then the Kano category is maximum from (indifferent, questionable, reverse)
3. Better and Worse method, It ignores the Reverse and Questionable categories and
calculated the Better and Worse value from the formulas of:
Better = Worse =
The results of the Better and Worse values will be plotted in two-dimensional graph, with the maximum value of 1, where the value of the Worse (which is absolutized in advance to get the positive value) as the X-axis and the value of the Better as Y-axis. The Kano category is determined to the areas of (see Figure 3):
If (Worse value < 0.5, Better value < 0.5), then the category is Indifferent If (Worse value < 0.5, Better value > 0.5), then the category is Attractive If (Worse value > 0.5, Better value < 0.5), then the category is Must-be
If (Worse value > 0.5, Better value > 0.5), then the category is One-dimensional
1
Better
Attractive One-dimensional
Value 0.5
Indifferent Must-be
0 0.5 1
Worse Value
. Figure 3 – Two-dimensional graph of Better and Worse Method (modified from Berger [2])
12th UBAYA INTERNATIONAL ANNUAL SYMPOSIUM ON MANAGEMENT
ISBN: 978-979-99365-9-2 1123
Table 2 – Description of the Kano categories to customers (modified from Macdonald [7])
Kano Category Description to Customers Action taken for improvement
Attractive If the attribute is “Attractive”, it means that the attribute provides extra satisfaction for customers when it is present, but the service still does its job perfectly when the attribute is absent.
Work to include attribute at a basic functioning level, as the mere presence of the attribute will induce satisfaction
One-dimensional If the attribute is “One-dimensional”, it means that the more attention the companies or organizations pay to this feature in the
functionality of the attribute past industry standards.
Must-be If the attribute is “Must-be”, it means the lack of this attribute would definitely cause dissatisfaction, and probably make the service not as useful for customers. However, unlike a One-dimensional category, extra improvement effort spent on improving a Must-be category would not make much difference to customers – it just needs to be included and functioning normally.
Make sure the attribute is
included and functioning
properly at an industry-standard level.
Indifferent If the attribute is “Indifferent”, it means that the attribute does not provide either satisfaction or dissatisfaction to customers.
Do not focus any attention here. Note that some attributes are Attractive to some customers while others feel indifferent or even reverse about these attributes
Reverse If the attribute is “Reverse”, it means that the
attribute causes the customers
annoyance/dissatisfaction and probably makes the service less useful to customers.
Make sure not to include these attributes.
3. RESEARCH METHODS
The researches had been done using the survey research in various sectors of service industry; each followed the similar steps of the research which were explained as below:
1. The formulation of service attributes and the design of Kano questionnaire. In this stage,
the initial study among related publication and initial survey to some potential customers (about 10-30 respondents) were carried out in order to formulate the service attributes. After the formulation of service attributes was done, the Kano questionnaire had been developed in which each service attribute will asked into functional and dysfunctional way and the customers filled the questionnaire using five possible answers (see Figure 2).
2. The Kano survey (the distribution of Kano questionnaire)
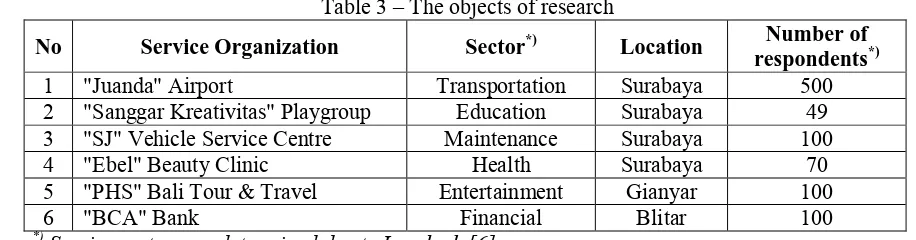
The research had been done in six different service organizations, as shown in Table 3. The six service organizations which were involved in this research are explained briefly as follow:
a. “Juanda” airport (Sari & Rosiawan [17]), is an international airport owned by
12th UBAYA INTERNATIONAL ANNUAL SYMPOSIUM ON MANAGEMENT
ISBN: 978-979-99365-9-2 1124
(which is known as Terminal I) and had a service capacity of six millions passengers per year.
b. “Sanggar Kreativitas” Playgroup (Sari & Rosiawan [15]), is a playgroup for
pre-school children (2-4 years old), established in 1993, which had about 60 – 80 children annually.
c. “SJ” Vehicle Service Centre (Sari & Rosiawan [16]), is a private service centre that
had 9 mechanics and provided maintenance service for motorcycles. It was established since 1996.
d. “Ebel” Beauty Clinic (Rosiawan & Sari [11]), is a private beauty clinic which was
established in 2004.
e. “PHS” Tour & Travel (Rosiawan & Sari [12]), is a private tour and travel agency
which located in Gianyar, Bali island.
f. “BCA” Bank (Sari & Hadiyat [14]), is a branch bank of a national private bank which
is located in Blitar and serves about 40 customers per day by 10 employees.
The survey itself used the purposive sampling, which means that the customers who become the respondents of survey should be the ones that used the services of the organization at least 2 times.
Table 3 – The objects of research
No Service Organization Sector*) Location Number of respondents*)
1 "Juanda" Airport Transportation Surabaya 500
2 "Sanggar Kreativitas" Playgroup Education Surabaya 49
3 "SJ" Vehicle Service Centre Maintenance Surabaya 100
4 "Ebel" Beauty Clinic Health Surabaya 70
5 "PHS" Bali Tour & Travel Entertainment Gianyar 100
6 "BCA" Bank Financial Blitar 100
*) Service sector was determined due to Lovelock [6],
the number of respondents was calculated regarding to Slovin formula in Altares [1]
3. The determination of Kano category by using those three methods of classification
After the questionnaires being distributed, the validity testing was done accordingly by checking whether any of the service attributes fell into the category of R/Q. These two categories showed whether any misphrased of the questions which can cause the customers confused to fill the questionnaire. Then, the results of this survey Kano processed using three existing methods of categorization in Kano models, namely Conventional methods, If-then and Better Worse for service attribute classification into categories A / O / M / I.
4. In addition to the Kano survey via questionnaire, the research also conducted a focus
12th UBAYA INTERNATIONAL ANNUAL SYMPOSIUM ON MANAGEMENT
ISBN: 978-979-99365-9-2 1125
through the comparison between the classification results obtained from the previous stage (Conventional, If-then and Better Worse method) and the results of the control group. The objective was to see the level of concordance between the results of those three methods and the control group.
5. The final step of the research is doing the statistical testing to test against the difference
between those three methods of classification. The factorial design, especially the randomized block design, was carried out (Montgomery [8]). A blocking factor was referred to the different service organization meanwhile the factor which was primary interest of Analysis of Variance (ANOVA) was those three methods of classification.
4. RESULT & DISCUSSION
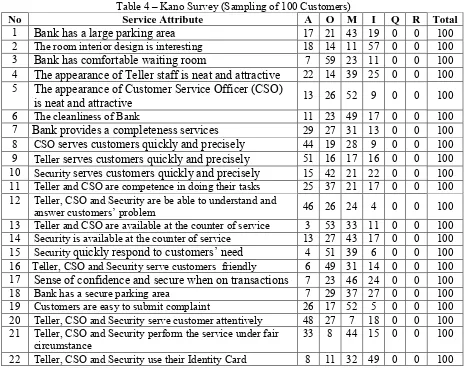
To describe the result of research steps from 1 to 4, a service organization was chosen i.e. the result of Kano survey of “BCA” Bank to be discussed. There were 22 service attributes being examined in Kano survey, a pre-sampling of 30 respondents showed that the questionnaire was valid and then a sampling of 100 respondents was done accordingly. By doing Kano evaluation process (refer to Figure 2), it can be seen from Table 4 that no service attribute fell into the categories of R/Q, which it meant that the result of Kano survey was valid for further classification.
Table 4 – Kano Survey (Sampling of 100 Customers)
No Service Attribute A O M I Q R Total
1 Bank has a large parking area 17 21 43 19 0 0 100
2 The room interior design is interesting 18 14 11 57 0 0 100
3 Bank has comfortable waiting room 7 59 23 11 0 0 100
4 The appearance of Teller staff is neat and attractive 22 14 39 25 0 0 100
5 The appearance of Customer Service Officer (CSO)
is neat and attractive 13 26 52 9 0 0 100
6 The cleanliness of Bank 11 23 49 17 0 0 100
7 Bank provides a completeness services 29 27 31 13 0 0 100
8 CSO serves customers quickly and precisely 44 19 28 9 0 0 100
9 Teller serves customers quickly and precisely 51 16 17 16 0 0 100
10 Security serves customers quickly and precisely 15 42 21 22 0 0 100
11 Teller and CSO are competence in doing their tasks 25 37 21 17 0 0 100
12 Teller, CSO and Security are be able to understand and
answer customers’ problem 46 26 24 4 0 0 100
13 Teller and CSO are available at the counter of service 3 53 33 11 0 0 100
14 Security is available at the counter of service 13 27 43 17 0 0 100
15 Security quickly respond to customers’ need 4 51 39 6 0 0 100
16 Teller, CSO and Security serve customers friendly 6 49 31 14 0 0 100
17 Sense of confidence and secure when on transactions 7 23 46 24 0 0 100
18 Bank has a secure parking area 7 29 37 27 0 0 100
19 Customers are easy to submit complaint 26 17 52 5 0 0 100
20 Teller, CSO and Security serve customer attentively 48 27 7 18 0 0 100
21 Teller, CSO and Security perform the service under fair
circumstance 33 8 44 15 0 0 100
22 Teller, CSO and Security use their Identity Card 8 11 32 49 0 0 100
12th UBAYA INTERNATIONAL ANNUAL SYMPOSIUM ON MANAGEMENT
ISBN: 978-979-99365-9-2 1126
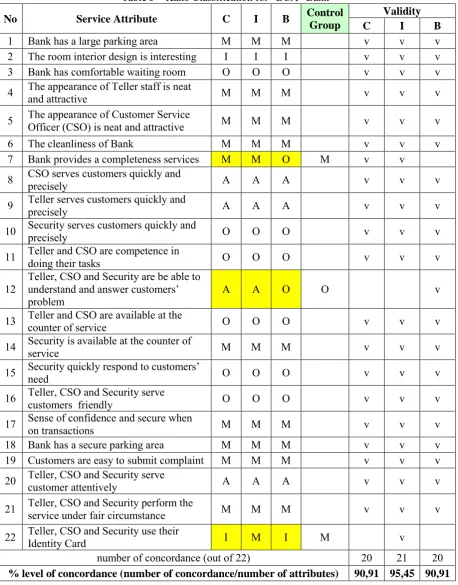
Table 5 – Kano Classification for “BCA” Bank
No Service Attribute C I B Control Group
Validity C I B
1 Bank has a large parking area M M M v v v
2 The room interior design is interesting I I I v v v
3 Bank has comfortable waiting room O O O v v v
4 The appearance of Teller staff is neat and attractive M M M v v v
5 The appearance of Customer Service Officer (CSO) is neat and attractive M M M v v v
6 The cleanliness of Bank M M M v v v
7 Bank provides a completeness services M M O M v v
8 CSO serves customers quickly and precisely A A A v v v
9 Teller serves customers quickly and precisely A A A v v v
10 Security serves customers quickly and precisely O O O v v v
11 Teller and CSO are competence in doing their tasks O O O v v v
12 Teller, CSO and Security are be able to understand and answer customers’
problem A A O O v
13 Teller and CSO are available at the counter of service O O O v v v
14 Security is available at the counter of service M M M v v v
15 Security quickly respond to customers’ need O O O v v v
16 Teller, CSO and Security serve customers friendly O O O v v v
17 Sense of confidence and secure when on transactions M M M v v v
18 Bank has a secure parking area M M M v v v
19 Customers are easy to submit complaint M M M v v v
20 Teller, CSO and Security serve customer attentively A A A v v v
21 Teller, CSO and Security perform the service under fair circumstance M M M v v v
22 Teller, CSO and Security use their Identity Card I M I M v
number of concordance (out of 22) 20 21 20
% level of concordance (number of concordance/number of attributes) 90,91 95,45 90,91
1. Conventional method (code: C) showed that the greatest frequency fell into the Kano
category of Indifferent (frequency = 49).
2. If-then method (code: I) showed that (8+11+32)>(49+0+0) then the Kano category is
12th UBAYA INTERNATIONAL ANNUAL SYMPOSIUM ON MANAGEMENT
ISBN: 978-979-99365-9-2 1127
3. Better and Worse method (code: B) calculated the value of Better = (8+11)/(8+11+32+49)
= 0.19 and Worse = (11+32)/(8+11+32+49) = 0.42, referred to Figure 3, it fell into the Kano category of Indifferent.
4. Because of the differences result among the three methods (Indifferent category from
Conventional and Better- Worse methods, Must-be category from If-then method), the focus group discussion was done and this control group’s result is the Kano category of Must-be.
The classification result was shown in Table 5. From the validity checking, it can be seen that there were 21 out of 22 service attributes in If-then method in concordance with the classification, except for attribute no. 12 (If-then classified it as an Attractive category, but the validity mentioned a One-dimensional category was more appropriate). The percentage of level of concordance was calculated through dividing number of concordances by number of service attributes. The levels of concordance for other service organization can be obtained by using the same methodology, the summary was shown in Table 6.
Table 6 – Level of Concordance for the Kano Classification Methods
No Service Organization
% Level of Concordance
Conventional If Then Better-Worse
1 "Juanda" Airport 45% 75% 75%
2 "Sanggar Kreativitas" Playgroup 91,67% 94,44% 97,22%
3 "SJ" Vehicle Service Centre 61,90% 85,71% 57,14%
4 "Ebel" Beauty Clinic 70,83% 91,67% 70,83%
5 "PHS" Bali Tour & Travel 48,28% 58,62% 72,41%
6 "BCA" Bank 90,91% 95,45% 90,91%
Average 68,10% 83,48% 77,25%
Further statistical testing was being done to test the hypothesis of: H0 (there is no difference
among the Kano Classification Methods) versus H1 (at least one of the Kano Classification
Methods is different). The randomized block design was used, the service organization was set as the block factor and percentage of the concordance level became the primary factor to be tested.
12th UBAYA INTERNATIONAL ANNUAL SYMPOSIUM ON MANAGEMENT
ISBN: 978-979-99365-9-2 1128
The result, as shown in Figure 4, rejected H0 at P-Value = 0,061 (using the significant level of
α = 10%). The result of statistical testing said that there was at least one of classification method which differed from other methods, the If-then method (Blauth’s formula) had the highest level of concordance (83,48%), the conventional method was at the lowest level (68,10%) and the Better-Worse method was in the midst among them (77,25%). Hence, it can be concluded that If-then method is the most appropriate method in classifying the Kano category.
5. CONCLUSION
To classify the service attributes into Kano categories of A/O/M/I, three classification methods were introduced. The usage of different classification methods can give different result of category; however, this research concluded that the If-then method became the most appropriate classification method to determine the Kano categories in various fields of service industry. If it is compared to Conventional method, If-then method has made a modification in determining the category which the modification is aimed to decrease the noise level i.e. the mistake of classifying important service attribute into the Kano category of Indifferent. The noise level tends to be occurred when using conventional method, for an illustration, 21 customers’ answers for a certain service attribute are classified as Attractive, 19 as One-dimensional, 18 as Must-be and 22 as Indifferent, conventional method will classify this attribute as Indifferent, even though there are 58 out of 80 customers mentioned that they needed the attribute. The determination of Kano category in If-then method is simpler and easier, when it is compared to Better-Worse method, one should calculate the better and worse value in advance before being able to determine the Kano categories.
6. REFERENCES
[1] Altares et al., 2003, Elementary Statistics: A Modern Approach, Rex Book Store Inc.
[2] Berger, C. et al., 1993, Kano’s Methods for Understanding Customer-defined Quality,
Center for Quality of Management Journal, Vol.2, No. 4, pp. 3-36.
[3] Hartono, M. dan Tan, K.C., 2011, A Proposed Integrative Framework of Kansei
Engineering and Kano Model Applied to Services, The 2nd International Research Symposium in Service Management, pp. 484-492, Yogyakarta, Indonesia.
[4] Hartono, M., Sari, Y., Oiej, A. S., 2014, Skema Integrasi Model Kano, SERVQUAL,
Kansei Engineering dan TRIZ dalam Upaya Peningkatan Kualitas Layanan, Prosiding Seminar Nasional Teknik Industri, Universitas Kristen Petra, Surabaya. ISBN 978-602-71225-1-2.
[5] Kano, K.H., Hinterhuber, H.H., Bailon, F., Sauerwein, E., 1984, “How to delight your
Customers”, Journal of Product and Brand Management 5 (2), pp. 6–17
[6] Lovelock, C., Wright, L., 2002, Principles of Service Marketing and Management,
Prentice Hall.
[7] MacDonald, E., et al., 2006, The Kano Method’s Imperfections, and Implications in
Product Decision Theory, International Design Research Symposium
[8] Montgomery, D., Runger, G. C., 1999, Applied Statistics and Probability for Engineers,
John Wiley & Sons, Inc.
[9] Parasuraman, A., Berry, L.L., and Zeithaml, V.A., 1988, “SERVQUAL: A Multiple-Item
12th UBAYA INTERNATIONAL ANNUAL SYMPOSIUM ON MANAGEMENT
ISBN: 978-979-99365-9-2 1129
[10]Puspitasari, N. B., Suliantoro, H., Kusumawardhani, 2010, Analisis Kualitas Pelayanan
dengan Menggunakan Integrasi Importance Performance Analysis (IPA) dan Model
Kano. Jurnal TI Universitas Diponegoro, Vol. 5 No.3.
[11]Rosiawan, M., Sari, Y., 2009, The Deployment of Kano and TRIZ to Improve Service
Quality in Ebel Beauty Clinic - Surabaya, Research Report, University of Surabaya.
[12]Rosiawan, M., Sari, Y., 2010, The implementation of Kano dan TRIZ to improve the
service quality of PHS Tours and Travel – Gianyar, Research Report, University of Surabaya.
[13]Sari, Y., Hadiyat, A., 2014, The implementation of the integration of Kano, Kano and
SERVQUAL into QFD to improve Service Quality in BCA KCP Wlingi, Blitar, Research
Report, University of Surabaya, 2014
[14]Sari, Y., Hartono, M., and Budiyono, S., 2013, Integrating Kansei Engineering into Kano
and SERVQUAL Model to Determine the Priorities of Service Improvement (Case Study: CaféAgape at Ruteng, East Nusa Tenggara – Indonesia), Proceeding of Industrial Engineering and Service Science, ISSN: 23387939.
[15]Sari, Y., Rosiawan, M., The integration of Kano dan QFD to improve the service quality
of Sanggar Kreativitas – Surabaya, Research Report, University of Surabaya, 2008.
[16]Sari, Y., Rosiawan, M., The improvement of Service Quality using Kano Model – a case
study on a Motor Service Centre in Surabaya, Research Report, University of Surabaya, 2008.
[17]Sari, Y., Rosiawan, M., Kurniawan, E., “The deployment of Kano and TRIZ for service
improvement – a case study at International Juanda Airport, Surabaya – East Java”,
Proceeding of 5th National Industrial Engineering Conference, 2009, University of
Surabaya, page 269 - 278.
[18]Tan, K.C. and Pawitra, T.A., Integrating SERVQUAL and Kano’s Model into QFD for Service
Excellent Development, Managing Service Quality, 11, 2001, pp. 418-430.
[19]Walden, David. 1993. Kano’s Methods for Understanding customer defined Quality.
![Figure 2 – Kano Evaluation Process (Hartono & Tan [3])](https://thumb-ap.123doks.com/thumbv2/123dok/1515589.1535320/13.595.78.505.514.693/figure-kano-evaluation-process-hartono-tan.webp)