POPULATION ESTIMATION IN SINGAPORE BASED ON REMOTE SENSING
AND OPEN DATA
Hui Guoa, Kai Caoa*, Peng Wangb a
Department of Geography, National University of Singapore, Singapore –[email protected]; [email protected] b
Department of Real Estate, National University of Singapore, Singapore - [email protected]
KEY WORDS: Population Estimation, Remote Sensing, Open Data, GIS, Singapore
ABSTRACT:
Population estimation statistics are widely used in government, commercial and educational sectors for a variety of purposes. With growing emphases on real-time and detailed population information, data users nowadays have switched from traditional census data to more technology-based data source such as LiDAR point cloud and High-Resolution Satellite Imagery. Nevertheless, such data are costly and periodically unavailable. In this paper, the authors use West Coast District, Singapore as a case study to investigate the applicability and effectiveness of using satellite image from Google Earth for extraction of building footprint and population estimation. At the same time, volunteered geographic information (VGI) is also utilized as ancillary data for building footprint extraction. Open data such as Open Street Map(OSM)could be employed to enhance the extraction process. In view of challenges in building shadow extraction, this paper discusses several methods including buffer, mask and shape index to improve accuracy. It also illustrates population estimation methods based on building height and number of floor estimates. The results show that the accuracy level of housing unit method on population estimation can reach 92.5%, which is remarkably accurate. This paper thus provides insights into techniques for building extraction and fine-scale population estimation, which will benefit users such as urban planners in terms of policymaking and urban planning of Singapore.
1. INTRODUCTION
The growing interest in studying impacts of human activities on socioeconomics has increased the demand for population information in urban areas (Bongaarts 2009). Moreover, the recent trend of urban population boom and intensive land use pose massive challenges for urban transport planning (Xie et al. 2015). Thus, the requirement for more accurate, comprehensive as well as real-time population information is getting more urgent because population forecasting is the basis for gearing up transport policymaking and pattern planning (Smith et al. 2002). While the traditional way of collecting census information by governments or public agencies is still widely employed, limitations of census such as the laborious process and unavoidable long time lags inhibit the process of research. Unavailability and inaccuracy of dataset are two more issues that are prevalent across countries.
A literature review on the subject has shown that Remote Sensing and Geographic Information System as an alternative has been long recognized as a cost-effective way of getting population information (Wang et al. 2016, Greger 2015, Martin et al .2015, Jia et al 2014, Douglass et al. 2015). In general, areal interpolation and statistical modeling methods have
* Corresponding author
been categorized in terms of their aim and required data. Areal interpolation methods could be employed to transform data from a first spatial unit system to another after being aggregated. However, this method is subject to errors during areal aggregation process and its quality relies mainly on the definition of source zone and target zone as well as the partitioned surface (Lam, 1983). For statistical modeling approach, based on the relationship between population and remote sensed variables, it can be categorized into six ancillary datasets, namely nighttime light image (Amaral et al. 2006), Land Use classification (Lo 2003) , Dwelling Units (Lo 1995), Image Pixel Characteristics (Harvey 2003), impervious surface (Lu et al. 2006) and Other social sensing data (Deville et al. 2014). But for estimating large-area population, overestimation and underestimation frequently occurred. For small area population estimation, the method is constrained by the details and comprehensive level of related variates, which leads to inaccuracy and unreliable estimation results. Therefore, this method also has limitations and needs to be improved in terms of their accuracy (Wu et al. 2005).
more accurate and reliable. In spite of the high resolution, they are harder to process due to their huge data content (Li and Weng 2005). This triggers arguments from some scholars who are skeptical as evidence shows that it is indeed more challenging to use high-spatial-resolution imagery in urban areas due to the heterogeneity of buildings types (L. Wang & Wu, 2010).
In recent years, a large number of papers have discussed and espoused the use of LiDAR-derived indicators in estimating the fine scale population. For example, Qiu (2010) developed an automated model based on LiDAR technologies to better estimate population counts for a building block level. To enhance the accuracy of LiDAR-derived population indicators, some studies underscored the importance of providing building usage information in urban areas where buildings types are heterogeneous (Lu, et al. 2011).
But as the cost of LiDAR data is rather high and such data are not periodically available, imagery with a finer resolution and low cost is demanded. In recent years, Google Earth imagery has been quickly employed in land use mapping and urban area retrieval (Mering et al. 2010). Google Earth imagery with high spatial resolution is an open data source free to the public. However, few studies have explored it for small area population estimation, largely due to its poor spectral information, namely the three bands, Blue, Green and Red. This challenge adds more technical difficulty to Google Earth imagery for remote sensing extraction application. Our study aims to solve this problem by investigating the use of Open Street Map (OSM) as ancillary data to refine population estimates at building level. This is because majority of the features in OSM are recorded in great details and easy for target building identification. Building type information such as commercial (e.g. restaurant), school or residential buildings are provided and verified by multiple VGI users. It thus works as a complementary source of data that helps to mitigate the limits of Google Earth Imagery.
Therefore, in this study, we investigate the feasibility of using Google Earth imagery to extract residential building footprints based on urban morphological operations with OSM as ancillary data. Population estimation method is then conducted based on the extracted residential building area and height with support from Singapore census for 2015.
2. STUDY AREA AND DATASET
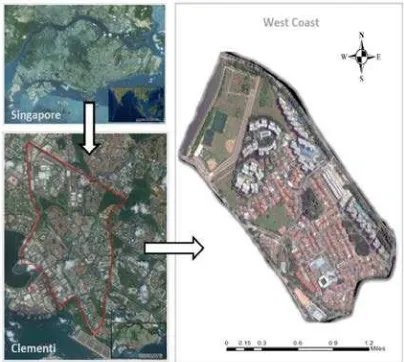
The study area is the West Coast, a 0.72 km2 subzone located in Clementi town. The majority of the buildings in the area are residential buildings including Condominiums and Apartments, Landed Properties and Public Housing (Figure 1). The Google Earth satellite imagery of the study area is taken on
30th June 2015 with a parameter level of 17, a pixel size of 2.15 meter and scale of 1:2300. The landscape features in this area include mainly vegetation such as trees, grass, and impervious surfaces like roads, buildings and open spaces. There is a wide variety of urban land use types clustered in this area, such as schools, commercial malls, community centers, and sports hub and so on. This potentially adds more difficulty to the study especially in the fine scale population estimation segment. The imagery also shows the agglomeration effects of land use that the same types of building use tend to amass near to each other. Comparatively, the residential areas are more clear-cut due to the fact that vegetation and roads are evenly distributed around a residential area which mark out residential boundary. The research here focuses on residential buildings.
The other minor sources of the dataset include road and building shapefile from OSM and street view from Google Map. We also use census data downloaded from Singapore Department of Statistics for validation purposes. In addition, building height information and Singapore private residential properties vacancy rate are obtained from Singapore Urban Redevelopment Authority (URA) official website. They are ancillary information used for extraction of building footprint and crosschecking the building height.
Figure 1: The geographical location of West Coast, Clementi in Singapore
3. METHODOLOGY
Figure 2. Workflow of the study 3.1 Data Processing
In order to obtain more information from raw remote sensing imagery, it is necessary to process satellite image first. The fundamental step here is image rectification, which lays the foundation for later stages of image analysis and interpretation. Image rectification is essentially a transformation process to establish a relationship between a raw image and reference image. Transformation of the raw image of area of interest from different view angles and time to the same reference system allows us to perform spatial overlay and other relevant spatial analysis.
The objective of image rectification for this study is to reduce geometric distortion as well as to fit the chosen projected coordinate system. One way to achieve this is through rectification model provided by Envi 5.1. We employ the Polynomial model for this paper as it is most widely used for image rectification. Figure 3 summarizes the workflow of the image rectification.
Figure 3. Workflow for image rectification using
Erdas Imagine.
In this paper, we perform image rectification using Envi 5.1 Polynomial model on the Google Earth Imagery of the study area. A total of 20 Ground Control Points (GCP) are chosen, and the final rectified image is shown in Figure 4. The image is made up of 3 bands, namely Red (Band 1), Green (Band 2), and Blue (Band 3).
Figure 4. Rectified image of the study area West Coast, Clementi, Singapore
3.2 Building Type Classification 3.2.1. Based on Volunteer GIS
Past papers have investigated the application of morphological metrics in discovering urban patterns of an area (Benediktsson et al. 2003, Voorde et al. 2011, Kuffer et al. 2011 ). These studies have shown that building shape features could be used to classify buildings according to their land use. The focus of this paper is on residential buildings, which consist of the following three main types in the context of Singapore (Housing Development Board Flat or HDB Flat); condominium and apartments (Condo & Apt); landed properties (Bungalow; Detached House; Semi-Detached House; Terrace House). From observation, HDB, Condo & Apt tend to have elongated rectangular roof, which is white in color, while landed properties are clearly distinctive with its square red roof. However, the confusion among the other types of use like education centers, recreational areas and industrial spaces implied that the introduction of merely morphological metric might not be enough. Thus, this study also considered another indicator, which is to check against the building type information obtained from OSM.
1 •Add image dataset into Erdas Imagine
•Activate geometric correction workspace
•Select ground control points
•Input transformation matrix
•Image reprocessing
3.2.2. Ancillary Data from OSM
Google Earth Imagery has limited applicability in extracting accurate building footprint in the following three aspects:
1). Too much footprint noise from roads, concrete land and vegetation due to the fact that it only provides RGB bands.
2). Inability to distinguish wall boundaries for landed properties such as semi-detached houses. The extracted footprint based on the imagery lumps together footprint of different landed house in close proximity or neighborhood.
3). It is particularly difficult to distinguish-residential buildings types from nonresidential buildings based on Morphological methods due to their homogeneous rooftops.
In view of the problems associated with the Google Earth Imagery, this paper adopts a new approach to tackle these issues so as to improve building footprint extraction accuracy. Through experimenting, we find that OSM is able to provide solutions to most of the problems listed above. Firstly, OSM provides footprint information of land properties on an individual unit basis, which allows us to better distinguish individual residential buildings. Secondly, the building footprint from OSM offers building type and land use information in the attribute table. This facilitates the job of teasing out residential from nonresidential buildings. However, we also recognize that the building footprint provided by OSM has flaws in terms of positional accuracy and completeness issue.
Thus, a combined method that integrates advantages of both satellite image footprint extraction and OSM information on footprint extraction is adopted in this paper to achieve a higher level of accuracy. It is noteworthy that land properties and non-landed properties are treated separately due to their difference in building characteristics. The differences in the methods are explained below:
a). Landed Properties
We use OSM footprint as a mask to extract effective footprint that is close to reality. As the average number of residents living in a landed property unit is rather similar, we only need to take one more step to extract the number of land properties.
b). Non-landed Properties
Step 1: Calculate maximum locational displacement distance.
Step 2: Create a buffer on building footprint from OSM based on the distance from step1.
Step 3: Use buffered footprint as a mask to extract building footprint.
Step 4: Perform clip function with footprint in Step3 and OSM footprint.
As a result, we get footprint of non-extracted buildings, roads and concrete lands. Since the number of non-extracted buildings is small, visual inspections and interpretation is carried out to identity those non-extracted buildings and add them to the original extracted footprint. We are thus able to mitigate the issue of incompleteness. By using mask for landed properties and creating buffers around non-landed properties, the locational inaccuracy issue is effectively resolved. The final extracted building footprint is shown in Figure 5. Then we use rule-based classification from ENVI.5.1 to extract building footprint based on morphological metrics.
Figure 5: Extracted building footprint for buildings in the West Coast Area of Singapore
3.2.3. Residential building identification
In order to distinguish residential buildings from the other types of properties such as industrial and commercial buildings, ancillary information from OSM attribute table is utilized in this section.
3.3 Building Height Extraction
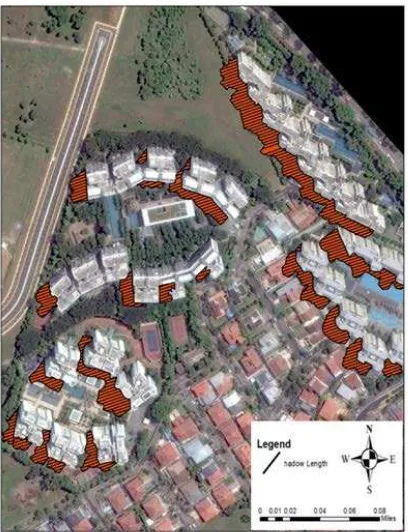
3.3.1. Building Shadow Extraction
To extract the shadows of buildings, three steps are employed:
Step 1: Convert the original RGB image into grayscale
Step 2: Use Binary Thresholding function to create a raster output that divides current imagery into shadows and non-shadows two distinct classes
Step 3: Use Module Polygon Shape Index and Buffer, Clip, Thresholding Method to denoise shadows from open field, concrete land and vegetation
3.3.2. Shadow Length Calculation
The steps of shadow length calculation are as follows: Step 1: Obtain the solar altitude
Step 2: Generate a series of lines that are parallel to shadow edge in conformity to the angular relationship Step 3: Obtain the length of intersected portion between the parallel lines and the shadow (Figure 6) .The maximum shadow length is identified to be the final shadow length
Figure 6. Illustration of shadow length calculation.
4. RESULTS AND DISCUSSION 4.1. Building extraction:
This paper extracted 445 out of total 468 landed properties with an overall successful rate of 95%.
4.2. Building Height Calculation:
The calculations of building height are as follows: Formula 1: H = L * tan W
Where W is the solar altitude, L is the length of a shadow and H is the corresponding building height.
4.3. Population Estimation
The Population estimation is based on dwelling units and calculated separately for the two major types of residential properties, namely landed and non-landed properties (Condo & Apt).
Firstly, to calculate the population residing in landed properties, we use “number of landed properties units” calculated in the previous steps and multiply it by “resident density” and “occupancy rate”.
Secondly, to calculate population residing in Condo or Apt, we apply the following steps:
Step 1: Apply Formula 2.
Formula 2: ������������������������=
�������� ���������
Step 2: Apply Formula 3.
Formula 3: Total number of units for one building = Number of units for one floor * number of floors.
Step 3: Apply Formula 4.
Formula 4: Total number of units = “Number of Condo or Apt units * resident density *occupancy
rate”.
Lastly, sum up the two final numbers to get the total population for the entire West Coast Area (Table 1).
Parameter Landed Property Population
Condo Population
Total
Estimated 1763a 3689b 5452c
Actual d 1940 3940 5890e
a.
445∗ 4.3∗ 0.921 = 1763b.
1199∗ 3.34∗ 0.921 = 3689c.
1763 + 3689 = 5452d.
Obtained from URA, Singapore Residents by Planning Area/Subzone and Type of Dwelling, June 2015e.
The population of west coast includes people living in Condo, landed property and other types of buildingsTable 1. Comparison between estimated and actual population statistics and accuracy level.
4.4. Population Estimation Accuracy assessment As shown in Table 1, the accuracy level of 92.5% is remarkable high.
5. CONCLUSION
This paper has examined the applicability and effectiveness of using high-resolution satellite imagery (Google Earth) in extracting building footprints for fine-scale population estimation in the urban area, namely west coast in Singapore. The key results show that the method discussed is capable of producing high accuracy results for estimation of building height, area and volume. It is noteworthy that building classification before building extraction and estimation is necessary. This paper also takes one step further to estimate population based on extracted building information and evaluated the effectiveness of this method.
However, we acknowledge the limitations on both building information extraction and population estimation method. Firstly, some inter building distances are relatively short due to the land use intensity in Singapore. We are unable to capture the portion of shadow falling on another building in close proximity; consequently, the shadow length extraction is less accurate for those buildings. Secondly, the demographic profile of the population hasn’t been considered in this paper, which could help understand population density and distribution in different areas. Thirdly, the accuracy of interpretation on roof area is not high enough. In the future, we will work on a better extraction model with more morphology metrics to be considered.
REFERENCES
Amaral, S., Monteiro, A.M.V., Camara, G. & Quintanilha, J.A. 2006, "DMSP/OLS night-time light imagery for urban population estimates in the Brazilian Amazon", International Journal of Remote Sensing, vol. 27, no. 5, pp. 855-870.
Benediktsson, J.A., Pesaresi, M. & Amason, K. 2003, "Classification and feature extraction for remote sensing images from urban areas based on morphological
transformations", IEEE Transactions on Geoscience and
Remote Sensing, vol. 41, no. 9, pp. 1940-1949.
Bongaarts, J. 2009, "Human population growth and the
demographic transition", Philosophical Transactions of the
Royal Society B: Biological Sciences, vol. 364, no. 1532, pp. 2985-2990.
Deville, P., Linard, C., Martin, S., Gilbert, M., Stevens, F.R., Gaughan, A.E., Blondel, V.D. & Tatem, A.J. 2014, "Dynamic population mapping using mobile phone
data", Proceedings of the National Academy of Sciences of
the United States of America, vol. 111, no. 45, pp. 15888-15893.
Douglass, R.W., Meyer, D.A., Ram, M., Rideout, D. & Song, D. 2015, "High resolution population estimates from
telecommunications data", EPJ Data Science, vol. 4, no. 1,
pp. 1-13.
Greger, K. 2015, "Spatio-Temporal Building Population Estimation for Highly Urbanized Areas Using GIS:
Spatio-Temporal Building Population Estimation", Transactions in
GIS, vol. 19, no. 1, pp. 129-150.
Harvey, J. T., 2003, “Population estimation at the pixel level: developing the expectation maximization
technique”. Remotely Sensed Cities, V. Mesev (Ed.), pp.
181-205.
Jia, P., Qiu, Y. & Gaughan, A.E. 2014, "A fine-scale spatial population distribution on the High-resolution Gridded Population Surface and application in Alachua County, Florida", Applied Geography, vol. 50, pp. 99.
Kuffer, M. & Barrosb, J. 2011, "Urban Morphology of Unplanned Settlements: The Use of Spatial Metrics in VHR
Remotely Sensed Images", Procedia Environmental
Sciences, vol. 7, pp. 152-157.
Lam, N. S. 1983, “Spatial Interpolation Methods: A
Review”, The American Cartographer, vol. 10, no. 2, pp.
129-149.
Li, G., & Weng, Q. 2005, “Using Landsat ETM+ imagery to measure population density in Indianapolis, Indiana, USA”, Photogrammetric Engineering & Remote Sensing, vol. 71, no. 8, pp. 947-958.
Lo, C. P. 2003, “Zone-based estimation of population and housing units from satellite-generated land use/land cover maps. Remotely sensed cities” , pp. 157-180.
LO, C.P. 1995, "Automated population and dwelling unit estimation from high-resolution satellite images: a GIS approach", International Journal of Remote Sensing, vol. 16, no. 1, pp. 17-34.
Lu, D., Weng, Q. & Li, G. 2006, "Residential population estimation using a remote sensing derived impervious surface approach", International Journal of Remote Sensing, vol. 27, no. 16, pp. 3553-3570.
Lu, Z., Im, J., & Quackenbush, L. 2011, “A volumetric approach to population estimation using LiDAR remote
sensing”, Photogrammetric Engineering & Remote Sensing,
vol. 77, no. 11, pp. 1145-1147.
Martin, D., Cockings, S. & Leung, S. 2015, "Developing a Flexible Framework for Spatiotemporal Population
Modeling", Annals of the Association of American
Geographers, vol. 105, no. 4, pp. 754-772.
Qiu, F., Sridharan, H. & Chun, Y. 2010, "Spatial Autoregressive Model for Population Estimation at the Census Block Level Using LIDAR-derived Building Volume
Information", Cartography and Geographic Information
Science, vol. 37, no. 3, pp. 239-257.
Singapore private residential properties vacancy rate is from (
https://www.ura.gov.sg/uol/media-room/news/2015/oct/pr15-50)
Singapore west coast units area information is from Singapore expats website: (https://condo.singaporeexpats.com/)
Smith, S.K., Nogle, J. & Cody, S. 2002, "A Regression Approach to Estimating the Average Number of Persons Per Household", Demography, vol. 39, no. 4, pp. 697-712.
Tang X.L.2014, “Simulation of High Resolution Urban Population Density- a case study in Beibei District, Chong Qing,” (Master dissertation, Southwest University).
Van de Voorde, T., Jacquet, W. & Canters, F. 2011, "Mapping form and function in urban areas: An approach based on urban metrics and continuous impervious surface
data", Landscape and Urban Planning, vol. 102, no. 3, pp.
143-155.
Wang, L. & Wu, C. 2010, "Population estimation using remote sensing and GIS technologies", International Journal of Remote Sensing, vol. 31, no. 21, pp. 5569-5570.
Wang, S., Tian, Y., Zhou, Y., Liu, W. & Lin, C. 2016, "Fine-Scale Population Estimation by 3D Reconstruction of Urban Residential Buildings", Sensors, vol. 16, no. 10, pp. 1755.
Wu, S., Qiu, X. & Wang, L. 2005, "Population Estimation
Methods in GIS and Remote Sensing: A Review", GIScience
& Remote Sensing, vol. 42, no. 1, pp. 80-96.
Xie, Y., Weng, A. & Weng, Q. 2015, "Population Estimation of Urban Residential Communities Using Remotely Sensed
Morphologic Data", IEEE Geoscience and Remote Sensing