Satellite Observed Water Quality Changes in the Laurentian Great Lakes Due to Invasive
Species, Anthropogenic Forcing, and Climate Change
Robert A. Shuchman1, Karl R. Bosse1, Michael J. Sayers1, Gary L. Fahnenstiel1, George Leshkevich2
1 Michigan Tech Research Institute, Michigan Technological University, 3600 Green Court, Ann Arbor, MI 48103, USA –
(shuchman, krbosse, mjsayers, glfahnen)@mtu.edu
2 National Oceanic and Atmospheric Administration (NOAA)/Great Lakes Environmental Research Laboratory (GLERL),
4840 S. State Rd, Ann Arbor, MI 48108, USA – [email protected]
KEY WORDS: Satellite Remote Sensing, Great Lakes, Water Quality, Invasive Species, Climate Change, Anthropogenic
ABSTRACT
Long time series of ocean and land color satellite data can be used to measure Laurentian Great Lakes water quality parameters including chlorophyll, suspended minerals, harmful algal blooms (HABs), photic zone and primary productivity on weekly, monthly and annual observational intervals. The observed changes in these water quality parameters over time are a direct result of the introduction of invasive species such as the Dreissena mussels as well as anthropogenic forcing and climate change. Time series of the above mentioned water quality parameters have been generated based on a range of satellite sensors, starting with Landsat in the 1970s and continuing to the present with MODIS and VIIRS. These time series have documented the effect the mussels have had on increased water clarity by decreasing the chlorophyll concentrations. Primary productivity has declined in the lakes due to the decrease in algae. The increased water clarity due to the mussels has also led to an increase in submerged aquatic vegetation. Comparing water quality metrics in Lake Superior to the lower lakes is insightful because Lake Superior is the largest and most northern of the five Great Lakes and to date has not been affected by the invasive mussels and can thus be considered a control. In contrast, Lake Erie, the most southern and shallow of the Laurentian Great Lakes, is heavily influenced by agricultural practices (i.e., nutrient runoff) and climate change, which directly influence the annual extent of HABs in the Western Basin of that lake.
I. INTRODUCTION
The Great Lakes have been undergoing significant changes in the recent decades based largely on several drivers including climate change, invasive species (specifically the Dreissena
mussels), and anthropogenic forcing.
With regard to climate change, Austin and Colman (2007) found that Lake Superior has experienced a decrease in winter ice cover over the last several decades. This has led to an earlier stratification period in the lake, causing the water temperature to increase more quickly than the surrounding air temperatures. They identified a warming of approximately 2.5 °C from 1979-2006. The Great Lakes basin has also
experienced an increase in extreme precipitation events over the last century (Kunkel et al., 1999). These extreme events have been shown to play a key role in harmful algal bloom occurrences as they lead to large nutrient loadings into the lakes (Michalak et al., 2013).
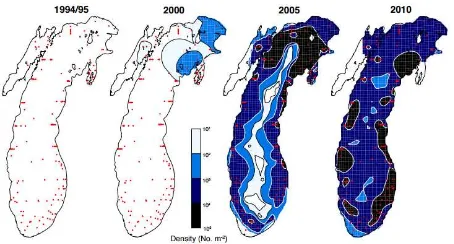
Zebra mussels (Dreissena polymorpha) first colonized the Great Lakes region in 1989 (Nalepa et al., 1998) and quagga mussels (Dreissena rostriformis bugensis) established in the Great Lakes in 1990, reaching Lake Michigan in 1997 (Nalepa et al., 2001). Their expansion has choked out native benthic organisms to the point that the quagga mussel was dominant in nearshore and offshore habitats in Lake Michigan by 2010 (Figure 1, Nalepa et al., 2014). At this point, the Dreissena
mussels have invaded all of the Great Lakes except for Lake Superior, which is too cold and lacking in enough calcium to support colonization. These mussels filter particles, including phytoplankton, from the water column leading to increased water clarity and lower primary production (Vanderploeg et al., 2002). In addition, the Dreissena mussels have been shown to retain nutrients in nearshore littoral zones in a bioavailable form and their hard shells provide suitable habitat for
submerged aquatic vegetation such as Cladophora (Hecky et al., 2004).
Figure 1: Mean density distribution of quagga mussels in Lake Michigan from 1994/1995 to 2010. Small red crosses denote
sampling sites.
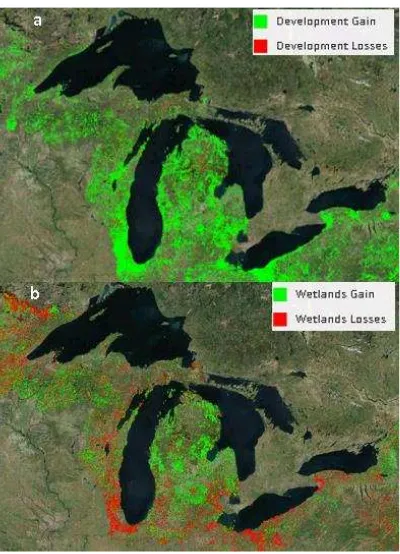
Anthropogenic forcing (aside from human involvement in climate change) is also driving significant changes in Great Lakes water quality. NOAA’s Coastal Change Analysis Program (C-CAP) shows significant increases in developed areas from 1996 to 2010 along the coast of each lake but especially along Lakes Michigan and Erie (Figure 2a). This increased development has been shown to increase runoff volumes (Jennings and Jarnagin, 2002) and there is extensive evidence showing decreased water quality related to urban runoff (Makepeace et al., 1995). Further, C-CAP shows a major loss in wetlands, particularly around Lakes Erie, Michigan, and Ontario (Figure 2b). Considered the kidneys of the Earth, wetlands provide a valuable service in filtering nutrient-rich runoff before it reaches larger systems (Johnston, 2009). Much of the land around the Great Lakes has been used for
decrease in total phosphorus loadings into Lake Erie. However, a report by the International Joint Commission found that dissolved reactive phosphorus loads, which may have a more direct influence on the development of harmful algal blooms, have been increasing since the mid-1990s (IJC, 2014).
Figure 2: a) Gains and losses in land cover classified as developed from 1996 to 2010. b) Gains and losses in land cover classified as wetlands from 1996 to 2010. Data comes
from NOAA’s C-CAP Land Cover Atlas online data viewer.
In order to understand how these drivers are impacting water quality in the Great Lakes, data is needed over a broad spatial and temporal scale. Both EPA and NOAA have run programs over the years to collect in situ physical, chemical, and biological data about the lakes. The EPA performs two annual cruises (in spring and summer) collecting data at a selection of offshore stations in each of the Great Lakes. NOAA has a long-term monitoring program off Muskegon, MI, and more recently has been collecting extensive data in the western basin of Lake Erie. Unfortunately, evaluations of these datasets have shown inconsistencies between agency results and different long-term trends between the data sets in Lake Michigan (Mida et al., 2010). Further, due to time and money constraints, these data collection efforts cover just a small portion of the spatial and temporal variability of the lakes, limiting their usefulness for understanding lake-wide trends.
Satellite-based remote sensing has been used since the 1970s to study water quality. Starting with the Coastal Zone Color Scanner (CZCS) on NASA’s Nimbus 7 satellite and continuing through the European Space Agency’s Sentinel-3 satellite, there is nearly 40 years of continuous coverage of our planet’s waters. Figure 3 shows a selection of satellite missions that have collected ocean and land color imagery.
Once in place, these satellites constantly collect imagery over a broad spatial range, filling a data gap that could not feasibly be filled by in situ data collection efforts. Algorithms to derive biological, physical, and chemical data from imagery have advanced, allowing scientists to generate long-term time series of water quality metrics for the entirety of the Great Lakes. Combining these time series with data on the water quality drivers, we can better understand how climate change, invasive species, and anthropogenic forcing are impacting water quality. This paper will quantify these impacts.
Figure 3: A selection of satellite missions since the 1970s that have collected ocean and land color imagery.
II. METHODS
As the satellite imaging systems have matured over the past 40 years, so too have the water quality algorithms built on top of them. NASA’s Ocean Biology Processing Group (OBPG) makes and distributes many such algorithms, including the
are influenced by suspended minerals and dissolved organic carbon in addition to phytoplankton. Binding et al. (2012) developed an algorithm to derive chlorophyll and suspended sediment concentrations in Lake Erie from red and near-infrared reflectance and Lesht et al. (2013) used a blue-green band ratio technique to derive chlorophyll concentrations for the Great Lakes’ open waters. Shuchman et al. (2013) developed the semi-analytical Color Producing Agents Algorithm (CPA-A) using the full optical spectrum to derive a suite of water quality parameters that works across all Great
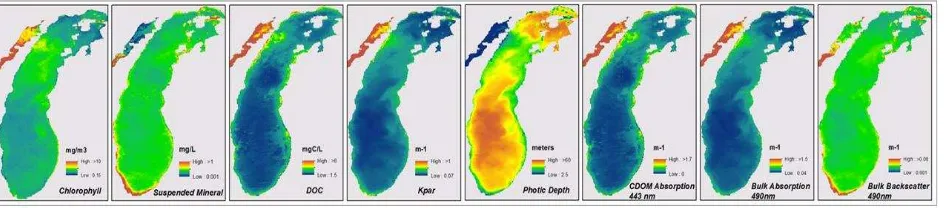
Lakes water types. These parameters include chlorophyll, suspended minerals, dissolved organic carbons, CDOM, attenuation coefficient (Kd), photic zone, absorption, and backscatter, as seen in Figure 4.
This paper will focus on a selection of the CPA-A outputs as well as other satellite-derived water quality parameters including water clarity (photic zone), submerged aquatic vegetation (SAV), primary productivity, and harmful algal blooms. The algorithms used to derive these parameters are described briefly below.
Figure 4: Monthly averaged CPA-A outputs for Lake Michigan from July 2013.
Water Clarity/Photic zone
The foundation for the water clarity parameter studied in this paper is the light attenuation coefficient at 490 nm product (Kd_490) distributed by the NASA OBPG with the MODIS level 2 images. This product uses a ratio of the remote sensing reflectance returns in the blue and green wavelengths (488 nm and 547 nm for MODIS) to derive Kd490. Using equations presented in Saulquin et al. (2013), Kd490was converted to KdPAR. Finally, photic zone is calculated as 4.605/ KdPAR (Lee et al., 2007).
The photic zone was derived for each of the MODIS Aqua images from 2003-2013 (Level 2 images were downloaded from NASA OceanColor’s Level 1 & 2 Data Browser) then aggregated up to a yearly average product for each of the upper three Great Lakes (Lakes Huron, Michigan, and Superior). Using the bathymetry maps available from NOAA’s National Centers for Environmental Information (NCEI), yearly average photic zone depth was calculated for nearshore (water depth 30 meters or less) and offshore (water depth greater than 30 meters) regions of each lake.
Submerged Aquatic Vegetation
Shuchman, Sayers et al. (2013) developed the Submerged Aquatic Vegetation Mapping Algorithm (SAVMA) based on a technique by Lyzenga (1981) to correct for water depth. The SAVMA, working off of Landsat satellite scenes, classifies lake bottoms into three types (bare substrate/sand, dense SAV, and less dense SAV) and derives an SAV biomass estimate. Brooks et al. (2015) used the SAVMA to create comprehensive SAV maps for the nearshore zone of the lower four Great Lakes (Lakes Erie, Huron, Michigan, and Ontario). Using imagery from various satellites from the Landsat constellation dating back to the 1970s, Brooks et al. identified the area classified as SAV approximately every five years.
Primary Productivity
Fahnenstiel et al. (2016) derived a method to estimate lake-wide primary production for the upper three Great Lakes using the CPA Algorithm (Shuchman et al., 2013) against MODIS
imagery and a Great Lakes-specific production model (Lang and Fahnenstiel, 1995). They used this technique to estimate lake-wide production from 2010-2013 and were able to identify significant declines in productivity for Lakes Huron and Michigan since the 1960s/1970s.
Applying Fahnenstiel’s technique to other sensors, including the CZCS, SeaWiFS, and VIIRS, allows for a historical understanding of primary productivity in the Great Lakes and how it has been impacted by various drivers.
Harmful Algal Blooms
The CPA-A was shown to effectively measure chlorophyll concentrations in the Great Lakes but it does not specifically measure the abundance of blue-green algae (or cyanobacteria) and thus cannot be used by itself to determine the presence of harmful algal blooms. Sayers et al. (2015) developed multiple techniques to determine the presence of blue-green algae based on empirical relationships with other environmental variables specific to the Great Lakes. One approach, the modified CPA-A HCPA-ABs (MCH), identifies cyanobacteria within the water column. It indicates cyanobacteria presence when the CPA-A chlorophyll retrieval exceeds a minimum threshold (18 mg/m3) and the water temperatures exceed 20 °C. The other technique, called the Surface Scum Index (SSI), relies on the evidence that large concentrations of the predominant blue-green algal strain in the Great Lakes (Microcystis) are often found floating on the lake’s surface. The SSI, an implementation of the NDVI, uses the difference between reflectance in the visible spectrum and the near infrared to determine if there is green vegetation on the water surface. A positive SSI value indicates floating
III. RESULTS Water Clarity/Photic Zone
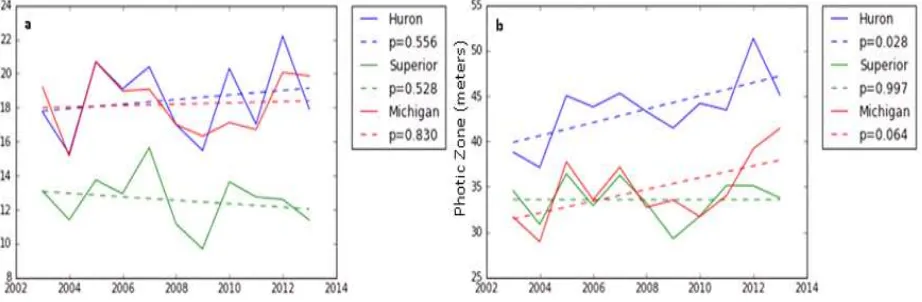
Figure 5 shows the yearly change in water clarity from 2003 – 2013 for both nearshore (Figure 5a) and offshore areas (Figure 5b) within Lakes Huron, Michigan and Superior. There is no significant change in photic zone in nearshore areas. This result is expected as the zebra mussels had already invaded the nearshore areas in Lakes Huron and Michigan by the year 2000. The offshore areas show a clear increase in water clarity for Lakes Huron and Michigan, with average yearly increases of 0.73 meters and 0.65 meters, respectively. This tracks with Nalepa’s finding that the offshore areas of these lakes were being colonized by quagga mussels throughout the 2000s (Nalepa et al., 2014). The flat or decreasing trends for Lake Superior fit with the view of this lake as a control point as it has not been invaded by the Dreissena mussels.
Submerged Aquatic Vegetation
Figure 6 shows the area mapped as submerged aquatic vegetation (SAV) for five focus areas in the Great Lakes from the mid-1970s to approximately 2010 (the years for each focus area depend on when acceptable Landsat data was available). The plot also includes vertical lines indicating key dates related to drivers of SAV. Phosphorus loading controls were
implemented in 1980 to help curb the impact of agricultural runoff, and the plot shows that mapped SAV area declined for several of the focus areas over the following decade. The second vertical line is in the early 1990s marking the establishment of the Dreissena mussels in the Great Lakes. With the exception of the Bruce Peninsula focus area in Lake Huron, this point marked the start of a steep increase in SAV area clearly showing the severe impact that invasive species have had on this parameter.
Primary Production
Figure 7 shows the average daily primary production for Lake Michigan for four years between 1980 and 2012, using Fahnenstiel’s technique against four different satellites. Again, this plot includes a vertical line indicating when the quagga mussels established in Lake Michigan. There was a slight
decline in the daily primary production between 1980 and 2000 coinciding with the decline in phosphorus loadings. After the establishment of the quagga mussels in the early 2000s the daily primary production immediately dropped off as the algal particles were filtered out of the water column. This plot shows the value of the long satellite data record, as the MODIS satellite imagery record only goes back to 2002, missing the pre-Dreissena invasion baseline.
Harmful Algal Blooms
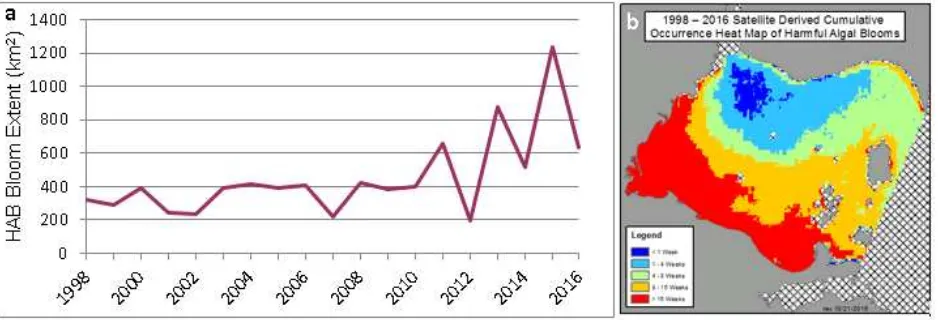
Figure 8a shows the time series from 1998 through 2016 of the satellite-derived total harmful algal bloom extent (the sum of MCH and SSI) for the western basin of Lake Erie. It is evident that the HABs abundance has been increasing since 2010, though there are alternating peaks and valleys. Sayers et al. (2016) showed that the HABs extent is significantly correlated with the spring discharge. As climate change leads to more extreme precipitation events, larger HAB blooms can be expected in Lake Erie. Figure 8b shows the cumulative heat map of HABs occurrence, indicating the regions of the lake that are being impacted most by the blooms. The western and southern shores of Lake Erie’s western basin, where the Maumee River drains into the lake, have seen greater than 16 weeks of HABs since 1998. The majority land use of the Maumee River watershed is cultivated crops, leading to more large nutrient loads including phosphorus in the river discharge.
Color Producing Agents
The primary color producing agents in the Great Lakes are chlorophyll, suspended minerals, dissolved organic carbon, and CDOM. Using the CPA-A, these metrics have been estimated in the Great Lakes over the MODIS data record, dating back to 2002. Corresponding with the primary production results, it was shown that average chlorophyll concentrations declined in Lakes Huron and Michigan and remained steady in Lake Superior. Suspended minerals concentrations declined over this same time period. Initial analyses revealed no identifiable trends in the dissolved organic carbon metric, but this is still under investigation. CDOM concentrations are derived from dissolved organic carbon with a simple empirical formula and will thus follow the same trends.
Figure 6: Mapped SAV area for five focus areas within the lower four Great Lakes. Each focus area is normalized to the initial SAV area to compare growth between focus areas.
Figure 7: Average daily primary production for Lake Michigan at select time points since 1980.
Figure 8: a) Time series of total harmful algal bloom extent from 1998 – 2016. b) Cumulative heat map of harmful algal blooms from 1998-2016. The colors indicate the length of time that each pixel has been covered by HABs over the 19-year study period.
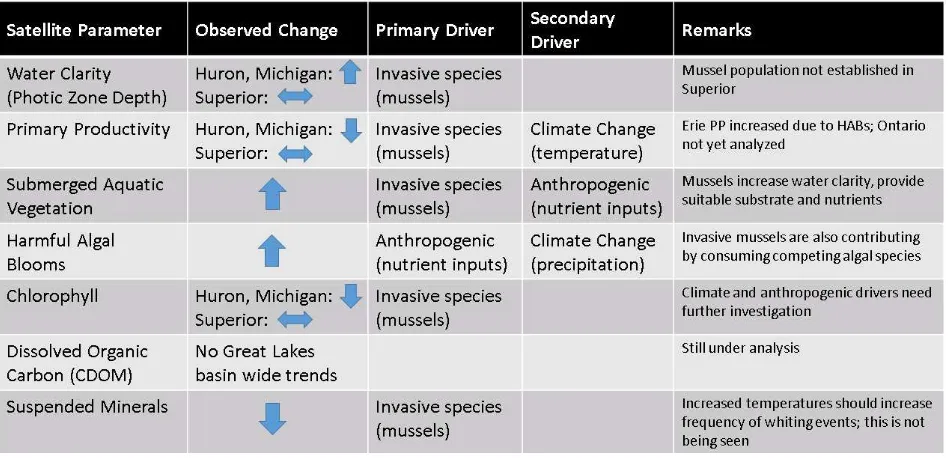
Table 9: Summary of satellite observed water quality changes along with the drivers of the changes.
IV. DISCUSSION & SUMMARY A summary of the observed water quality changes are presented in Table 9, along with the primary and secondary drivers of each change.
The MODIS satellite data, over the relatively short 11-year time period of 2003-2013, documented that the photic zone was significantly increasing in the offshore regions of Lakes Huron and Michigan. This corresponds with the colonization of the deep lake bottoms by quagga mussels. Lake Superior, which has not been colonized due to cold temperatures and limited calcium, did not show any change, supporting its use as a control. No significant photic zone changes were observed in the nearshore because these regions had been thoroughly colonized by mussels prior to 2003. Extending the time series earlier by using other ocean and land color satellites should further demonstrate that the nearshore photic zone increased in Lakes Huron and Michigan after 1989 when zebra mussels were first established in the lakes.
The analysis of 40 years of Landsat imagery showed that the abundance of submerged aquatic vegetation is linked to anthropogenic factors, namely nutrient inputs, and the
establishment of the Dreissena mussels in the Great Lakes. The impact of nutrient inputs is clearly seen in Figure 6 as the SAV abundance declined in the decade after phosphorus loading began to be controlled. However, this positive impact was negated by the emergence of the mussels. Once the mussel colonies established themselves in the lakes in the early 2000s they began filtering the algae and other particles from the water column, allowing light to reach deeper and thus expanding the benthic zone for SAV growth. Additionally, the mussels’ shells provided more expansive hard substrate required by
Cladophora (the dominant SAV in the Great Lakes) as well as making nutrients bioavailable to SAV.
Despite the increase in submerged aquatic vegetation, the satellite record shows a marked decrease in primary production (as well as chlorophyll and suspended minerals) of the upper Great Lakes. Again, this is largely due to the mussels filtering the algae and other particles out of the water column. The rising temperatures of the Great Lakes should be resulting in an
increase in primary productivity as it lengthens the season when photosynthesis can occur, however the impact of the mussels masks any such impact. Increasing temperatures were also expected to result in increased suspended minerals concentrations as whiting events became more frequent and intense. However, these events are driven by the precipitation of calcium, which is largely being taken up by the mussels.
The combined SeaWiFS and MODIS record also shows a recent increase in HAB extents in the Western Basin of Lake Erie. This is partially driven by the selective filtering of green algals by the invasive mussels, reducing competition for the blue-green algae. The primary driver of increased HABs is the nutrient inputs from agricultural-dominated land transported to the lake through rivers. The rise in extreme precipitation events brought about by climate change exacerbates the nutrient loading (Sayers et al., 2016).
In summary, by utilizing the extensive archive of ocean and land color sensing satellites, we are able to broaden our understanding of how Great Lakes water quality is changing over time, particularly in response to known drivers of change. Remote sensing allows us to fill in the extensive gaps in the data record due to time, financial constraints, and lack of knowing what to monitor.
V. ACKNOWLEDGEMENTS
VI. REFERENCES
Austin, J.A. and S.M. Colman. 2007. Lake Superior summer water temperatures are increasing more rapidly than regional air temperatures: A positive ice‐albedo feedback. Geophysical Research Letters, 34(6).
Binding, C.E., Greenberg, T., and R.P. Bukata. 2012. An analysis of MODIS-derived algal and mineral turbidity in Lake Erie. Journal of Great Lakes Research, 38(1), 107-116.
Brooks, C., Grimm, A., Shuchman, R., Sayers, M. and N. Jessee. 2015. A satellite-based multi-temporal assessment of the extent of nuisance Cladophora and related submerged aquatic vegetation for the Laurentian Great Lakes. Remote Sensing of Environment, 157, 58-71.
Fahnenstiel, G. L., Sayers, M., Shuchman, R. A., Yousef, F., and S. Pothoven. 2016. Lake-wide phytoplankton production and abundance in the Upper Great Lakes: 2010-2013. Journal of Great Lakes Research, 42(3), 619-629.
Hecky, R.E., Smith, R.E., Barton, D.R., Guildford, S.J., Taylor, W.D., Charlton, M.N. and T. Howell. 2004. The nearshore phosphorus shunt: a consequence of ecosystem engineering by dreissenids in the Laurentian Great Lakes. Canadian Journal of Fisheries and Aquatic Sciences, 61(7), 1285-1293.
IJC. 2014. A Balanced Diet for Lake Erie: Reducing
Phosphorus Loadings and Harmful Algal Blooms. Report of the Lake Erie Ecosystem Priority. International Joint Commission (IJC), Windsor, Ontario. [Available at
http://www.ijc.org/en_/leep/report]
Jennings, D.B. and S.T. Jarnagin. 2002. Changes in anthropogenic impervious surfaces, precipitation and daily streamflow discharge: a historical perspective in a mid-Atlantic subwatershed. Landscape Ecology, 17(5), 471-489.
Johnston, C.A. 1991. Sediment and nutrient retention by freshwater wetlands: effects on surface water quality. Critical Reviews in Environmental Science and Technology, 21(5-6), 491-565.
Kunkel, K.E., Andsager, K. and D.R. Easterling. 1999. Long-term trends in extreme precipitation events over the
conterminous United States and Canada. Journal of Climate, 12(8), 2515-2527.
Lang, G.A. and G.L. Fahnenstiel. 1995. Great Lakes production model: methodology and use. Ann Arbor, MI: NOAA
Technical Memorandum.
Lee, Z., Weidemann, A., Kindle, J., Arnone, R., Carder, K.L. and C. Davis. 2007. Euphotic zone depth: Its derivation and implication to ocean‐color remote sensing. Journal of Geophysical Research: Oceans, 112(C3).
Lesht, B.M., Barbiero, R.P. and G.J. Warren. 2013. A band-ratio algorithm for retrieving open-lake chlorophyll values from satellite observations of the Great Lakes. Journal of Great Lakes Research, 39(1), 138-152.
Lyzenga, D.R. 1981. Remote sensing of bottom reflectance and water attenuation parameters in shallow water using aircraft and Landsat data. International Journal of Remote Sensing, 2(1), 71-82.
Makepeace, D.K., Smith, D.W. and S.J. Stanley. 1995. Urban stormwater quality: summary of contaminant data. Critical Reviews in Environmental Science and Technology, 25(2), 93-139.
Michalak, A. M. and 27 others. 2013. Record-setting algal bloom in Lake Erie caused by agricultural and meteorological trends consistent with expected future conditions. Proceedings of the National Academy of Sciences, 110(16), 6448-6452.
Mida, J.L., Scavia, D., Fahnenstiel, G.L., Pothoven, S.A., Vanderploeg, H.A., and D.M. Dolan. 2010. Long-term and recent changes in southern Lake Michigan water quality with implications for present trophic status. Journal of Great Lakes Research, 36 (S3), 42–49.
Nalepa T.F., Hartson D.J., Fanslow D.L., Lang G.A. and S.J. Lozano. 1998. Declines in benthic macroinvertebrate
populations in southern Lake Michigan, 1980– 1993. Canadian Journal of Fisheries and Aquatic Sciences, 55(11), 2402–2413.
Nalepa T.F., Schloesser D.W., Pothoven S.A., Hondorp D.W., Fanslow D.L., Tuchman M.L. and G.W. Fleischer. 2001. First finding of the amphipod Echinogammarus ischnus and the mussel Dreissena bugensis in Lake Michigan. Journal of Great Lakes Research, 27(3), 384–391.
Nalepa, T.F., Fanslow, D.L., Lang, G.A., Mabrey, K. and M. Rowe. 2014. Lake-wide benthic surveys in Lake Michigan in 1994–95, 2000, 2005, and 2010: abundances of the amphipod Diporeia spp. and abundances and biomass of the mussels Dreissena polymorpha and Dreissena rostriformis bugensis. In NOAA Technical Memorandum GLERL-164. NOAA, Great Lakes Environmental Research Laboratory Ann Arbor, MI.
Saulquin, B., Hamdi, A., Gohin, F., Populus, J., Mangin, A. and O.F. d'Andon. 2013. Estimation of the diffuse attenuation coefficient KdPAR using MERIS and application to seabed habitat mapping. Remote Sensing of Environment, 128, 224-233.
Sayers, M., Fahnenstiel, G.L., Shuchman, R.A. and M. Whitley. 2016. Cyanobacteria blooms in three eutrophic basins of the Great Lakes: a comparative analysis using satellite remote sensing. International Journal of Remote Sensing, 37(17), 4148-4171.
Shuchman, R. A., Leshkevich, G., Sayers, M. J., Johengen, T. H., Brooks, C. N., and D. Pozdnyakov. 2013. An algorithm to retrieve chlorophyll, dissolved organic carbon, and suspended minerals from Great Lakes satellite data. Journal of Great Lakes Research,39(S1), 14-33.
Shuchman, R.A., Sayers, M.J. and C.N. Brooks. 2013. Mapping and monitoring the extent of submerged aquatic vegetation in the Laurentian Great Lakes with multi-scale satellite remote sensing. Journal of Great Lakes Research, 39, 78-89.