CHAPTER III
RESEARCH METHODOLOGY
A. Research Methods
The research method that used in this research was Pre-Experimental Method or in the other word called as Weak-Experimental Method. It was called as pre-experimental because they provide little or no control of extraneous factors (Ary, 2010). Extraneous factors are any influences in the selection of participants, the procedures, the statistics, or the design likely to affect the outcome and provide an alternative explanation for our results than what we expected (Creswell, 2012). In pre-experimental method, we are not considering this research as truly occurs in real life, because in real life there are several extraneous factor that affecting the dependent variable, so that the result of the experiment will not only caused by dependent that treated by independent variable. But pre-experimental method is used in this research because the author is not able to control many variables that might affect the result of experiment, in return, the author tries to adding one extraneous factor to be analyzed in this research, that is students’ learning style (Sugiono, 2015).
B. Research Design
The design that used in this research was one-group pretest–posttest design, it usually involves three steps: (1) administering a pretest measuring the dependent variable; (2) applying the experimental treatment X to the subjects; and (3) administering a posttest, again measuring the dependent variable. Differences attributed to application of the experimental treatment are then evaluated by comparing the pretest and posttest scores.
Table 3.1 One-Group Pretest-Posttest Design
Pretest Independent Posttest
Y1 X Y2
Information:
Y1 : represents the dependent variable before the manipulation of the independent variable X; it is usually a pretest of some type administered before the experimental treatment
X : represents the independent variable, which is manipulated by the experimenter; we also refer to it as the experimental variable or the treatment.
Y2 : represents the dependent variable after the manipulation of the independent variable X; it is usually a posttest administered to subjects after the experimental treatment.
(Ary, 2010)
Figure 3.1 One-Group Pretest-Posttest Research Design
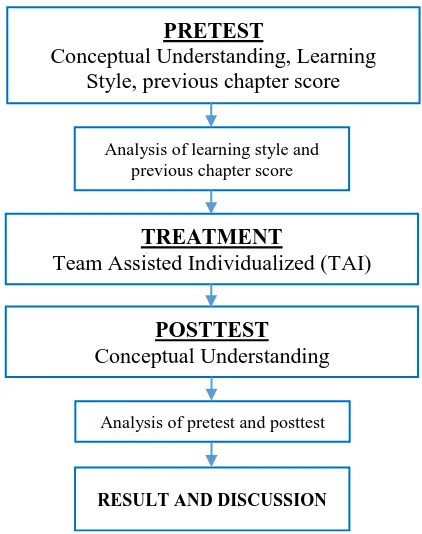
In this research design, after pretest was taken, the author doing the analysis of learning style and previous chapter score. Learning style result was used to see the composition of the class and adjusting the lesson plan of TAI for conducting the learning activity. While for the analysis result of previous chapter score was used for determining the composition of the group within the class. In
PRETEST
Conceptual Understanding, Learning Style, previous chapter score
TREATMENT
Team Assisted Individualized (TAI)
POSTTEST Conceptual Understanding
Analysis of learning style and previous chapter score
Analysis of pretest and posttest
one class there were nine groups that consist of combination of lower, middle and higher achiever.
C. Population and Sample
The location of this research is Public Junior High School “X” in
Kabupaten Bandung. The population in this research were all 8th grade students at Public Junior High School in Kabupaten Bandung. The samples are 8th grade students from one class in Public Junior High School “X” in Kabupaten Bandung. The sampling technique that used is purposive sampling. This sampling technique is based on a certain consideration or purpose and this technique is suitable for the research that will not generalize its result (Sugiono, 2015).
The researcher intends to proof that students with different learning style will have a different improvement of learning if a certain learning method is applied, thus the researcher try to find a class with a lower achievement through teacher recommendation that proven by previous chapter score. The lower
achiever class was used in the purpose of this research. “There is no learning difficulties, but teaching difficulties does” (Prashnig, 2007). That statement
strengthening the researcher’s assumption that each student that included to a lower achiever was not because they are not capable, but perhaps they are
different and didn’t know how is their learning preferences, so that before
applying the treatment the researcher do the initial study about students’ achievement and learning style, then in the beginning of learning activity the researcher tell the students about their learning style according to the questionnaire result in order to give a reference about their learning style and how to adjust with learning activity. Because teaching is considered as the one who has the difficulties, then the researcher try to conduct the learning activity that respect
to the students’ heterogeneity.
D. Operational Definition
a. Team Assisted Individualization (TAI) is the combination of cooperative learning with individualized programmed instruction. Learning process is conducted through several steps such as placement test, teaching the material, work on individualized curriculum materials, team study method, teaching group, group paced unit, team scoring and team recognition. This stage was ensured by observation sheet.
b. Learning style in this research refer to VARK Learning Style questionnaire version 7.8 (2014) that authored by Neil Donald Fleming and held by VARK Learn Limited, Christchurch, New Zealand.
c. Conceptual understanding in this research is referring to theory from Revised Bloom Taxonomy (Anderson et al., 2001). There were three from six scale of cognitive domain, they are remember (C1), understand (C2) and apply (C3). This competence is measured by using multiple choice questions (pre-test and
post-test)
d. The research was using pre-experiment one-group pre-test post-test, it means that there is only one class that given a treatment. Within this class the
students were tested regarding their learning style. After the treatment was
given, then the results were compared according to student learning style
within the class.
E. Assumption
The assumption that used as the foundation of this study are: 1. Learning style do affect the students’ achievement.
2. Optic is a complex concept that involve four kind of learning preference in the learning activity. It needs visual, aural, read and kinesthetic learning aid in conducting the learning activity, thus a proper learning method
would affect students’ conceptual understanding in all kind of learning
style.
F. Hypothesis
Hypothesis that is tested in this study are as follow:
understanding in learning optics after applying Team Assisted Individualized.
H1 : There is significant main difference of students’ conceptual understanding in
learning optics after applying Team Assisted Individualized.
G. Research Instrument
In this research, instrument is necessary to be used for gaining data. There are three types instrument that are used in this research:
Table 3.2 Table of Instrument Needs of Research
Data Needs Instrument
Test of students’ learning style Questionnaire of Learning Style (VARK)
Test for pre-test and post-test Objective Test
Check the learning activity (TAI) Observation sheet
Those instruments are described below. 1. Questionnaire of Learning Style
Questionnaire is a bunch of written question to get some information from the respondent (Suparno, 2014). This instrument was used to measure
calculation was done, thus the researcher only can input the data and get the result.
2. Observation Sheet
Observation sheet in this research is used to make sure that the teaching procedures are based on Team Assisted Individualization (TAI) model. It will specifically assess whether the step conducting by the researcher is appropriate or not.
Table 3.3 Observation Sheet of TAI learning model
No Indicator Activity Yes/No
1 Placement test Give a pre-test to the student
2 Teaching the material
Teach the initial material about temperature to the students in the class
3 Work on individualized materials
Give a worksheet to each student with different unit according to
difficulties, they have to ask their group member before asked to the teacher
5 Teaching group
Teach the students with each same rates of learning to emphasize what they should know and to know their progress. While the other students program and teaches a lesson to the entire class.
7 Team Scores and Team Recognition
Count the total score of the group based on the unit finished and total correct answer of all group
member. After that give
appreciation to group performance.
Objective test is a test item format that provide two or more possible responses and require the examinee to make a selection, then latter the results can be scored with little subjectivity (Crocker and Algina, 2008). Objective test that was used in this research used to measure students’ understanding both in pre-test and post-test and the format is multiple choice. Crocker and Algina (2008) state that multiple choice is a stem in which the question or problem is posed; a correct response or keyed response; and two or more incorrect responses, which are called foils. The multiple choices have covered the question based on Bloom Taxonomy from C1 until C3 cognitive dimension. The number of test item that used is 20 test items.
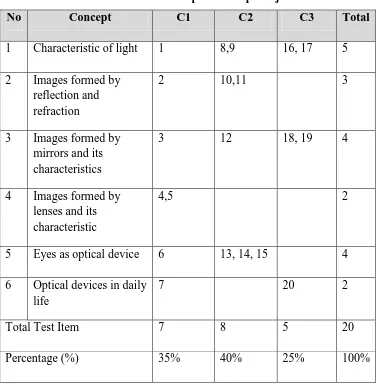
Table 3.4 Blue Print of Optic Concept Objective Test
No Concept C1 C2 C3 Total
1 Characteristic of light 1 8,9 16, 17 5
2 Images formed by reflection and refraction
2 10,11 3
3 Images formed by mirrors and its characteristics
3 12 18, 19 4
4 Images formed by lenses and its characteristic
4,5 2
5 Eyes as optical device 6 13, 14, 15 4
6 Optical devices in daily life
7 20 2
Total Test Item 7 8 5 20
The usage of objective test are: a. Pre-test
Pre-test was conducted before teaching activity, the purpose is to know
students’ prior knowledge.
b. Post-test
Post-test was conducted after the treatment using TAI was done, the
purpose is to measure students’ knowledge about optics concept after
learning with TAI model whether there is improvement or not. The test item was validating through several steps as follows:
1. Validity
Validity was defined as the extent to which an instrument measured what
it claimed to measure. Validity concern with interpretations or inferences
that are drawn based on expert judgement. Refers to the appropriateness,
meaningfulness, correctness, and usefulness of any inferences a
researcher draws based on data obtained through the use of an instrument
(Fraenkel et al., 2011). A test may be valid for use with one population or
setting but not with another. The process of gathering evidence to support
(or fail to support) a particular interpretation of test scores is referred to
as validation. We need evidence to establish that the inferences, which
are made on the basis of the test results, are appropriate (Ary et al.,
2010). The formula to determine validity is:
…... ... (4) Where:
r xy = coefficient correlation or item validity
∑ X = sum of total score of all students for each question item ∑ Y = sum of total score of all students for whole test
N = total number of student
X = score of each student for each question’s item
Y = total score of each student
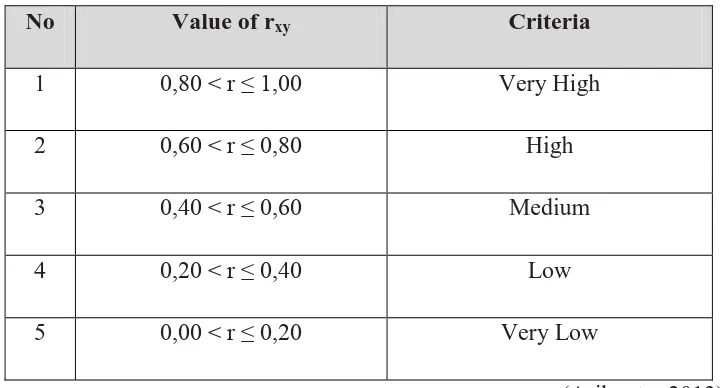
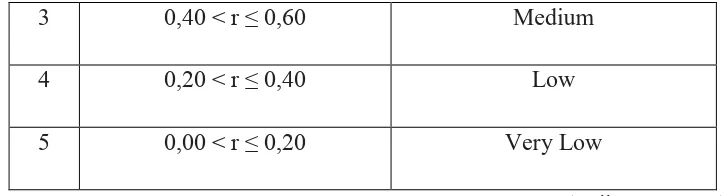
Table 3.5 Interpretation of Validity
No Value of rxy Criteria
1 0,80 < r ≤ 1,00 Very High
2 0,60 < r ≤ 0,80 High
3 0,40 < r ≤ 0,60 Medium
4 0,20 < r ≤ 0,40 Low
5 0,00 < r ≤ 0,20 Very Low
(Arikunto, 2013)
2. Reliability
Reliability of a measuring instrument is the degree of consistency
with which it measures whatever it is measuring. Reliability is concerned
with the effect of error on the consistency of scores (Ary et al., 2010).
The formula used to measure reability of test item in this research is
using Kuder-Richardson formula as follow:
[ ] [ ]
Where:
K = number of items on the test
M = mean of the set of test scores
SD = standard deviation of the set of test scores
(Fraenkel et al., 2011)
Table 3.6 Interpretation of Reability
No Reability Coefficient Criteria
1 0,80 < r ≤ 1,00 Very High
2 0,60 < r ≤ 0,80 High
3 0,40 < r ≤ 0,60 Medium
4 0,20 < r ≤ 0,40 Low
5 0,00 < r ≤ 0,20 Very Low
(Arikunto, 2013)
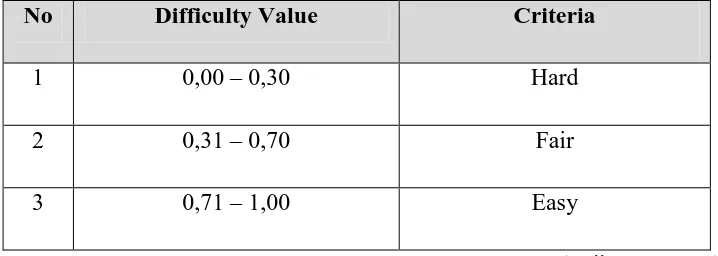
3. Difficulty Level
Difficulty level may be defined as the proportion of the examinees that marked the item correctly. Item difficulty is the percentage of students that correctly answered the item. Since the test item have a big role in determining the result of the research, then the test item difficulty should be arranged in balance, thus the students will not feel desperate or even think that the test is too easy. A test item was considered as easy if the distractor is not related with the question and students deeply understand about the content. A test item was considered as difficult if the key answer is wrong, there are more than one answer, the question is awkward, the sentence arrangement is confusing, students cannot answer the question, too complex, too long, too much question or run out of time (Rustaman, 2015). The formula to determining difficulty level is shown as follow:
Where:
RU = the number of student in the upper group who responded correctly
R1 = the number of student in the lower group who responded correctly
NU = number of student in the upper group N1 = number of student in the lower group
(Boopathiraj and Chellamani, 2013) Table 3.7 Interpretation of Difficulty Level
No Difficulty Value Criteria
1 0,00 – 0,30 Hard
2 0,31 – 0,70 Fair
3 0,71 – 1,00 Easy
(Arikunto, 2013)
4. Discriminating Power
Discriminating power of a test item refers to the degree to which success or failure on an item indicates possession of the ability being measured. It determines the extent to which the given item discriminates among examinees in the function or ability measured by the item. This value ranges between 0.0 and 1.00. A highly discriminating item indicates that the students who had high tests scores got the item correct whereas students who had low test scores got the item incorrect (Boopathiraj and Chellamani, 2013). The formula for measuring Discrimination Power is:
Where:
RU = the number of student in the upper group who responded correctly
R1 = the number of student in the lower group who responded correctly
NU = number of student in the upper group N1 = number of student in the lower group
(Boopathiraj and Chellamani, 2013) Table 3.8 Interpretation of Discriminating Power
No Discriminating Power Value Criteria
1 0,00 – 0,20 Poor
2 0,21 – 0,40 Fair
3 0,41 – 0,70 Good
4 0,71 – 1,00 Very Good
(Arikunto, 2013)
5. Distractor
Distractor analysis is used to figure out how the distracters were able to function effectively by drawing the test takers away from the correct answer. Distractor analysis is important for us to be mindful of the distractors that we use in a multiple choice format test. When distractors are not effective they are virtually useless because there is a greater possibility that students are able to select the correct answer by guessing as the options have been reduced (TESL, 2013). According to Rustaman (2015), the characteristic of a good distractor are:
1) Choosen by the student, especially lower group
2) Mostly choosen by lower group rather than higher group
3) The amount of higher group who choose the distractor is lower than higher group who choose the key answer.
4) At least choosen by 5% of students
H. Instrument Analysis Result
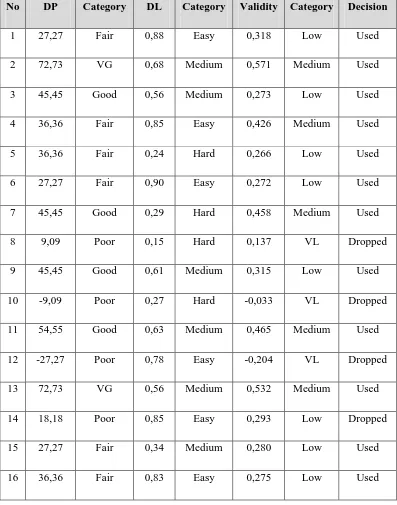
1. Recapitulation of Students’ Understanding Instrument
material that was given in the research. The result of the test then tested by validity, reability, discriminating power and difficulty level. The recapitulation of test item analysis is shown as follows:
Test Item Recapitulation :
Reability test : 0,79 (High degree of reability)
Table 3.9 Recapitulation of Test Item for Students’ Conceptual
Understanding
No DP Category DL Category Validity Category Decision
1 27,27 Fair 0,88 Easy 0,318 Low Used
2 72,73 VG 0,68 Medium 0,571 Medium Used
3 45,45 Good 0,56 Medium 0,273 Low Used
4 36,36 Fair 0,85 Easy 0,426 Medium Used
5 36,36 Fair 0,24 Hard 0,266 Low Used
6 27,27 Fair 0,90 Easy 0,272 Low Used
7 45,45 Good 0,29 Hard 0,458 Medium Used
8 9,09 Poor 0,15 Hard 0,137 VL Dropped
9 45,45 Good 0,61 Medium 0,315 Low Used
10 -9,09 Poor 0,27 Hard -0,033 VL Dropped
11 54,55 Good 0,63 Medium 0,465 Medium Used
12 -27,27 Poor 0,78 Easy -0,204 VL Dropped
13 72,73 VG 0,56 Medium 0,532 Medium Used
14 18,18 Poor 0,85 Easy 0,293 Low Dropped
15 27,27 Fair 0,34 Medium 0,280 Low Used
No DP Category DL Category Validity Category Decision
17 27,27 Fair 0,51 Medium 0,223 Low Used
18 81,82 VG 0,49 Medium 0,632 V High Used
19 36,36 Fair 0,15 Hard 0,435 Medium Used
20 27,27 Fair 0,51 Medium 0,281 Low Used
21 -27,27 Poor 0,29 Hard -0,160 VL Dropped
22 -9,09 Poor 0,24 Hard -0,075 VL Dropped
23 45,45 Good 0,29 Hard 0,406 Medium Used
24 63,64 Good 0,71 Easy 0,520 Medium Used
25 54,55 Good 0,61 Medium 0,459 Medium Used
26 0,00 Poor 0,10 Hard 0,024 VL Dropped
27 27,27 Fair 0,56 Medium 0,285 Low Used
28 36,36 Fair 0,59 Medium 0,252 Low Used
29 0,00 Poor 0,32 Medium 0,083 VL Dropped
30 27,27 Fair 0,80 Easy 0,275 Low Used
31 27,27 Fair 0,51 Medium 0,153 VL Dropped
32 36,36 Fair 0,76 Easy 0,293 Low Used
33 0,00 Poor 0,22 Hard 0,049 VL Dropped
34 27,27 Fair 0,15 Hard 0,303 Low Used
35 0,00 Poor 0,95 Easy 0,025 VL Dropped
36 45,45 Good 0,76 Easy 0,375 Low Used
There are two kinds of instruments that not including to form of instrument to obtain the qualitative data. There are questionnaire of learning style and rubric of TAI observation sheet.
The rubric of TAI observation sheet is assessing the criteria of learnig activity. The instrument was validated by the supervisor and lecturer. In the usage of the observation sheet, the observer fills the rubric by look at the activity that conducted in the class and give a checklist if the activity has already done.
Questionnaire of learning style are assessing students learning style by raising some question that need to to be answered. The questionnaire has already provided by VARK Learn Limited, Christchurch, New Zeland, that authored by Neil Donald Fleming. The validation is conducted for the translating the questionnaire from English to Indonesian. This questionnaire consists of the daily activity and the response that they might choose in a certain condition. They are allowed to choose more than one answer in one question. The data was obtained in the beginning before the treatment.
I. Data Processing Technique
There are two kind of data that used in this research, the quantitative and qualitative data. Quantitative data was obtained through objective test in pre-test and post-test, while qualitative data was obtained through questionnaire and rubric of observation sheet. Thus the data processing technique were done as follows:
1. Quantitative Data Processing a. Score of Item Test
The score of test item for measuring the improvement of students conceptual understanding are obtained from the set of test item that consist of 20 questions. Each question is given one score if correct and zero if uncorrect.
The change or gain score was calculated using normalized gain <g>. The normalized gain measures the fraction of the available improvement that is obtained.
Gain score can be obtained by the formula as follows:
<G> = actual average gain <Sf> = final (post) class average <Si> = initial (post) class average
(Hake, 1999) The formula for measuring the normalized gain is shown as follow:
Information:
<g> = average normalized gain <G> = actual average gain <Sf> = final (post) class average <Si> = initial (post) class average
(Hake, 1999) Table 3.10 Interpretation of Normalized Gain Score
No Normalized Gain Score <g> Criteria
1 (<g>) > 0.7 High
2 0.7 ≥ (<g>) ≥ 0.3 Fair
3 (<g>) < 0.3. Low
(Hake, 1999) c. T-test Paired Sample Test
A paired t-test is used to compare two population means where you have two samples in which observations in one sample can be paired with observations in the other sample. Examples of where this might occur is before-and-after observations on the same subjects (Shier, 2004).
... (8)
The result of t-test paired sample test was calculated using Microsoft Excel 2016. If the t count is higher than t table, then H0 was rejected. If t count is lower than t table, then H0 was accepted.
Hypothesis that is tested in this study are as follow:
H0 : There is no significant main difference of students’ conceptual
understanding in learning optics after applying Team Assisted Individualized.
H1 : There is significant main difference of students’ conceptual
understanding in learning optics after applying Team Assisted Individualized.
2. Qualitative Data Processing a. Learning Style Questionnaire
The technique of learning style data processing was not available for the author because VARK is the commercial product of VARK Ltd. But the score result of each Learning Style can be re-analyzed to predict the determination of learning style, eventough the result is not too accurate, but at least it can determine the main learning style correcty. b. Rubric of Observation Sheet
In this research, the author calculates the result of observation sheet rubric by converting the result into precentage form. The way to convert raw score into precentage is used the following formula:
(Arikunto, 2010) Information:
P = Precentage R = Raw Score MS = Maximum Score
The result of precentage above can be interprete using the following Table 3.11: Table 3.11 Interpretation of Precentage
No Precentage Criteria
1 80 – 100 % Very Good
2 66 – 79 % Good
3 56 – 65 % Moderate
4 40 – 55 % Lack
5 < 40 % Very Lack
(Arikunto, 2013)
J. Research Procedure 1. Preparation Stage
a. Investigating teaching and learning difficulties especially in some topics.
b. Determine a specific topic to be conducted in this research.
c. Analyzing several aspects that strengthen the foundation of this research and explain it in the literature review, such as:
1) The problem raised in teaching and learning process, to find the solution through this research.
2) The curriculum that used at school, to make sure that the topic that used in this research is appropriate with independent variable. 3) Learning model that used that considered as appropriate based on
analysis of relevant research.
4) Steps of Team assisted Individualization (TAI) learning model as independent variable, to be adjusted with learning strategy in this research.
e. Designing research instrument that used in this research such as objective test, questionnaire of learning style and science related attitude, lesson plan and observation sheet.
f. Validate the instrument to the expert or lecturer.
g. Revisions of research instrument after get the suggestion from supervisors.
h. Try the objective test to the students and then testing it by validity, reability, difficulty level, discrimination power and distractor using Anatest version 4.1.
i. Validating the rest of instrument such as observation sheet, lesson plan, questionnaire of learning style and science related attitude by the expert judgement and revise it.
j. Find the possible school for conducting this research.
2. Implementation Stage
The implementations of this research are explained as follows:
a. Analyzing students previous chapter score to know the composition of higher and lower achiever in order to determine the group composition that used by using Team Assisted Individualized.
b. Distribute learing style questionnaire to know the composition of the students learning style.
c. Distribute pre-test question to know the general information of
students’ prior knowledge in conceptual understanding in learning optics.
d. Applying the treatment using TAI.
e. Distributing post-test in form of multiple choice to the class to get the
information about students’ final conceptual understanding.
f. Distributing the questionnaire of science related attitude to know students response in learning optic using TAI.
g. Make a recapitulation from data gained to be analyzed in the next stage.
a. Analyze the data gained in accordance with the instrument used for each variable that measured.
b. Interpreting the data gained.
c. Make a discussion regarding the result of analysis with the expert. d. Draw a conclusion from the research.
e. Completing the research report.
Literature review of TAI, learning style (VARK), conceptual understanding in learning optics
Analysis of
Students’
Learning Style
Designing hypothesis
Determining sample and population of research
Research instrument construction Instrument
analysis, expert validation, revision
Pre-test and test of students’ learning style (VARK)
Applying TAI
Post-test and test of students’ response (TOSRA)
Preparation Stage
Figure 3.2 Research Flowchart Conclusion