MICROFINANCE-ECONOMIC GROWTH NEXUS: A CASE STUDY ON
GRAMEEN BANK IN BANGLADESH
Md. Fouad Bin Amin1 Shah Jalal Uddin2
Abstract
Microfinance is one of the fastest growing sectors in Bangladesh and in many parts of the world. Over the last few decades, this sector has been supportive in achieving various socio-economic goals in Bangladesh. The country has made remarkable progress in sectors like education and health, and most importantly it has contributed significantly in poverty alleviation. Although the microfinance mostly concentrates at the micro level, it has direct effect on the macro economy. A forefront Microfinance provider like Grameen Bank has been playing a key role for the socio-economic wellbeing of the people living in the rural areas as well as for the economic development of rural economy. This study aims to investigate the long run dynamic relationship among its loan financing and clients’ deposit and economic growth in Bangladesh. By considering annual time-series data of these variables, a widely used cointegration test and Granger’s causality test have been applied to examine the long run relationship among these variables. The result shows that both financing and depositing aspects of Grameen Bank have positive effect on economic growth of Bangladesh in the long run. It is recommended that Grameen Bank should allow its operations without any external pressure for the sake of sound economic growth of the country.
Keywords: Microfinance, loan financing, deposit, economic growth, cointegration, granger causality.
1
Assistant Professor, Department of Economics, College of Business Administration, Kind Saud University, Riyadh, Kingdom of Saudi Arabia. (Corresponding Author) E-mail: or [email protected] or [email protected]
I. INTRODUCTION
For a long period, Microfinance Institutions (MFIs) have been playing a remarkable role in Bangladesh. There are only few MFIs that are dominating in the sector, and the Grameen Bank, BRAC, ASA, and Proshika are the most popular. This sector provides financial services to around 260 million clients who received various types of loans equivalent to Tk.63,400 crore from and deposited Tk. 13,541 crore to a total of 697 MFIs.3
Grameen Bank, the most well-known Microfinance institution in the world, established in 1983 as a specialized bank. Unlike other MFIs, it is most the exceptional one where 95% of the total equity are owned by the clients. It also maintains a satisfactory rate of loan recovery (96.67. Although Grameen Bank to some extent relied on foreign donors at the early phase, the Bank had moved from its’ donors dependency to depositors savings since 1998. This transformation is largely contributed to the innovation and expansion of various products and services particularly in the rural areas.
Until 2015, Grameen Bank distributed loan (Cumulative Disbursement of All Loans) equivalent to USD 18284.37 million among a total of 8.81 million members from the 2,568 branches across the country. There is an up-rising trend in both loan disbursement and number of members over the last ten years of its operation, as can be observed from chart 1.
Chart 1.1
Cumulative Disbursement of Loans and Total Number of Members from 2005-2015
3
Chart 1.2
Disbursement of Loans from 2005-2015
Although it provides four major types of loans, namely, the general loan (used for income-earning activities), housing loan, technology loan, and collective loan by covering the major sectors in Bangladesh, there are in total seven categories of loan. Agriculture and processing and manufacturing sectors received the highest portion which are 28% and 21%, respectively followed by the livestock and fisheries (18%), trading (18%) and shop keeping (12%) while very little portions were allocated for services (2%) and peddling (1%) business (chart 2).
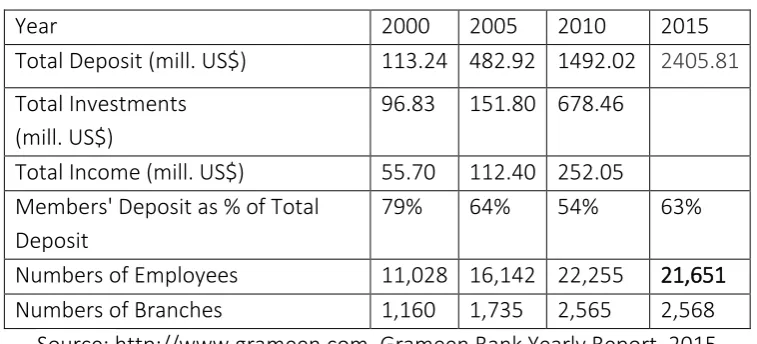
Table 1.1
Economic Indicators of Grameen Bank
Year 2000 2005 2010 2015
Total Deposit (mill. US$) 113.24 482.92 1492.02 2405.81
Total Investments (mill. US$)
96.83 151.80 678.46
Total Income (mill. US$) 55.70 112.40 252.05 Members' Deposit as % of Total
Deposit
79% 64% 54% 63%
Numbers of Employees 11,028 16,142 22,255 21,651
Numbers of Branches 1,160 1,735 2,565 2,568
Source: http://www.grameen.com, Grameen Bank Yearly Report, 2015
To identify the variables influencing the GDP growth is a complex phenomenon. The study has the limitation of explaining the contribution of MFI in GDP growth in Bangladesh. The total financing made by all the MFIs is relatively much less than that of banking institution of the country. The banking sector of the country disbursed a total of USD 43.3 billion while it received USD 55.5 billion as deposits whereas MFIs had distributed total loan equivalent to USD 1.95 billion with the clients deposit worth of USD 0.853 billion in 2011 (Bangladesh Bank, 2013; MRA, 2011). In other estimates, the financial intermediaries that provide financing to facilitate bridge financing, securitization instruments, private placement of equity etc. constituted 1.85 percent of the GDP in 2011 (Bangladesh Bank, 2013).
II. LITERATURE REVIEW
The relationship between financial sector and economic growth has been a long debatable issue among the economists. Levine (2004) defined five functions of a financial system that influence economic growth: savings mobilization, provision of investment information, monitoring/governance, risk management, facilitation in goods and service exchange. On the other hand, Rajan & Zingales (1998) argued that financial market may anticipate economic growth rather than the causes of the growth.
Even though Bangladesh economy relies mostly on various agricultural activities, the recent economic trend indicates the slow shifting of economy from agriculture to industry and service sector over the last five years. In 2008, 45% of labor forces were employed in agriculture while 30% and 25% were in industry and service sector respectively4. Rahman & Yusuf (n.d) found that the major constraints of economic growth in the country are low levels of human capital, poor infrastructure, low levels of trade, corruption, and cumbersome regulation.
Microfinance institution emerged in the market because the poor and assetless clients had no access to the financial institutions. It targeted the poor clients who were excluded from the formal banking system. The institution used to provide basic financial services like small loans, saving accounts, fund transfers and insurance to low-income clients for their various income generating activities. This financial inclusion has significant effect on the economic growth and development through employment and income generation.
The past studies that support the relationship between performance of MFI and economic growth in the long run can be divided into three categories. Firstly, MFI can affect economic growth in both direct and indirect ways (Maksudova, 2010). In the case of direct effect, it helps to decrease the poverty rate, increase the social welfare and add value to the various productive activities. The institutions provide a wide range of services to the society beside the microfinancing. These non-financial services contribute to increasing of self-employment and income level of the poor. MFI can also influence economic growth indirectly via financial sectors, for example, MFIs contribute to increase the liquid liabilities through financial deepening and the development of retail banking system which fosters economic activities.
4
Secondly, there can be both positive and negative relationship between economic growth and performance of MFI of any country (Ahlin, Lin, & Maio, 2010). It is argued that high growth leads to increase in demand for establishing micro-enterprises which later on appear to most profitable business ventures. A few factors are considered for the engine of economic growth, namely physical and human capital, better institutions and most importantly technological advancement that enusre the profitability of micro-entreprenuers in the long run. Khandker (1996) found that higher economic growth is a necessary condition for the economic prospertiy of both Grameen Bank and its clients. However, there may be also negative relationship between MFI and other areas of development such as workforce participation, manufacturing share, and industry share. In some cases, it happens if the institution allows clients to substitute for wage labor opportunities.
Lastly, the performance of MFIs and the growth of a country may not be related Although a few MFIs were affected by the severe global recession in 2008, many of the instituions were survied during the East Asian crisis in 1997 and Latin American crisis in 2000 (Chen, Rasmussen, & Reille, 2010). These institutions mostly remained unaffected from various finaincal crisies as they had no or very limitedconnections with financial institutions (McGuire & Conroy, 1998). Another study that adopts the financial performance of MFIs’s shows that macro -economic development has little impact on their perfomrances (Gonzalez, 2007). Moreover, by using panel data and OLS regressions controlling for year and country fixed effects, the author finds no significant correlation between domestic GDP growth and microfinance performance (Woolley, 2008).
In the light of what has been discussed above the MFIs have substantial impact on the economic growth and development and there is a lack of study in examining this relationship from Bangladesh perspective.
III. DATA AND METHODOLOGY
3.1. Data Set
The main purpose of this study is to examine the long-run relationship between the Microfinancing by Grameen Bank and economic growth of Bangladesh. The following model is formulated by adopting OLS technique:
lngdpt= 0 + 1lndep+ 2 lnfin + (1)
Where:
lngdp : Natural Logarithm of Real GDP
lndep : Natural Logarithm of Total Grameen Banks’ Clients Total Deposit lnfin : natural logarithm of Total Grameen Banks’ Financing
0 : Constant : Co-efficients : Error Term
3.2 Unit Root Test
It is the requirement for time series analysis to test the order of integration among the variables. Hence, the presence of unit root is detected with the help of two mostly used tests such as, Augmented Dickey-Fuller (ADF) and Phillips-Perron (PP). The lag length is considered while running the ADF test to get rid of autocorrelation and to increase the robustness of the model. In relation to estimate ADF, the most well-known equation provided by (1995) has been adopted for estimating ADF test. The nature of regression equation for the ADF test is given below:
ΔYt = β1 + β2t +δYt − 1+αi∑ΔYt − 1 +et (2)
Where,
εt=error term and
ΔYt − 1 = (Yt − 1 − ΔYt − 2)
Hypothesis to be tested:
H0: δ= 0 (have a unit root and data are not stationary) H1: δ< 0 (do not have unit root and data are stationary)
Along with ADF test, PP test has also been conducted to control the higher-order serial correlation. The advantage of applying PP test is that it adopts non parametric statistical methods by excluding additional lagged difference terms. The PP test takes following form (Jeong, Fanara and Mahone, 2002):
Hypothesis to be tested:
H0: δ= 0 (have a unit root and data are not stationary) H1: δ< 0 (do not have unit root and data are stationary)
3.3 Cointegration Test
The conintegration test has been performed to identify whether the variables of the study follow stationary process for linear combination or not. In other words, this test will facilitate to get the linear combination of variables which are stationary although individually those are non- stationary (Gujarati, 1995). To achieve this, the Johansen (1991) method of multivariate cointegration has been applied in determining the presence of long-term association among the dependent and independent variables.
The basic idea behind cointegration is that if all the components of a vector time series process yt have a unit root, or in other words, yt is a multivariate I(1)
process, it is said to be cointegrated when a linear combination of them is stationary, that is if the regression produces an I(0) error term.
Normally, two types of hypothesis need to be tested to determine the number of cointegrating vectors, as proposed by Johansen and Juselius (1990), which are: (1) Trace test is important where the null hypothesis include that there are “r” or less number of cointegrating vectors in the model/equation. Here, it can be shown as:
-T å ln(1 - lˆ ). A series of null hypotheses will be tested *(r=0, r≤1, r≤2,..., r≤(q-1)] in order to detect the number of cointegrating vectors “r”. (2) Under the Maximal eigen value test, the null hypothesis includes that there are “r” number of conintegrating vectors against the alternative hypothesis where the number will
be r+1. Here, the test statistic will follow -T ln (1- lˆ). In the same way, A series of null hypotheses will be tested (r=0, r=1,..., r=p-1) to identify the cointegrating vectors. For instance, we can determine that there are r=q number of conintegrating vectors once r=q, null hypothesis is accepted. Thus, this particular type of conintegrating regression will enable to forecast the long run relationship among the variables.
The authors also show the maximum likelihood technique by adopting the Vector Autoregressive (VAR) model for estimating the cointegration association among the components in vector “k” and variable “yt”. The VAR model for yt : can be
present as follows:
The Vector Autoregressive Error Correction Mechanism (VECM) has following framework:
p -1
DYt = å P i DYt -i + ab Yt - p + e t (5)
i =1
In the above equation, the vector β = (-1, β2, …, βn) includes r cointegration vectors where the adjustment parameter α = (α1, α2, …, αn) assuming that the rank β=r<k, ( k represents number of endogenous variables). Once the actual number of cointegrated relations has been identified, we can proceed to conducting hypothesis testing b a s e d on α and β. In our research, we adopt AIC and SC criteria to get VAR equation.
IV. RESULT AND DISCUSSION
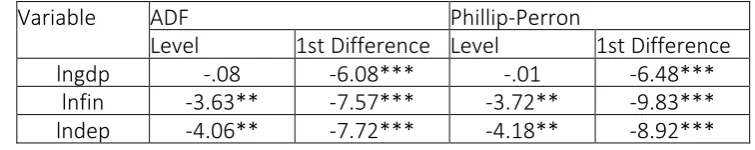
4.1 Stationary Test
The following table presents the result of Augmented Dickey-Fuller (ADF) and Phillips Perron (PP) tests to detect the order of integration in the variable. It is found that lngdp, lnfin and lndep have unit root at the level in both ADF and PP tests. As usual, all the variable are found stationary at the level I(1).
Table 4.1 Stationary Test
Variable ADF Phillip-Perron
Level 1st Difference Level 1st Difference
lngdp -.08 -6.08*** -.01 -6.48***
lnfin -3.63** -7.57*** -3.72** -9.83***
lndep -4.06** -7.72*** -4.18** -8.92***
Note:
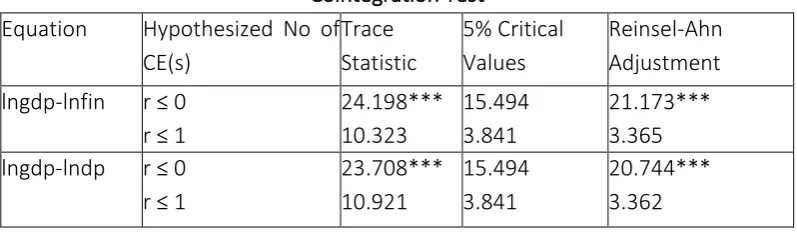
4.2 Cointegration and Long Run Equation
After confirming the stationary at the first level, Johansen and Juselius cointegration test is conducted to identify whether the variables have long relationship or not. By using AIC and SC criteria, the optimal lag length is taken 2 for testing the long run relationships
Trace statistics is used for small number of sample to confirm the relationship
Note: * Significant at 10% alpha; ** Significant at 5% alpha; *** Significant at 1% alpha.
Table 3 displays two relationships among the three variables. As the value for Reinsel-Ahn Adjustment is 21.173 (greater than 5% critical value of 15.494), it indicates that economic growth and GB’s financing is conintegrated in the long run. equilibrium. In the same way, economic growth and GB’s clients deposit is cointegrated in the long run equilibrium by confirming the association between the variables.
ect = lngdp -0.407381lndep – 17.00302 (6) (-8.16638)
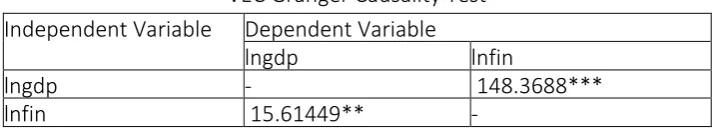
To find out the direction of association among lngdp, lnfin and lndep, the present study focuses on Granger causality and long run models as shown in equation 6 and 7. |These two equations present the long run relationship between lngdp and lndep as well as lngdp and lnfin. In equation (6), it shows that deposit has positive relationship with economic growth where the equation (7) is in favor of the positive association with financing and economic growth. However, only bi-directional relationship between financing and economic growth from the Granger causality test is observed as shown in the following table.
Table 4.3
VEC Granger Causality Test Independent Variable Dependent Variable
lngdp lnfin
lngdp - 148.3688***
lnfin 15.61449** -
Note: ** Significant at 5% alpha; *** Significant at 1% alpha.
The above result suggests that GB’s both financing (lending) and depositing (client’s saving) have positive effect on the economic growth of Bangladesh. GB’s financing stimulates economic growth as it increases the economic activities of the rural people who engaged in real sector (agriculture and trade). On the other hand, GB’s clients deposit also contributes to the growth due to the credit expansion (through savings mobilization) to the existing and new clients.
V. CONCLUDING REMARKS
The paper examines the contribution of Grameen Bank on economic growth of Bangladesh. Over the last few decades, it involves in Microfinance activities (lending to and depositing from the clients) in the rural areas. The clients are mainly poor and assetless. The loan is given mainly for productive purposes with close supervision and regulation.
deposit of Grameen Bank have long run positive relationship with economic growth. Besides, a bi-directional relationship between economic growth and GB’s financing has been observed.
REFERENCE
Ahlin, C., Lin, J., & Maio, M. (2010). Where does microfinance flourish? Microfinance institution performance in macroeconomic context. Journal of Development economics.
Chen, G., Rasmussen, S., & Reille, X. (2010). Growth and Vulnerabilities in Microfinance. Washington, D.C.: CGAP.
Gonzalez, A. (2007). Resilence of Microfinance Institutions to Macroeconomic Events. Washington, D.C. : MIX Discussion Paper, The MIX.
Johansen, S. & Juselius, K., (1990). “Maximum Likelihood Estimation and Inference on Cointegration with Applications to Demand for Money”, Oxford Bulletin of Economics and Statistics.
Khandker, S. R. (1996). Grameen Bnak: Impact, Costs, and Program Sustainability. Asian Development Review, 65-85.
Levine, R. (2004). Fianance and growth: Theory and evidence. Massachusetts Ave., Cambridge, USA: NBER Working Paper.
Maksudova, N. (2010). Macroeconomics of Microfinance: How Do the Channels Work? Prague: CERGE-EI.
McGuire, P., & Conroy, P. (1998). Effects on Microfinance of the 1997-1998 Asian Financial Crisis. Brisbane, Australia: Foundation for Development Cooperation.
Pitt, M. M., & Khandker, S. R. (1998). The impact of group-based credit programs on poor households in Bangladesh: does the gender of participants matter? Journal of Political Economy, 958-996.
Rahman, J., & Yusuf, A. (n.d.). Economic growth in Bangladesh: experience and policy priorities.
Rajan, R., & Zingales, L. (1998). Financial dependence and growth. American Economic Review, 559-586.
Reinsel, G., & Ahn, S. (1992). Vector Autoregressive Models with Unit Roots and Reduced Rank Structure: Estimation, Likelihood Ratio Test and Forecasting. Journal of Time Series Analysis, 353-375.
Schuler, S., Hashemi, S., & Riley, A. (1997). The influence of women's changing roles and status in Bangladesh's fertility transition:evidence from a study of credit programs and contraceptive use. World Development, 563-576. Woolley, J. (2008). Microfinance performance and Domestic GDP Growth: Testing
the Resiliency of Microfinance Institutions to Economic Change. Standford Journal of Microfinance.
Yunus, M., & Weber, K. (2007). Creating a World Without Poverty: Social Business and the Future of Capitalism. New York: PublicAffairs.