Demographia
World Urban Areas
TABLE OF CONTENTS
Demographia World Urban Areas (Introduction)
1
URBAN AREA LISTINGS
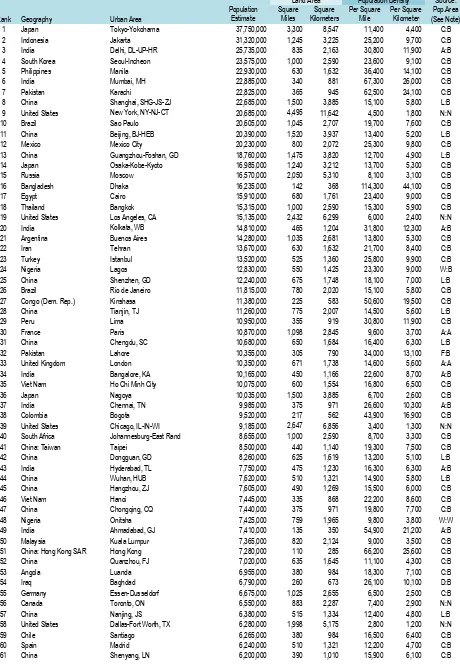
Table 1: Largest Urban Areas in the World
19
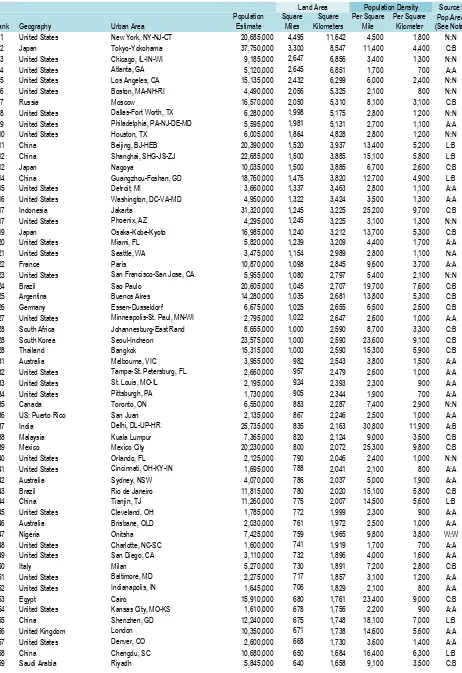
Table 2: Urban Areas by Land Area (Urban Footprint)
34
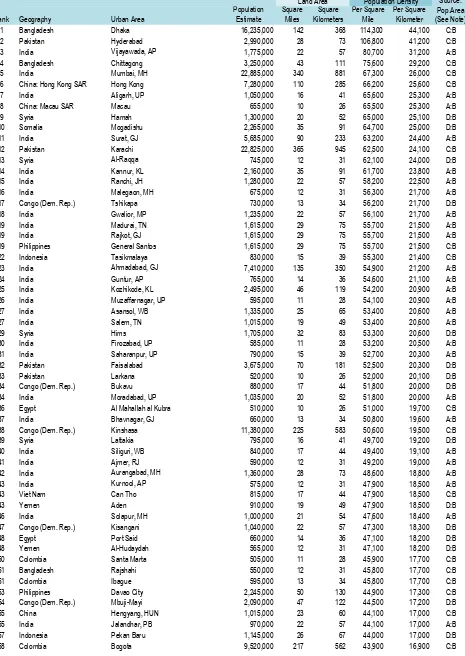
Table 3: Urban Areas by Urban Population Density
50
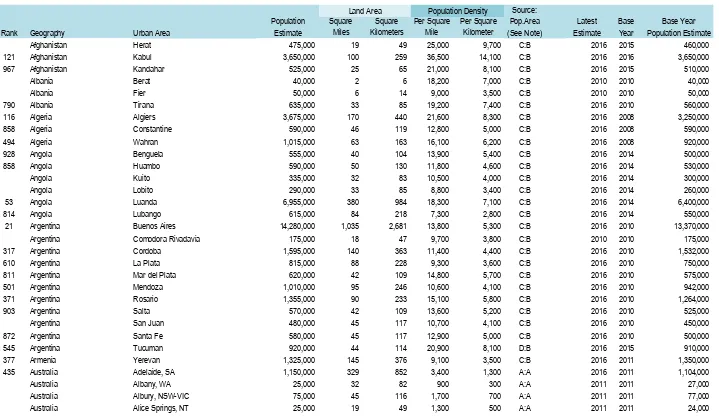
Table 4: Urban Areas by Geography (Including Selected under 500,000 Population)
66
SUMMARY TABLE
Table 5: Summary: Urban Areas Over 500,000
110
COVER PHOTOGRAPH
demographia.com/db-worldua-index.htm
Manila: Ortigas Business District (by Author)
DEMOGRAPHIA WORLD URBAN AREAS
12
thANNUAL EDITION
April 2016
RELATED PUBLICATIONS
Toward More Prosperous Cities: Framing Essay on Urban Policy
12th Annual Demographia International Housing Affordability Survey
The Evolving Urban Form (Profiles of World Urban Areas)
A Question of Values: Middle-Income Housing Affordability and Urban Containment Policy
City Sector Model
(Urban Core & Suburban Small Area Analysis within US Metropolitan Areas
Demographia World Urban Areas
(Built-Up Urban Areas or Urban Agglomerations)
12th Annual Edition: April 2016
CONTENTS OF THIS SECTION
1.
Demographia World Urban Areas
2.
Revisions in the 12
thEdition
3.
Distribution of Large Urban Area Population
4.
Built-Up Urban Areas: Definitional Issues
5.
Smaller Urban Areas (Under 500,000 Population)
6.
Geographical Notes
7.
Methodology
8.
Caution: Trend Analysis
9.
Cover Illustration: Ortigas, Manila
10.
Comments and Suggestions
1. DEMOGRAPHIA WORLD URBAN AREAS
Demographia World Urban Areas (Built-up Urban Areas or
Urban Agglomerations) is the only annually published inventory
of population, corresponding land area and population density
for urban areas with more than 500,000 population. Unlike
metropolitan area lists, Demographia World Urban Areas
applies a generally consistent definition to built-up urban
areas.
1This report contains population, land area and population density for all 1,022 identified built-up urban
areas (urban agglomerations or urbanized areas) in the world with 500,000 or more population. The total
population of these urban areas is estimated at 2.12 billion, 53 percent of the world urban population in
2016.
2A number of smaller urban areas are also listed. Overall, data is provided for 1,744 urban areas of all sizes,
which comprise a population of 2.27 billion people, 56 percent of the world urban population.
1
Other regularly published urban agglomeration lists do not contain consistently defined entities. They tend to mix
metropolitan areas, municipalities (parts of metropolitan areas) and urban areas (built up urban areas or
agglomerations). None of these lists include urban land area data. The United Nations list is unique in providing
notes that clarify the nature of its each of its listings (core cities, metropolitan areas, urban areas and others).
2. REVISIONS IN THE 12
thEDITION
Revised Data: Highlights
New census data and estimates as well as later satellite imagery has led to some substantial revisions in
the 2016 edition of Demographia World Urban Areas. The most notable are indicated below:
The Mumbai built-up urban area has been expanded to incorporate the Bhiwandi, Kalyan and
Vasai-Virar urban areas. This is generally consistent with the definition of the Census of India, with
the exception that Demographia includes Bhiwandi.
A new estimate for Kinshasa has been developed, from 2014 data provided by the Institut National
de la Statistique of the Democratic Republic of the Congo (DRC). The data was not sufficient,
however, to develop revised estimates for other built-up urban areas in the DRC.
A new population census ends more than 30 years since the last in Myanmar. Built-up urban area
estimates have been updated using this information.
The lower range population estimates for the Lagos built up urban area have been largely
confirmed by the Africapolis project (see Geographical Notes, below). There has been
considerable controversy about the population of Lagos for years and local governments had
claimed the census of Nigeria had severely under-counted its population. The new information is
generally consistent with the Nigerian federal government population data.
Demographia World Urban Areas has begun to use the Africapolis population and urban land area
data where available, considering them to be the closest approximation to national census data on
built-up urban areas. Africapolis data covers West African nations and most importantly, appears to
provide reliable data on the built-up urban areas of Nigeria, where official data has often been
challenged. The availability of the Africapolis data makes it unnecessary for Demographia World
Urban Areas to develop independent built-up urban area data in West Africa outside Nigeria, where
no difficulty in census data is indicated.
A new urban area of more than 5,000,000 residents has been identified by Africapolis, Onitsha,
Nigeria.
New population estimates are available for some larger municipalities (prefectures) in China.
Almost without exception, population growth has been well below projected levels, which are
largely based on United Nations forecasts. Population estimates for built-up urban areas with base
years before 2013 are likely to be high, as a result.
Later local government population estimates (2015) in China indicate a further slowing of
turnaround from the 650,000 annual population increase registered between the 2000 and 2010
censuses.
3Revised Format
Tables have been simplified and reorganized. The population base, base year and estimates for built-up
urban areas with less than 500,000 population are shown in Table 4 only. Table 4 contains all urban areas
covered, in alphabetical order by Geography and built-up urban area name.
3. DISTRIBUTION OF WORLD POPULATION BY URBAN AREA SIZE AND CONTINENT
In recent years, the world
has become more than
one-half urban for the first
time in history (54.5
percent in 2016). Yet, it
would be a mistake to
believe that the world's
urban residents live in
settings similar to 5th
Avenue in New York or
within the fourth ring road
of Beijing or in inner Paris,
or for that matter in large
urban areas. Even in
urban settings that are not
particularly dense, such
as suburban areas.
Further, more than 70
percent of the world’s
population lives in urban
areas with less than 500,000 residents
4or in rural areas (See: What is a Half-Urban World?
5).
Approximately one quarter (23.9 percent) of the world population lives in urban areas of 1,000,000
population or more. Less than 30 percent (28.6 percent) lives in urban areas with 500,000 or more
population.
6More than 70 percent of the world's population lives outside urban areas with 500,000 or more
residents (Figure 1).
73
Wendell Cox (2010), “The Evolving Urban Form: Shanghai
,” The New Geography,
http://www.newgeography.com/content/002283-the-evolving-urban-form-shanghai
4
The of urban areas under 100,000 is estimated by applying ratios from
, Making Room for a Planet of Cities
(Shlomo Angel, with Jason Parent, Daniel L. Civco, and Alejandro M. Blei) to the Demographia data.
5
Wendell Cox (2012), "What is a Half-Urban World,"
The New Geography
,
http://www.newgeography.com/content/003249-what-a-half-urban-world.
6
Caution is suggest in comparing categories with data from last year’s edition is not valid. Because urban areas shift
(generally upward) in population categories, the urban area components of each population category have changed.
7
The of urban areas under 100,000 is estimated by applying ratios from
, Making Room for a Planet of Cities
A slight majority of the
large urban area
population lives in
built-up urban areas
with between 4,000
and 10,000 persons
per square kilomter
(approximately 10,000
to 25,000 persons per
square mile).
Approximately
one-quarter live at higher
densities and one
quarter live at lower
densities (Figure 2)
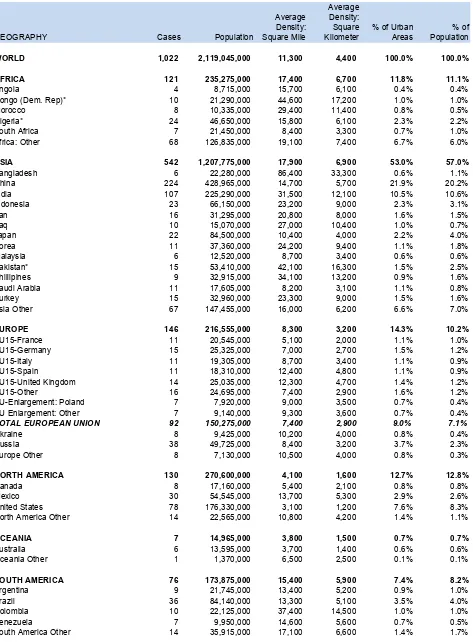
More than one-half of
the population (53
percent) of large
built-up urban areas
(500,000 and over) are in Asia, living in 542 of the 1,022 large urban areas (Figure 3). The Asian areas
comprise 57 percent of the world’s large urban area population.
There are 36 megacities in the world (urban areas over 10 million population). A total of 79 urban areas are
indicated with 5,000,000 or more population.
4. BUILT-UP URBAN AREAS: DEFINITIONAL ISSUES
An urban area ("built-up urban area,"
8urbanized area or urban agglomeration)
9is a continuously built up
land mass of urban development that is within a labor market (metropolitan area or metropolitan region. An
urban area contains no rural land (all land in the world is either urban or rural). In some nations, the term
"urban area" is used, but does not denote an urban area as a built-up urban area.
10An urban area is best thought of as the “urban footprint” --- the lighted area that can be observed from an
airplane (or satellite) on a clear night. National census authorities in Australia, Canada, Denmark, Finland,
France, the Netherlands, Norway, Sweden, the United Kingdom and the United States designate urban
8
"Built up urban area" is the new urban area term now used by National Statistics in the United Kingdom. It may be
the most descriptive short term for urban areas.
9
Called a "population centre" in Canada and an "urban centre" in Australia. The term "urban area" is used (or
translated into English) in China and New Zealand. However, in these countries "urban areas" extend well beyond
the built-up urban area and are thus more similar to metropolitan areas.
10
In China, sub-city or sub-regional districts called “shixiaqu” (
市辖区
) are sometimes referred to as urban areas.
areas. Except in Australia, the authorities use a minimum urban density definition of 400 persons per
square kilometer (or the nearly identical 1,000 per square mile in the United States).
By necessity, average data masks significant variations within urban areas. Within urban areas, urban
population densities can
range from below 400
per square kilometer
(1,000 per square mile),
particularly in North
American urban areas,
to over 1,000,000 per
square kilometer
(2,500,000 per square
mile) in informally
developed
neighborhoods
11of
some Asian cities (such
as in Dhaka).
12There are also
significant differences in
density variation within
built-up urban areas.
Average urban density
does not provide any information on such variations, nor can it be assumed that an urban area with a
higher average density will have higher neighborhood densities. For example, the population density of the
Phoenix urban area is more than half-again higher than that of the Boston urban area. Yet, the highest
population densities of Boston are at least five times that of the highest density areas in Phoenix. Moreover,
Boston has a far larger commercial core (“central business district” or “downtown”). The difference is that
the Phoenix suburbs are denser than the Boston suburbs. Higher density suburbs are also responsible for
making Los Angeles the most densely populated large urban area in the United States, despite its much
lower urban core densities relative to New York. This creates an irony that the city most associated with
urban dispersion (“urban sprawl”) in the United States is, in reality, the least dispersed (least “sprawling”).
Similarly, London and Athens have similar population densities. Yet, the core densities in Athens are
considerably higher than in London. The Athens suburbs, however, are among the least dense in the world.
The Essen-Dusseldorf and Milan urban areas have almost identical densities, yet core densities are
considerably higher in Milan. Demographia World Urban Areas defines the population and density of urban
footprints, regardless of their internal density profiles.
11
Called slums, shantytowns or favelas.
12
See: Wendell Cox, (2012), “The Evolving Urban Form: Dhaka,”
The New Geography
,
Urban Areas Contrasted with Metropolitan Areas
An urban area
(built-up urban area or
urban agglomeration)
is fundamentally
different from a
metropolitan area. A
metropolitan area is a
labor market. It
includes a principal
built-up urban area
(the largest urban
area in the
metropolitan area). It
also includes rural
areas and may
include additional,
smaller built-up urban
areas. Both rural
areas and built-up
urban areas outside
the principal built-up
urban area are considered “exurban” (Figure 4).
13Urban areas draw employees from a labor market area larger than the area of continuous development.
For example, INSEE, the census authority of France defines the Paris urban area ("unité urbaine") as 2,845
square kilometers and the Paris metropolitan area (aire urbaine) as 17,100 square kilometers, indicating
that more than 80 percent of the land area is outside the Paris urban area. Similarly, in the United States,
the 52 metropolitan areas with more than 1,000,000 population had only 19 percent of land in urban use,
with the remainder of 81 percent being rural.
14Because of the fundamental differences between urban areas (or urban agglomerations) and metropolitan
areas, population comparisons should be made only within the two categories, not between.
Metropolitan Area Densities
Metropolitan area densities can be calculated, but are of limited value and can produce misleading results.
This is because there are no international standards for delineating metropolitan areas, rendering them
non-comparable (at best) between nations. Among the least useful metropolitan areas for density
comparisons are those of the United States, where counties are used as the building blocks. The size of
counties in the United States varies up to 1,500 times and, as a result, metropolitan densities are principally
13
All land is that is not urban is considered rural.
14
Wendell Cox (2010), "Rural character in America's Metropolitan Areas
, The New Geography, "
reflective of the rural densities.. The most expansive metropolitan area in the United States is
Riverside-San Bernardino, at 27,300 square miles (71,000 square kilometers), not much smaller than Austria. Most of
this area is well beyond commuting range, which means that it is not a genuine labor market. The situation
is similar, but not as extreme in some other metropolitan areas of the United States. Metropolitan area
densities in the United States therefore cannot even be validly compared even among themselves.
Further, metropolitan densities should not be confused with urban densities. Urban densities can be
calculated only using urban populations and excluding populations of rural areas. All metropolitan areas
have rural areas and thus no metropolitan density measure can be a genuine urban density measure.
Urban Areas and Urban Extents Contrasted
In some cases, urban areas have virtually grown together, yet are still considered separate urban areas.
This report confines urban areas to a single metropolitan area (below) or labor market area. Continuous
urbanization that extends beyond individual labor markets (metropolitan areas) can be called "urban
extents."
What constitutes a particular metropolitan area is a matter of judgment and there are no generally accepted
international principles for delineating metropolitan areas (unlike urban areas). However, it is necessary to
“draw a line,” especially where adjacent urban areas have “grown together,” but remain essentially distinct
labor markets. For example, the following urban extents are composed of more than one urban area:
The coast of Japan from Tokyo-Yokohama to Osaka-Kobe-Kyoto has nearly “grown together.”
Yet, this ribbon of urbanization is far too large to be a single metropolitan area (labor market)
and thus considered to be multiple urban areas (an urban extent).
The Pearl River Delta urban areas of Shenzhen, Dongguan, Zhongshan, Jiangmen, Huizhou,
Zhuhai, Guangzhou and Foshan in China’s Guangdong province are very close to one-another
and in some cases the built-up urban areas are virtually adjacent. Yet, this is not considered a
single urban area there is not a single, unified labor market. Demographia World Urban Areas
considers Guangzhou and Foshan as a single urban area, because they have become more
economically integrated than the other urban areas. Each of the other areas in the Pearl River
Delta economic region is classified as a separate urban area. The urban extent also includes
Hong Kong. However, there is a second reason that Hong Kong is not a part of a Pearl River
Delta urban area --- there is border control between Hong Kong and Shenzhen that does not
permit the free exchange of labor.
The Yangtze River Delta contains at least 11 nearby (though not always adjacent) urban areas
stretching from Ningbo Shanghai, and Nanjing. This includes Ningbo, Shaoxing, Hangzhou,
Jiaxing, Shanghai, Kunshan, Suzhou, Wuxi, Changzhou, Zhenjiang and Nanjing. Some
sources consider this a single metropolitan area or even a single built-up urban area. It is
neither. Moreover, there is considerable rural territory between some, breaking up the
The same applies to the Northeastern "megalopolis" of the United States. The continuous
urban development that exists is has rural separations in some cases and each of the major
metropolitan areas represents a separate labor market. Thus virtually continuous urban areas
of the Northeast corridor are considered separate, including Hartford, New York, Philadelphia,
Baltimore and Washington.
International Urban Areas
Urban areas (and metropolitan areas) are confined to a single nation, unless there is virtual freedom of
movement (principally labor) between the adjacent nations. This is indicated by the lack of customs or
immigration facilities at borders, or the broad access to work permits for working in adjacent countries.
Currently, this condition is met only between some continental nations of the European Union. For
example, the Lille urban area is in both France and Belgium yet is considered a single urban area because
there is freedom of labor movement without trade, immigration or customs barriers. Treaty provisions
render Geneva (Switzerland)-Annemasse (France), Basel (Switzerland) along with suburban areas of
France and Germany as a single built-up urban area. Similarly, Milan together with Chiasso in Switzerland
is a single built-up urban area.
However, Detroit-Windsor El Paso-Ciudad Juarez and San Diego-Tijuana are not considered single urban
areas because of their border controls restricting the free movement of labor. As noted above, the
Shenzhen and Hong Kong urban areas, despite their adjacency, are also considered to separate because
of their international-style border controls.
Municipality (City or Commune)
An urban area is different from a municipality (also often called a city or a local government authority).
Municipalities have political boundaries that usually constitute only a part of the urban area. For example,
the city of Seoul represents less than one-half of the population (and a declining proportion) of the
Seoul-Incheon urban area, which extends well beyond the municipality. On the other hand, a municipality may be
considerably larger than an urban area and therefore contain considerable non-urban (or rural) territory.
Zaragoza, Spain is an example. A large part of the municipality of Mumbai is rural, composed of the Rajiv
Ghandi National Park and thus not included in the urban area.
The translated term "city" is generally used to denote sub-provincial (or in some cases provincial)
Combined Urban Areas
In the United States, metropolitan areas may be combined into combined statistical areas, which are, in
effect, larger metropolitan areas or metropolitan regions, with somewhat less stringent economic
interchanges (employment commuting).
15Where the urban footprint (composing a single labor market)
materially extends beyond the metropolitan area to form a combined statistical area (CSA) Demographia
creates a combined built-up urban area. For example, the New York urban area stretches from the New
York metropolitan area, well into other parts of the New York combined statistical area (into the Bridgeport,
New Haven and Trenton metropolitan areas). These continuous urban areas are considered a combined
urban area.
In Canada, where the national census authority (Statistics Canada) also defines metropolitan areas, the
Toronto, Hamilton and Oshawa metropolitan areas are also considered a single labor market and are
combined into a single combined urban area. While Canada does not designate combinations of
metropolitan areas, Statistics Canada has indicated that if criteria similar to that of the United States were
applied the Toronto, Hamilton and Oshawa metropolitan areas could be combined.
16Other metropolitan areas are combined in nations that do not report built-up urban area data. For example,
Guangzhou and Foshan, and Tehran and Karaj are combined because of strong transport links that make
commuting feasible.
COMBINED URBAN AREAS
Designated only in Nations Reporting Urban Agglomeration Data
NATION
COMBINED URBAN AREA & Constituent Urban Areas (Source Code “N”)
Canada TORONTO: Hamilton, Oshawa, TorontoUnited States BOSTON: Boston, Nashua (NH)
United States CHICAGO, Chicago, Kenosha (WI), Round Lake Beach United States DALLAS-FORT WORTH: Dallas-Fort Worth, Denton, McKinney United States HOUSTON: Houston, Conroe
United States LOS ANGELES: Los Angeles, Riverside-San Bernardino, Mission Viejo
United States NEW YORK: Bridgeport (CT), New Haven (CT), New York, Trenton (NJ), Danbury (CT), Twin Rivers (NJ) United States ORLANDO: Kissimmee, Orlando
United States PHOENIX: Phoenix, Avondale, Buckeye
United States SAN FRANCISCO: Concord, Livermore, San Francisco, San Jose, Vallejo United States SEATTLE: Seattle, Bremerton, Indianola
A combined urban area consists of adjacent urban areas that are located within the same labor market area
5. SMALLER URBAN AREAS (LESS THAN 500,000 POPULATION)
Information is provided for some smaller urban areas. These urban areas are not representative of all
urban areas under 500,000. Smaller urban areas are shown (1) to indicate urban areas often shown by
international sources to be larger, (2) where national census authority data is produced for urban areas.
15
Metropolitan areas require a 25 percent employment interchange between constituent counties (US metropolitan
areas are no longer based on central municipalities, but now use "central counties"). Combined statistical areas
require a 15 percent employment interchange between adjacent metropolitan areas.
16
Statistics Canada (2008), “Defining and Measuring Metropolitan Areas: A Comparison between Canada and the
The first instance is relevant to China. The Chinese term "shi" is popularly translated as "city" in English.
Yet, "shi" does not denote urban. Chinese "shi" and equivalent terms are simply divisions of divisions of
provinces or province equivalent. China is divided into more than 3,000 "shi," most of which are primarily
rural (in land area), just as the United States is divided into more than 3,000 counties and France into more
than 30,000 communes, with most of their respective land areas typically being rural.
None of these divisions is inherently urban. Analysts often refer to Chinese "cities" of more than 1,000,000
population that have little urbanization. For example, Laibin is a "shi" in Guanxi, with more than 2 million
residents. The local authorities have designated an urban area of more than 900,000 population. Yet the
urbanization of Laibin is estimated at less than 100,000 residents.
This year's edition shows smaller urban areas in Table 4. Tables 1, 2 and 3 contain information only on the
larger urban areas (500,000 and over population).
6. GEOGRAPHICAL NOTES
Larger Geographical Areas
West Africa:
Demographia World Urban Areas uses base population data (2010) from Africapolis, where
available (West Africa).
17Africapolis uses various techniques, including an analysis of satellite photographs
to develop population estimates for built-up urban areas in West Africa. Moreover, the urban are definition
used by Africapolis is consistent with the general approach by Western European governments that define
built-up urban areas. The Africapolis data is particularly useful in West Africa, where most national
statistical authorities (like those of most nations) do not report urban agglomeration data.
Nigeria:
Unlike other nations of West Africa,
there have been strong criticisms of the Nigerian census for
decades, which makes the Africapolis built-up urban area data particularly important in Nigeria. For
example, the most recent federal census (2006) been severely criticized by local officials in Legos state as
having missed many people. The census indicated that Lagos metropolitan area population was
approximately 9 million. By comparison, a local census conducted at about the same time indicated a
population of 17.5 million. Authoritative neutral analysis generally finds lower population levels, more
consistent with data from the federal census.
18The detailed analysis by Africapolis is believed to be the
most accurate population estimates for the urban areas of Nigeria.
Democratic Republic of the Congo:
The government recently published provincial population estimates,
which made it possible to produce a far more reliable estimate for the Kinshasa urban area, which
constitutes nearly all of the population of Kinshasa province. Population estimates for other urban areas are
not considered reliable. The last census was more than 30 years ago (1981) and reasonably current urban
population estimates have not been identified.
17
Agencie Francaise de Develloppment,
Africapolis Urbanization Trends: 1950-2020: A Geo-statistical Approach West Africa,´,
http://www.afd.fr/webdav/site/afd/shared/PUBLICATIONS/THEMATIQUES/autres-publications/BT/Africapolis_Final-Report_EN.pdf
.
18
Adewale Maja-Pearce and Eleanor Whitehead (2014 , “Factsheet: Nigeria’s Population Figures,”
Africa Check: Sorting Fact
Pakistan:
Population estimates are not considered reliable.
Census data were reported for Karachi for
2011 in the Indian press, but there is no indication of such results from the Pakistani census authorities. No
other data was reported. The last complete census was in 1998 and recent estimates have not been
identified.
Specific Built-Up Urban Areas
The notes below notes identify some additional components that (1) might be thought to be separate, (2)
are classified as separate by statistical agencies or are (3) listed to indicate to better describe the
geography of an urban area. No attempt is made to otherwise provide an inventory of municipalities or
other entities in urban areas, because of their large numbers For example, the Paris urban area has more
than 400 local government authorities. Thus, the lack of a municipality name does not indicate that it is not
included in an urban area.
Built-up Urban Area (Urban Agglomeration) Notes
Aachen, Germany
Extends into the Netherlands; Includes Heerlen, Netherlands.
Amersfoort, Netherlands
Included in Utrecht.
Amman, Jordan
Includes Az-Zarqa.
Amsterdam, Netherlands
Includes Haarlem
Ansan, Korea
Included in Seoul-Incheon.
Avondale, AZ, USA
Included in Phoenix.
Bahadurgarh, Haryana, India
Included in Delhi.
Basel, Switzerland
Extends into France and Germany
Bataysk, Russia
Included in Rostov.
Bhiwandi, Maharashtra, India
Included in Mumbai (beginning in 2016).
Bogor, Indonesia
Included in Jakarta
Boston, MA, USA
Includes Worcester and Nashua.
Bridgeport, CT, USA
Included in New York.
Biuckeye, AZ, USA
Included in Phoenix.
Chanan (Shantou), GD, China
Included in Chaoyang
Chaoyang (Shantou), GD, China
Includes Chaonan
Chiasso, Switzerland
Included in Milan, Italy (single labor market)
Chicago, IL, USA
Includes Kenosha and Round Lake Beach
Choloma, Honduras
Included in San Pedro Sula
Chungli, China: Taiwan
Included in Taipei.
Concord, CA, USA
Included in San Francisco
Conroe, TX, USA
Included in Houston.
Dallas-Fort Worth, TX, USA
Includes Denton and McKinney
Danbury, CT, USA
Included in New York.
Darwin, NT, Australia
Includes Palmerston.
Delhi, NCT, HA, UP, India
Includes Faridabad, Ghaziabad, Noida, Gurgaon and
Bahadurgarh urban areas and New Delhi.
Denton, TX, USA
Included in Dallas-Fort Worth
Dhaka, Bangladesh
Nayaranganj included.
Dongguan, Guangdong, China
2010 census population was well below previous local estimates
Dongyang, ZJ, China
Included in Yiwu (Jinhua)
Dubai, UAE
Includes Sharja
Ezhou, Hubei, China
Includes Huangzhou (Huanggang).
Faridabad, Haryana, India
Included in Delhi.
Foshan, Guangdong, China
Included in Guangzhou-Foshan
Francisco Morato, Sao Paulo, Brazil
Included in Sao Paulo
Fukuoka, Fukuoka, Japan
Shown as a separate urban area. Some sources combine
Fukuoka with Kitakyushu (such as the United Nations).
Geneva, Switzerland
Extends into France
Ghaziabad, Uttar Pradesh, India
Included in Delhi.
Guangzhou-Foshan, Guangdong, China
Includes Foshan
Gurgaon, Haryana, India
Included in Delhi.
Haarlem, Netherlands
Included in Amsterdam.
Hague, Netherlands
Included in Rotterdam-Hague
Hamilton, ON, Canada
Included in Toronto.
Heerlen, Netherlands
Included in Aachen, Germany.
Himeji, Hyogo, Japan
Included in Osaka-Kobe-Kyoto.
Hitachi, Japan
Included in Mito.
Houston, TX, USA
Includes Conroe.
Huangmei (Huanggang), HUB
Included in Jiujiang, JX.
Huangshui, HUB
Includes Daye (county level city)
Huangzhou (Huanggang), Hubei, China
Included in Ezhou.
Hubli, West Bengal, India
Does not include Dharwad.
Huiyang qu (Huizhou), Guangdong, China
Included in Shenzhen.
Huizhou, Guangdong, China
Huicheng qu only
Incheon, South Korea
Included in Seoul-Incheon,
Jakarta, Indonesia
Higher estimate than other sources (such as the United
Nations), which are largely limited to DKI Jakarta. Continuous
urbanization extends into Tangerang, South Tanerang, Borgor,
Bekasi and Karawang.
Jianbizhen (qu), China
Included in Zhenjiang, JS
Jiangyin (Wuxi), GD, China
Included in Zhangjiaggang (Suzhou) JS
Jinjiang, Fuzhou, China
Included in Quanzhou.
Jiujiang, JX, China
Includes Huangmei (Huanggang), HUB.
Kalyan, Maharashtra, India
Included in Mumbai (beginning in 2016).
Karaj, Iran
Included in Tehran.
Karawang, Indonesia
Included in Jakarta
Kenosha, WI, USA
Included in Chicago.
Kissimmee, FL, USA
Included in Orlando.
Kitakyushu, Fukuoka, Japan
Shown as a separate urban area. Some sources combine
Kitakyushu with Fukuoka (such as the United Nations), which is
not a part of the continuous urbanization of Kitakyushu.
Kuala Lumpur, Malaysia
The population is higher other agglomeration estimates (such
as the United Nations), which does not include all of the
continuously developed urban area. Includes Port Klang.
Lagos, Nigeria
Demographia uses the Africapolis estimate as the base. See
discussion above on Nigeria.
Leiden, Netherlands
Included in Rotterdam-Hague
Leon, Mexico
Includes Silao
Lille, France
Extends into Belgium (single labor market)
Livermore, CA, USA
Included in San Francisco.
Los Angeles, CA, USA
Includes Riverside-San Bernardino and Mission Viejo.
Manila, Philippines
Higher than other estimates, which are largely limited to the
National Capital Region. Continuous urbanization extends into
Cavite, Laguna, Bulucan and Rizal.
Maputo, Monzambique
Includes Matola.
McKinney, TX, USA
Included in Dallas-Fort Worth.
Miami, FL, USA
Includes the former urban areas of Fort Lauderdale and West
Palm Beach, which have been incorporated by the US Census
Bureau.
Milan, Italy
The population is higher other agglomeration estimates (such
as the United Nations), which does not include all of the
continuously developed urban area, which stretches well into
Como, Lecco and Varese provinces. Extends into Switzerland
(single labor market). includes Chiasso, Switzerland.
Mission Viejo, CA, USA
Included in Los Angeles.
Mito, Japan
Includes Hitachi
Moscow, Russia
Demographia is indebted to Richard Forstall, who has provided
local authority area population data for portions of Moscow
Oblast within the Moscow urban areas. Other estimates (such as
the United Nations estimate) largely limited to the municipality of
Moscow,
Mumbai, Maharashtra, India
Includes Kalyan, and the Panvel urban area. As of 2016, also
includes the Census of India urban areas of Bhiwandi, Kalyan,
Vasai-Virar beginning in 2016.
Nara, Nara, Japan
Included in Osaka-Kobe-Kyoto.
Nashua, NH, USA
Included in Boston.
Navi Mumbai, Maharashtra, India
Included in Mumbai.
New Delhi, NCT, India
Included in Delhi
New York, NY-NJ-CT, USA
Includes Bridgeport, New Haven, Trenton, Danbury and Twin
Rivers urban areas
Noida, Uttar Pradesh, India
Included in Delhi.
Ordos, NM, China
See Yijinhuoluo-Kangbashi (Ordos), NM
Orlando, FL, USA
Includes Kissimmee.
Osaka-Kobe-Kyoto, Japan
Portions of the prefectures of Osaka, Kobe, Kyoto and Nara
area included. Includes Himeji. United Nations estimates
separate Osaka-Kobe and Kyoto and exclude both Nara and
Himeji.
Oshawa, ON, Canada
Included in Toronto.
Palmerston., NT, Australia
Included in Darwin
Panvel, Maharashtra, India
Included in Mumbai.
Phoenix, AZ, USA
Includes Avondale and Buckeye (which are designated by the
US Census Bureau as separate urban areas).
Port Klang, Malaysia
Included in Kuala Lumpur.
Quanzhou, Fuzhou, China
Includes Shishi and Jinjiang
Riverside-San Bernardino, CA, USA
Included in Los Angeles.
Rostov, Russia
Includes Bataysk.
Rotterdam-Hague, Netherlands
Includes Leiden
Round Lake Beach, IL, USA
Included in Chicago.
Saarbrucken, Germany
Extends into France
Salzburg, Austria
Extends into Germany (single labor market)
San Francisco, CA, USA
Includes San Jose, Concord, Livermore and Vallejo.
San Jose, CA, USA
Included in San Francisco.
San Pedro Sula, Honduras
Includes Choloma.
Sao Paulo, Sao Paulo, Brazil
Includes Francisco Morato.
Seoul-Incheon, Korea
Includes Suweon and Ansan.
Shanghai, China
Includes Taicang
Sharja, UAE
Included in Dubai.
Shenzhen, Guangdong, China
Includes Huiyang qu (Huizhou). 2010 census population was
well below previous local estimates.
Shishi (shi), Fuzhou, China
Included in Quanzhou.
Silao, Mexico
Included in Leon
Strausbourg, France
Extends into Germany (single labor market)
Stuttgart, Germany
Lower estimate than some other sources (such as the
Millennium City database)
Suweon, Korea
Included in Seoul-Incheon.
Taipei, China: Taiwan
The population is higher than other estimates (such as the
United Nations), which do not include all population within the
continuously developed urban area (especially in Taipei
County). Includes continuous urbanization in New Taipei and
Taoyuan.
Taiyuan, Shanxi, China
Includes Yuci qu (Jinzhong).
Taoyuan, China: Taiwan
Included in Taipei.
Tehran, Iran
Includes Karaj.
Tokyo-Yokohama, Japan
Includes large areas Tokyo, Kanagawa, Chiba and Saitama
prefectures and smaller areas of Gunma, Tochigi and Ibaraki
prefectures.
Toronto, ON, Canada
Includes Hamilton and Oshawa.
Trenton, NJ, USA
Included in New York.
Twin Rivers, NJ, USA
Included in New York.
Utrecht, Netherlands
Includes Amersfoort.
Vallejo, CA, USA
Included in San Francisco.
Vasai-Virar, Maharashtra
Included in Mumbai (beginning in 2016).
Xi'an, Shaanxi, China
Includes Xiangyang.
Xiangyang, Shaanxi, China
Incluced in Xi'an.
Xicheng, Ningxia, China
Included in Yinchuan.
Yanzhou, Jiangsu, China
Includes Jiangdu shi.
Yinchuan, Ningxia, China
Includes Xicheng.
Yiwu (Jinhua), ZJ China
Includes Dongyang.
Yuci qu (Jinzhong), Shanxi, China
Included in Taiyuan.
Zhangjiaggang (Suzhou) JS
Includes Jianyin
Zhenjiang, Jiangsu, China
Includes Jianbizhen qu.
7. METHODOLOGY
The current year population estimate is modeled from the base year population, adjusted by population
projections (largely from the United Nations or national statistics authorities).
National census authority population land area data is used where it is reported for urban areas.
19For other
urban areas, Demographia uses mapping software to estimate continuous urbanization. Demographia uses
small area population data, where available, to match population estimates to urban land area.
Sources for Base Population & Land Area Estimates
A base year population is provided for all urban areas. The base year estimate uses the methodology
indicated by the coding in the “Source: Population” column.
19
There are exceptions.
Demographia
provides separate estimates of some urban areas in India, where no build-up
urban area data is reported (in some cases the Census of India reports municipality rather than urban area data).
Demographia
also provides a separate estimate for the land area of Marseille because the INSEE definition includes
The tables indicate the method used to estimate both the land area and the base year population of each
built-up urban area. The following codes are used:
Source Codes: Population and Land Area
Code Source of Land Area or Base Year Population Estimate
A
National census authority built-up urban area data (land area or population).
B
Demographia l
and area estimate based upon map or satellite photograph analysis.
C
Demographia
population from lower order jurisdictions, with downward adjustment for rural population.
D.
Population estimate based upon United Nations agglomeration estimate.
F
Other population estimate or other
Demographia
population estimate..
L
Local government population estimate.
N
Combined urban area using national census authority population or land area data
W
Africapolis
population or land area estimate
Presentation of Source Codes in Tables:
The source codes are listed in the “Pop:Area Source” column
following this form: “C:B”, where “C” indicates the source from which the base population was estimated
and “B” indicates the source of the land area estimate. In this example, the population base is estimated by
Demographia and the land area data is estimated by Demographia.
Reliability
The most reliable sources are as follows:
National census authorities, where representative agglomeration data is available (such as in the
United States, the United Kingdom, Canada, France, Sweden, Norway, India and Australia).
Africapolis population and land area estimates (Source code W), which replicate the results that
would likely be obtained if census authorities in West Africa reported built-up urban area data.
Demographia population estimates developed by building up population estimates from lower order
jurisdictional data to match the urban area boundaries. Estimated rural area populations are
deducted. Data is from national census authorities (Source code C). It is intended that ultimately all
population estimates not from national census authorities or Africapolis for urban area will be
estimated by this method.
Urban Density Calculation
Built-up urban area population densities are expressed in rounded numbers (to the nearest 100 per square
mile or square kilometer). Urban population densities should be considered reasonable approximations.
8. CAUTION: TREND ANALYSIS
Demographia World Urban Areas is a continuing project and attempts to provide “state of the art” data.
Revisions are made as more accurate satellite photographs and population estimates become available. As
a result, Demographia World Urban Areas is not intended for trend analysis.
Year-to-year changes indicated in population and land area may merely reflect better data that was not
used before and may not, therefore indicate a trend. Moreover, the current year population estimates are
nearly always a projection from a base year calculated from census or official estimate data. Changes in
population projection rates can result in substantial current year population estimates that are not related to
actual population growth or loss.
There is little or no historical urban area data and sources are continually improving. Moreover, nearly all of
the data is estimated. Appropriate caution is therefore advised.
9. COVER ILLUSTRATION: ORTIGAS, MANILA
Ortigas, Manila (by author): Dispersion and decentralization have become dominant trends in world cities,
with the exception of those with binding topographical or international boundaries, such as Singapore and
Male (Maldives). Manila is one of the most decentralized cities in the world. Its central business district
(CBD) has long since been exceeded in commercial influence by the Makati CBD. Ortigas is another
expanding business center, just of Makati along the EDSA road artery.(Avenue
Epifanio de los Santos
).
EDSA is perhaps the most important arterial in Manila, not only from the perspective of traffic but also for its
role in political developments over the past three decades.
10. COMMENTS AND SUGGESTIONS
[email protected]
Demographia
PO Box 841
Belleville, Illinois 62222 USA
(St. Louis, Missouri-Illinois Urban Area, USA)
+1.618.632.8507
967 Italy Bologna 525,000 60 155 8,800 3,400 C:B 967 Mexico Tampico 525,000 85 220 6,200 2,400 C:B 967 Russia Astrakhan 525,000 46 119 11,400 4,400 C:B 967 South Korea Pohang 525,000 35 91 15,000 5,800 C:B 967 Switzerland Basel 525,000 77 199 6,800 2,600 C:B 967 Trinidad & Tobago Port of Spain 525,000 110 285 4,800 1,800 F:B 978 India Imphal, MN 520,000 25 65 20,800 8,000 A:B 978 Mexico Culiacan 520,000 68 176 7,600 3,000 C:B 978 Nigeria Abeokuta 520,000 24 62 21,700 8,400 W:B 974 Nigeria Bauchi 520,000 34 88 15,300 5,900 W:B 978 Pakistan Larkana 520,000 10 26 52,000 20,100 D:B 978 Russia Ryazan 520,000 50 130 10,400 4,000 C:B 978 United States Worcester, MA-CT 520,000 304 787 1,600 600 A:A 985 China Sanya, HA 515,000 59 153 8,700 3,400 C:B 985 Congo (Dem. Rep.) Likasi 515,000 25 65 20,600 8,000 D:B 970 France Grenoble 515,000 198 513 2,600 1,000 A:A 985 Ghana Sekondi Takoradi 515,000 35 91 14,700 5,700 W:B 985 India Gaya, BR 515,000 12 31 42,900 16,600 A:B 985 India Jalgaon, MH 515,000 15 39 34,300 13,300 A:B 985 India Patiala, HR 515,000 35 91 14,700 5,700 A:B 985 India Rajahmundry, AP 515,000 21 54 24,500 9,500 A:B 985 India Thoothukkudi, TN 515,000 50 130 10,300 4,000 A:B 985 Iraq Hillah 515,000 19 49 27,100 10,500 D:B 985 Iraq Nasiriyah 515,000 22 57 23,400 9,000 D:B 985 Macedonia Skopje 515,000 35 91 14,700 5,700 C:B 985 Russia Tula 515,000 50 130 10,300 4,000 C:B 985 United States Toledo, OH-MI 515,000 240 622 2,100 800 A:A 999 China Bayan Nur, NM 510,000 52 135 9,800 3,800 C:B 999 Egypt Al Mahallah al Kubra 510,000 10 26 51,000 19,700 C:B 999 Egypt Al Mansurah 510,000 13 34 39,200 15,100 D:B 984 France Douai-Lens 510,000 187 484 2,700 1,000 A:A 996 Japan Kanazawa 510,000 53 137 9,600 3,700 C:B 999 Lithuania Vilnius 510,000 85 220 6,000 2,300 D:B 999 Mexico Xalapa 510,000 29 75 17,600 6,800 C:B 999 Russia Naberezhnye Tchelny 510,000 50 130 10,200 3,900 C:B 999 South Africa Bloemfontein 510,000 68 176 7,500 2,900 D:B 999 Spain Murcia 510,000 38 98 13,400 5,200 C:B 1009 Brazil Maringa 505,000 60 155 8,400 3,200 C:B 1009 China Feicheng (Taian), SD 505,000 26 67 19,400 7,500 C:B 1009 China Qianjiang, HUB 505,000 24 62 21,000 8,100 C:B 1009 Colombia Santa Marta 505,000 11 28 45,900 17,700 C:B 1009 Congo (Dem. Rep.) Kolwezi 505,000 19 49 26,600 10,300 D:B 1009 Kazakhstan Karagandy 505,000 113 293 4,500 1,700 D:B 1009 Russia Penza 505,000 47 122 10,700 4,100 C:B 1009 Zambia Ndola 505,000 36 93 14,000 5,400 C:B 1017 Benin Porto Novo 500,000 39 101 12,800 5,000 W:B 1017 China Lhasa, TIB 500,000 40 104 12,500 4,800 C:B 1017 Russia Lipetsk 500,000 41 106 12,200 4,700 C:B 1017 United Kingdom Edinburgh 500,000 46 120 9,800 3,800 A:A 1017 United States Des Moines, IA 500,000 201 521 2,200 900 A:A 1017 United States Wichita, KS 500,000 215 557 2,200 800 A:A
Note: See "Urban Density Calculation" in the Introduction
997 Djibouti Djibouti 540,000 15 39 36,000 13,900 D:B 997 India Gulbarga, KA 600,000 15 39 40,000 15,400 A:B 997 India Jalgaon, MH 515,000 15 39 34,300 13,300 A:B 997 India Saharanpur, UP 790,000 15 39 52,700 20,300 A:B 997 Indonesia Tasikmalaya 830,000 15 39 55,300 21,400 C:B 997 Syria Al-Hasakah 585,000 15 39 39,000 15,100 D:B 1004 Egypt Port Said 660,000 14 36 47,100 18,200 D:B 1004 India Guntur, AP 765,000 14 36 54,600 21,100 A:B 1006 Colombia Ibague 595,000 13 34 45,800 17,700 C:B 1006 Congo (Dem. Rep.) Tshikapa 730,000 13 34 56,200 21,700 D:B 1006 Egypt Al Mansurah 510,000 13 34 39,200 15,100 D:B 1006 India Bhavnagar, GJ 660,000 13 34 50,800 19,600 A:B 1010 Bangladesh Rajshahi 550,000 12 31 45,800 17,700 C:B 1010 India Ajmer, RJ 590,000 12 31 49,200 19,000 A:B 1010 India Gaya, BR 515,000 12 31 42,900 16,600 A:B 1010 India Kurnool, AP 575,000 12 31 47,900 18,500 A:B 1010 India Malegaon, MH 675,000 12 31 56,300 21,700 A:B 1010 Syria Al-Raqqa 745,000 12 31 62,100 24,000 D:B 1010 Yemen Al-Hudaydah 565,000 12 31 47,100 18,200 D:B 1017 Colombia Santa Marta 505,000 11 28 45,900 17,700 C:B 1017 India Firozabad, UP 585,000 11 28 53,200 20,500 A:B 1017 India Muzaffarnagar, UP 595,000 11 28 54,100 20,900 A:B 1020 China: Macau SAR Macau 655,000 10 26 65,500 25,300 A:B 1020 Egypt Al Mahallah al Kubra 510,000 10 26 51,000 19,700 C:B 1020 Pakistan Larkana 520,000 10 26 52,000 20,100 D:B
Note: See "Urban Density Calculation" in the Introduction
997 United States Albany, NY 615,000 296 767 2,000 800 A:A 997 United States Grand Rapids, MI 590,000 281 728 2,000 800 A:A 997 United States Jacksonville, FL 1,170,000 530 1,373 2,000 800 A:A 997 United States Louisville, KY-IN 1,035,000 477 1,235 2,000 800 A:A 997 United States McAllen, TX 860,000 358 927 2,000 800 A:A 997 United States Sarasota, FL 690,000 327 847 2,000 800 A:A 1003 France Nantes 890,000 453 1,173 1,900 700 A:A 1003 France Toulon 580,000 295 764 1,900 700 A:A 1003 United States Allentown, PA-NJ 715,000 346 896 1,900 700 A:A 1003 United States Charleston, SC 625,000 293 759 1,900 700 A:A 1003 United States Pittsburgh, PA 1,730,000 905 2,344 1,900 700 A:A 1003 United States Richmond, VA 1,030,000 492 1,274 1,900 700 A:A 1003 United States Tulsa, OK 710,000 336 870 1,900 800 A:A 1010 United States Akron, OH 570,000 325 842 1,800 700 A:A 1010 United States Hartford, CT 965,000 516 1,336 1,800 700 A:A 1010 United States Springfield, MA-CT 650,000 349 904 1,800 700 A:A 1013 United States Atlanta, GA 5,120,000 2,645 6,851 1,700 700 A:A 1013 United States Charlotte, NC-SC 1,600,000 741 1,919 1,700 700 A:A 1013 United States Nashville, TN 1,105,000 563 1,458 1,700 700 A:A 1013 United States Raleigh, NC 1,130,000 518 1,342 1,700 700 A:A 1017 United States Baton Rouge, LA 665,000 367 951 1,600 600 A:A 1017 United States Cape Coral, FL 670,000 330 855 1,600 600 A:A 1017 United States Worcester, MA-CT 520,000 304 787 1,600 600 A:A 1020 United States Birmingham, AL 800,000 530 1,373 1,400 500 A:A 1020 United States Columbia, SC 630,000 380 984 1,400 600 A:A 1022 United States Knoxville, TN 645,000 438 1,134 1,300 500 A:A
Note: See "Urban Density Calculation" in the Introduction
Table 4
BUILT-UP URBAN AREAS BY GEOGRAPHY (INCLUDING SELECTED UNDER 500,000 POPULATION)
Urban Areas 500,000 & Over Population
Rank Geography Urban Area Square Miles KilometersSquare Per Square Mile Per Square Kilometer
Afghanistan Herat 475,000 19 49 25,000 9,700 C:B 2016 2015 460,000 121 Afghanistan Kabul 3,650,000 100 259 36,500 14,100 C:B 2016 2016 3,650,000 967 Afghanistan Kandahar 525,000 25 65 21,000 8,100 C:B 2016 2015 510,000 Albania Berat 40,000 2 6 18,200 7,000 C:B 2010 2010 40,000 Albania Fier 50,000 6 14 9,000 3,500 C:B 2010 2010 50,000 790 Albania Tirana 635,000 33 85 19,200 7,400 C:B 2016 2010 560,000 116 Algeria Algiers 3,675,000 170 440 21,600 8,300 C:B 2016 2008 3,250,000 858 Algeria Constantine 590,000 46 119 12,800 5,000 C:B 2016 2008 590,000 494 Algeria Wahran 1,015,000 63 163 16,100 6,200 C:B 2016 2008 920,000 928 Angola Benguela 555,000 40 104 13,900 5,400 C:B 2016 2014 500,000 858 Angola Huambo 590,000 50 130 11,800 4,600 C:B 2016 2014 530,000 Angola Kuito 335,000 32 83 10,500 4,000 C:B 2016 2014 300,000 Angola Lobito 290,000 33 85 8,800 3,400 C:B 2016 2014 260,000 53 Angola Luanda 6,955,000 380 984 18,300 7,100 C:B 2016 2014 6,400,000 814 Angola Lubango 615,000 84 218 7,300 2,800 C:B 2016 2014 550,000 21 Argentina Buenos Aires 14,280,000 1,035 2,681 13,800 5,300 C:B 2016 2010 13,370,000 Argentina Comodora Rivadavia 175,000 18 47 9,700 3,800 C:B 2010 2010 175,000 317 Argentina Cordoba 1,595,000 140 363 11,400 4,400 C:B 2016 2010 1,532,000 610 Argentina La Plata 815,000 88 228 9,300 3,600 C:B 2016 2010 750,000 811 Argentina Mar del Plata 620,000 42 109 14,800 5,700 C:B 2016 2010 575,000 501 Argentina Mendoza 1,010,000 95 246 10,600 4,100 C:B 2016 2010 942,000 371 Argentina Rosario 1,355,000 90 233 15,100 5,800 C:B 2016 2010 1,264,000 903 Argentina Salta 570,000 42 109 13,600 5,200 C:B 2016 2010 525,000 Argentina San Juan 480,000 45 117 10,700 4,100 C:B 2016 2010 450,000 872 Argentina Santa Fe 580,000 45 117 12,900 5,000 C:B 2016 2010 500,000 545 Argentina Tucuman 920,000 44 114 20,900 8,100 D:B 2016 2015 910,000 377 Armenia Yerevan 1,325,000 145 376 9,100 3,500 C:B 2016 2011 1,350,000 435 Australia Adelaide, SA 1,150,000 329 852 3,400 1,300 A:A 2016 2011 1,104,000 Australia Albany, WA 25,000 32 82 900 300 A:A 2011 2011 27,000 Australia Albury, NSW-VIC 75,000 45 116 1,700 700 A:A 2011 2011 77,000 Australia Alice Springs, NT 25,000 19 49 1,300 500 A:A 2011 2011 24,000
Latest
Estimate Base Year Population EstimateBase Year Population
Estimate