Organic Farming as an Alternative in Improving the Economic Viability and Sustainability of Rice Farms
(Study case in North Sumatra, Indonesia)
Diana Chalil1)and Riantri Barus2) 1)University of Sumatera Utara
2)University of Nusa Bangsa
Abstract
the conventional farming. Although the decrease in productivity is followed by the increase in selling price, it is only about 11% and not enough as compensation. Actually, the organic rice can be sold 2-3 times higher if the rice has been certified. In such a condition, the ratio of the selling price and the cost per kg of the certified organic rice could also reach more than 2 times higher than that of the conventional one, with values of 6.75 and 3.28, respectively. Therefore, it can be concluded that with proper management, organic farming has great potential to improve the sustainability and economic viability of rice farming.
Keywords:Organic, Conventional, Rice Farming, Viability, Sustainability, Indonesia
Introduction
In Indonesia, rice is the staple food for most of the 250 million population, thus rice price and availability problems could lead to state instabilities. In relation, the Indonesian government heavily intervenes with the rice industry, including in the pricing of fertilizer and dry grain harvest. In 2014 the Indonesian Government spent as much as US$ 1.8 million for the fertilizer subsidy, but no significant improvement have appeared in the rice price and supply, thus the subsidy began to be considered a burden for government expenditures.
to export it. In fact, until 2013 the progress is still very slow, with no large scale organic farms even only for supplying the domestic needs. Many farmers believe that organic farming is less productive and less profitable, hence reluctant to apply it. Moreover, organic rice agribusiness still faces various weaknesses and threats such as narrow land areas, low productivity, low stage of implementation, no farm records, low income, lack of separate rice milling drying floor and irrigation, low-quality product, lack of marketing network and the government support, which have not been overcome, while the strength and opportunities such as farmers’ experience, increasing demand trend, farmer groups and non-governmental organizations supports, have not been optimized (Safitri and Chalil 2013, 14). In such conditions, the expected role of organic paddy farms in improving the economic viability and sustainability of rice farms are questioned. This study is designed to analyze the expected role and hopefully provide useful information for improving rice farms’ viability and sustainability.
Literature Review
Viability is understood as the ability of a business to survive and prosper over a long period, which can be measured by the level of profitability and its ability to meet financial commitments and pay all its liabilities through its assets (Wiebe 2007). These measurements can be influenced by various factors, such as level of subsidies and ratio of farm input and grocery food prices. The importance of the subsidies on farms viability can be analyzed by the impact of abolishing them. In European countries, many farms with positive income could be negative when all subsidies are cut. On average, 75% of farms in European countries would be viable if subsidies were to be abolished. However, the level of dependency to subsidies appears to have huge difference among countries. The worst country would be left less than 15% farms of the positive income if all subsidies are removed (Johnston 2010).
Research Method
This study was conducted in Desa Lubuk Bayas, Kecamatan Perbaungan Kabupaten Serdang Bedagai, which is purposively selected as it holds the largest organic rice land area in North Sumatra (Bitra Indonesia 2013). The data was collected through depth interviews with 51 organic, semi organic and conventional rice farms, comprising land area, production, consumption, rice prices, the amount and price of labor, fertilizer, and pesticides usage, household expenditure, and income from side jobs.
Farm viability is measured by the net income, revenue-cost ratio and costs per kg of each of the organic, semi organic and conventional farm. Selling prices are calculated in 2 scenarios namely (a) existing condition selling price and (b) potential selling price. Potential selling prices are calculated for organic rice by using the certified organic rice average retail price and the existing ratio of uncertified rice price at farmers’ and retails level as follows:
=
electricity, fuel, transportation, communication, social activities and health costs. Positive difference shows a sustainable condition, otherwise unsustainable.
Results and Discussion
Lubuk Bayas is one of the rice production centers in Sumatera Utara, which has long been a model for other rice-producing centers. Many innovative programs have been developed in this village, including the organic rice program. Unfortunately, the development of the organic rice program is still slow. Since it was first introduced in 2001, only 9 farms have continuously implemented the organic system (Chalil 2014). Many are reluctant due to the low production which in turn gives low income. In fact, the “existing condition” calculation (scenario 1) shows that the average net income of conventional rice appears to be higher than the semi-organic rice and organic.
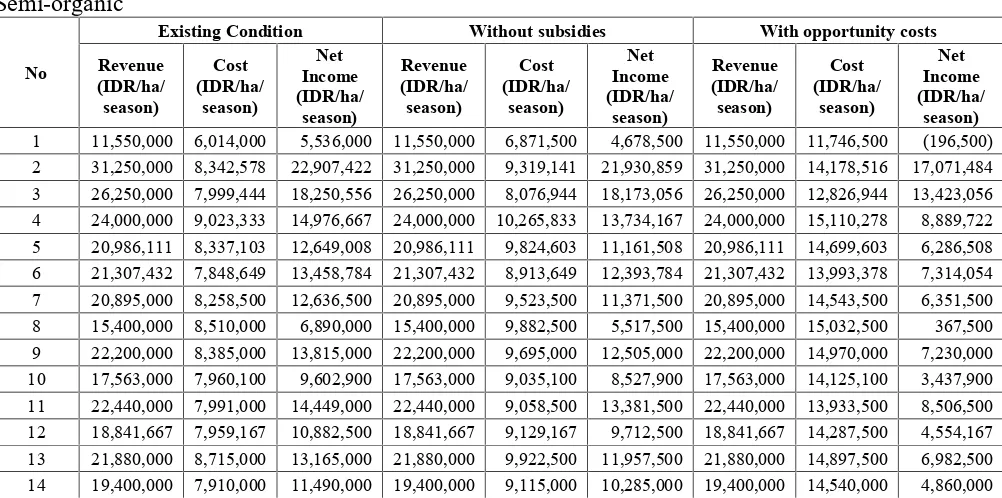
Table 1
Table 1 shows the net income of organic, semi-organic and conventional rice farming in 3 scenarios. Conventional paddy net income is the highest in all scenarios, including that “without subsidies”. On average the price of fertilizer subsidy is only about 50% of the non-subsidized, thus conventional farms expend only 50% of their imputed fertilizer costs. This will greatly affect the net income if the share of fertilizer cost to the total costs is significant, and the share of the subsidized fertilizer to the total fertilizer is significant too. In fact, on average conventional farms use 93.24% of subsidized fertilizers, while that of the semi organic and organic farms only 49.69% and 18.80%, respectively (Figure 1).
Figure 1
and non subsidized farms, respectively. In addition, organic farmers still need an additional expenditure as much as IDR 1.564.153,-/ha (US$ 133.01/ha) for manure, which none being subsidized. In total they use around 5.5 tons/ha organic fertilizer/ha, whereas the recommended amount is 6 tons/ha. On average the organic farms only use less than IDR 400.000,-/ha (US$ 34.01/ha) of the subsidized fertilizer, while that of the conventional reach more than IDR 1,000,000/ha (US$ 85.03/ha). In total, the conventional farms expand more than IDR 3,000,000/ha (US$ 255.10/ha) on fertilizer cost, while the organic ones only around IDR 1,000,000/ha (US$ 85.03/ha). All of these show that organic farming could reduce the subsidized dependency in rice farms.
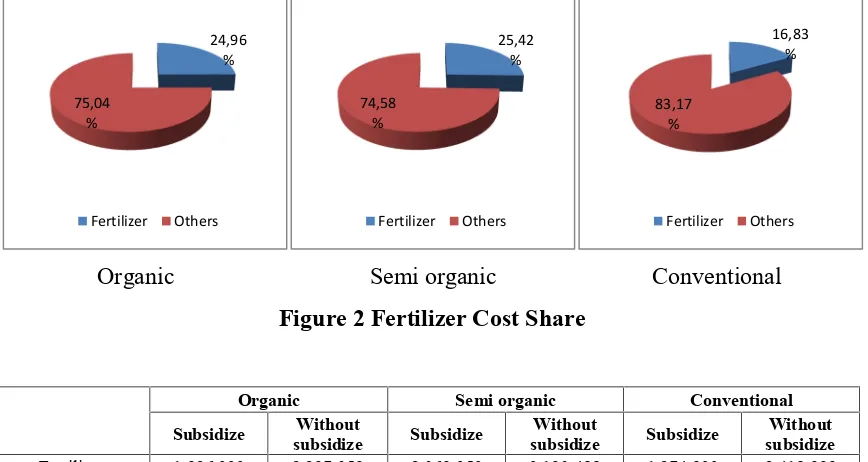
However, abolishing fertilizer subsidies is unlikely to change the net income of each farm system. In conventional farms, fertilizer only contributes 16.83% of the total costs, thus its net income in scenario 2 is still higher than that of the organic farms (Figure 2). Therefore, it can be said that in terms of expenditure organic and conventional farms do not severely depend on the subsidies.
Figure 2
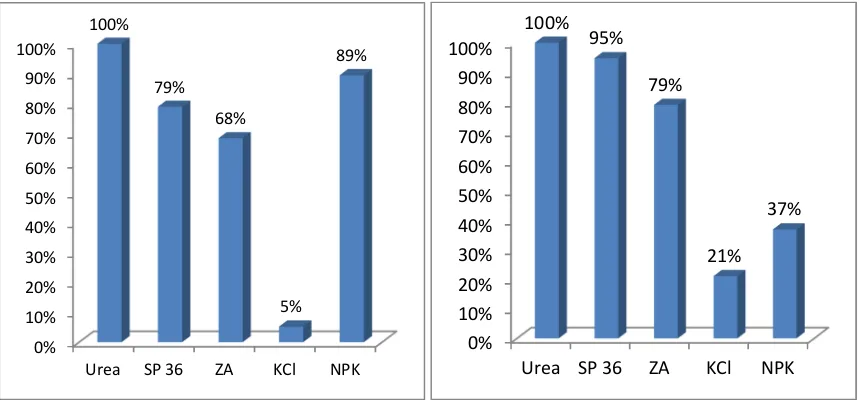
such as the breakage of paddy straw. Moreover, without subsidy, KCL price is much higher than Urea and SP 36.
Figure 3
In general, farmers do not know the recommended amount of each fertilizer. Instead, the usage is influenced by the subsidized fertilizers’ supply or their financial condition to buy the fertilizers. Table 2 shows the comparison between the fertilizer usage and recommendation.
Table 2
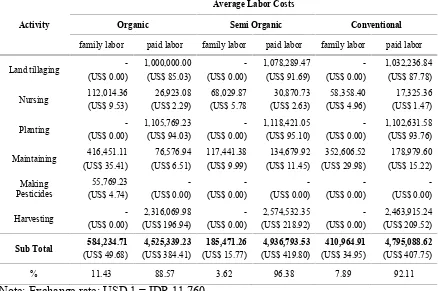
Many suggested that as a trade off to reduce fertilizer costs, organic farms need more labor usage, hence expend more on labor costs. In fact, Table 3 shows that no significant difference is indicated among the organic, semi organic and conventional labor costs, with a total value around IDR 5 million/ha (US$ 425.17). However, most organic farms use a large amount of family labor. While the semi-organic and conventional farms use less than 10% of family labor, that of organic farms use more than 50%.
Table 3
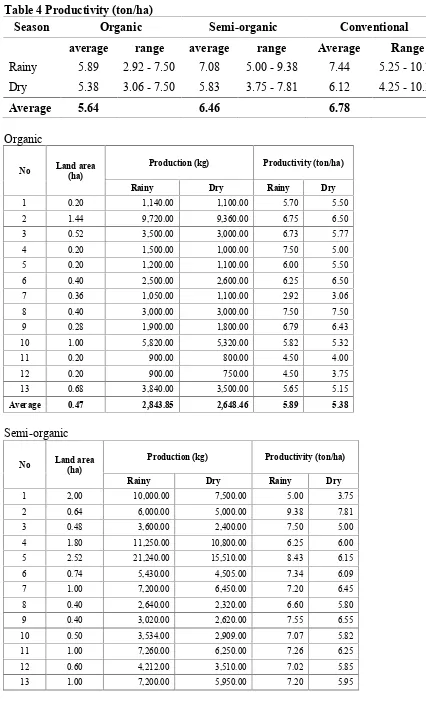
The main reason for using more family labor is to reduce the production costs, since organic farms give fewer revenues. However, the family labor usage might also affect the productivity for at least for two reasons. First, in general paid workers are more specialized thus more effective than family labor. Second, family labor need to handle various works within larger areas, thus might affect the quality of their works. In fact, in this case the average productivity in organic rice farming is only about 80% of the conventional farming.
Table 4
transition from conventional to organic farming systems will initially cause a decrease in the level of productivity. Herawatiet al. (2014) suggested that the transition period will at
least take about 2-3 years. On average, organic rice farmers in Lubuk Bayas have implemented organic farming for more than 4 years. Therefore, theoretically, it should pass the transition period production level, but this is not the case.
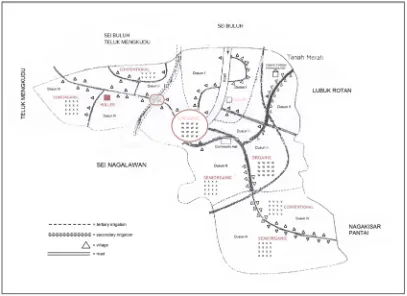
In addition, Amala dan Chalil (2013) indicated that other factors that might cause the low productivity of organic rice stems from the inappropriate usage of supplementary fertilizer. Some farmers reduce the amount to less than recommended, as transporting the fertilizers need some additional labor costs. Currently, no sizeable road is provided for vehicles to deliver the fertilizer until the farm sites. Similar things appear in the pesticides usage, which are reduced due to the lack of supply. Currently, no production input shop provides the organic pesticides, therefore farmers need to make their own or buy it from other farmers. In fact, collecting the raw materials for organic pesticides needs additional time, while farmers often do not have enough time. Moreover, farmers suggest that the organic pesticides usage is not effective, because it only temporarily repels pests while many organic farm locations are still not fully separated with the organic ones (Figure 4).
Figure 4
in a stretch of land area, or builds a separate irrigation for the organic farms. Both cannot be carried merely by farmers. Such a condition makes some farmers reluctant to implement the organic farming system in a larger scale.
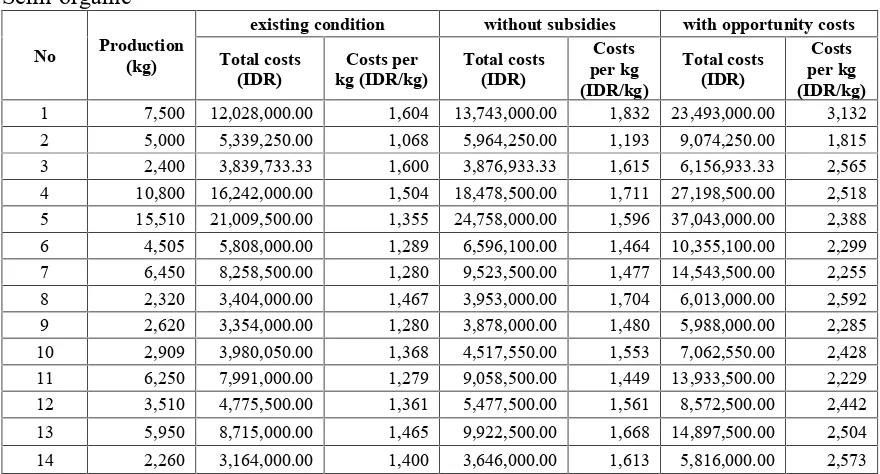
Without including the fertilizer subsidy (scenario 2), production cost for organic farm is still higher than the semi organic and conventional due to lack of fertilizer subsides and the imputed labor costs. In detail, the production cost per kg for organic, semi organic and conventional system for the 3 scenarios can be seen in Table 5.
Table 5
With such cost conditions, the value of R/C ratio for the three types of farming systems in the 3 scenarios can be calculated in 2 selling price namely the existing and potential prices. Table 6 shows that the R/C ratio for the existing selling price is greater than one in all the 3 scenarios.
Table 6
In existing condition (scenario 1) organic R/C ratio is lower than the conventional ones. Similar condition appears in the “opportunity costs” (scenario 3), since the organic use much higher family labor imputed costs. In contrast, organic R/C ratio “without subsidies” (scenario 2) is slightly higher than the conventional, showing its less dependency on the fertilizer subsidy.
The results dramatically change when the revenue is calculated with the potential selling price. The organic R/C ratios increase far above the conventional R/C ratios in all scenarios, indicating the importance of certification in improving the viability and sustainability of organic rice farms.
Table 7
fact, as a main income source, the farm revenue is not only expected to cover the production costs but also the household expenditure. Otherwise, parts that is supposed to be distributed for production costs could be used for household expenditure. If such a condition continues, the farms sustainability would be threatened.
Table 8
Table 8 shows that in all scenarios the revenue derived from rice farming has not been able to meet all expenses for the cost of production and household consumption. Household consumption expenditure is much larger than that of the production costs. However, with an additional income from side jobs, farmers can cover all of their cost production and household expenditures; even if the subsidies are abolished (scenario 2) or the imputed cost are calculated (scenario 3). However, with seasonal farms’ harvest versus a daily base of household expenditures, some farmers require additional loan capital as can be seen in Figure 5.
Figure 5
In such a condition farmers still plant rice for over 21 years because the rice is also used for their household consumption (Table 9). Many organic farmers even grow organic rice only for their family’s consumption, as they believe that organic rice is better for health than the conventional one.
Table 9
Conclusion and Recommendation
Table 1 Average Net Income (IDR/ha/season)
No Scenario Organic Semi-organic Conventional
1 existing condition 11,164,329 (US$ 949.35)
11,714,860.23 (US$ 996.16)
14,345,834.89 (US$ 1,219.88) 2 without subsidies 10,793,60239
(US$ 917.82)
10,593,725.37 (US$ 900.83)
13,201,768.33 (US$ 1,122.05) 3 with opportunity
costs Note: Exchange rate: USD 1 = IDR 11.760
Organic
No
Existing Condition Without subsidies With opportunity costs Revenue 1 13,500,000 7,377,500 6,122,50013,500,000 7,377,500 6,122,500.0013,500,000.0013,827,500.00 (327,500.00) 2 27,687,500 7,059,028 20,628,47227,687,500 7,059,028 20,628,472.2227,687,500.0012,550,694.44 15,136,805.56 3 21,086,538 7,629,808 13,456,73121,086,538 7,629,808 13,456,730.7721,086,538.4612,793,269.23 8,293,269.23 4 22,500,000 7,683,929 14,816,07122,500,000 7,683,929 14,816,071.4322,500,000.0013,033,928.57 9,466,071.43 5 20,936,250 6,705,000 14,231,25020,936,250 6,705,000 14,231,250.0020,936,250.0012,205,000.00 8,731,250.00 6 30,250,000 6,910,417 23,339,58330,250,000 6,910,417 23,339,583.3330,250,000.0011,747,916.67 18,502,083.33 7 7,500,000 6,231,250 1,268,750 7,500,000 6,675,694 824,305.56 7,500,000.0011,509,027.78 (4,009,027.78) 8 24,725,000 10,615,625 14,109,37524,725,00014,990,625 9,734,375.0024,725,000.0020,965,625.00 3,759,375.00 9 17,214,286 6,174,405 11,039,88117,214,286 6,174,405 11,039,880.9517,214,285.7112,304,761.90 4,909,523.81 10 22,140,000 6,589,500 15,550,50022,140,000 6,589,500 15,550,500.0022,140,000.0011,584,500.00 10,555,500.00 11 9,000,000 6,286,250 2,713,750 9,000,000 6,286,250 2,713,750.00 9,000,000.0011,711,250.00 (2,711,250.00) 12 7,875,000 15,132,500(7,257,500) 7,875,00015,132,500(7,257,500.00) 7,875,000.0020,307,500.00(12,432,500.00) 13 21,044,118 5,927,206 15,116,91221,044,118 5,927,206 15,116,911.7621,044,117.6510,924,264.71 10,119,852.94 Average 18,881,438 7,717,109 11,164,32918,881,438 8,087,835 10,793,602.3918,881,437.8313,497,326.02 5,384,111.81
Semi-organic
No
No
Existing Condition Without subsidies With opportunity costs Revenue 15 19,337,500 7,902,500 11,435,000 19,337,500 9,045,000 10,292,500 19,337,500 14,132,500 5,205,000 16 19,005,000 7,893,500 11,111,500 19,005,000 9,088,500 9,916,500 19,005,000 14,133,500 4,871,500 17 6,000,000 9,260,625 (3,260,625) 6,000,000 10,425,625 (4,425,625) 6,000,000 15,988,125 (9,988,125) 18 19,104,167 8,042,292 11,061,875 19,104,167 9,122,292 9,981,875 19,104,167 14,059,792 5,044,375 19 19,823,276 8,298,017 11,525,259 19,823,276 9,638,017 10,185,259 19,823,276 14,564,741 5,258,534 Average 19,854,376 8,139,516 11,714,860 19,854,376 9,260,651 10,593,725 19,854,376 14,303,341 5,551,036
Conventional
No
Existing Condition Without subsidies With opportunity costs Revenue
1 24,325,658 7,900,965 16,424,693 24,325,658 8,725,965 15,599,692.98 24,325,658 13,600,965 10,724,693 2 20,965,909 7,451,894 13,514,015 20,965,909 8,208,712 12,757,196.97 20,965,909 13,633,712 7,332,197 3 24,375,000 7,894,667 16,480,333 24,375,000 8,969,667 15,405,333.33 24,375,000 13,844,667 10,530,333 4 34,178,571 9,896,429 24,282,143 34,178,571 10,838,393 23,340,178.57 34,178,571 15,781,250 18,397,321 5 21,575,000 7,505,114 14,069,886 21,575,000 8,782,614 12,792,386.36 21,575,000 13,407,614 8,167,386 6 26,562,500 8,268,750 18,293,750 26,562,500 9,793,750 16,768,750.00 26,562,500 14,743,750 11,818,750 7 22,857,500 7,018,512 15,838,988 22,857,500 7,385,179 15,472,321.43 22,857,500 12,293,512 10,563,988 8 21,000,000 7,719,000 13,281,000 21,000,000 8,554,000 12,446,000.00 21,000,000 13,339,000 7,661,000 9 17,380,000 8,269,167 9,110,833 17,380,000 9,021,667 8,358,333.33 17,380,000 13,496,667 3,883,333 10 17,700,000 6,273,889 11,426,111 17,700,000 7,161,389 10,538,611.11 17,700,000 12,378,056 5,321,944 11 21,000,000 8,319,792 12,680,208 21,000,000 10,332,292 10,667,708.33 21,000,000 15,538,542 5,461,458 12 21,462,500 7,951,667 13,510,833 21,462,500 8,901,667 12,560,833.33 21,462,500 14,766,667 6,695,833 13 18,375,000 6,745,573 11,629,427 18,375,000 7,886,198 10,488,802.08 18,375,000 13,165,365 5,209,635 14 13,020,000 6,941,250 6,078,750 13,020,000 9,081,250 3,938,750.00 13,020,000 15,537,500 (2,517,500) 15 26,425,000 6,618,056 19,806,944 26,425,000 7,576,389 18,848,611.11 26,425,000 12,938,889 13,486,111 16 29,250,000 7,950,625 21,299,375 29,250,000 9,305,625 19,944,375.00 29,250,000 14,250,625 14,999,375 17 17,857,143 6,541,071 11,316,071 17,857,143 7,558,929 10,298,214.29 17,857,143 12,928,571 4,928,571 18 20,800,000 7,330,000 13,470,000 20,800,000 8,795,000 12,005,000.00 20,800,000 14,095,000 6,705,000 19 17,395,000 7,337,500 10,057,500 17,395,000 8,792,500 8,602,500.00 17,395,000 13,982,500 3,412,500
Organic Semi organic Conventional
Figure 1 Subsidized and Non Subsidized Fertilizer Usage
Organic Semi organic Conventional
Subsidize Without
subsidize Subsidize
Without
subsidize Subsidize
Without subsidize Subsidized
fertilizer 362,179 732,906 1,028,322 2,149,457 1,188,730 2,332,796
Other
fertilizer 1,564,153 1,564,153 1,041,031 1,041,031 86,203 86,203
Total 1,926,333 2,297,059 2,069,353 3,190,488 1,274,933 2,418,999 18,80
%
81,20 %
Subsidize Non subsidize
49,69 % 50,31
%
Subsidize Non subsidize
93,24 % 6,76%
Organic Semi organic Conventional
Figure 2 Fertilizer Cost Share
Organic Semi organic Conventional
Subsidize Without
subsidize Subsidize
Without
subsidize Subsidize
Without subsidize
Fertilizer 1,926,333 2,297,059 2,069,353 3,190,488 1,274,933 2,418,999
Others 5,790,776 5,790,776 6,070,163 6,070,163 6,300,536 6,300,536
Total production
cost 7,717,109 8,087,835 8,139,516 9,260,651 7,575,469 8,719,536 24,96
%
75,04 %
Fertilizer Others
25,42 %
74,58 %
Fertilizer Others
16,83 %
83,17 %
Table 2 Fertilizer Usage and Recommendation Ratio (kg/ha)
Types Semi-organic Conventional
Usage Recom.1) Ratio Existing Recom.1) Ratio
Urea 182.07 225.00 0.81 218.19 250.00 0.87
SP 36 141.67 50.00 2.83 194.69 100.00 1.95
KCL 75.00 30.00 2.50 66.07 50.00 1.32
Source:1)Ministry of Agriculture Republic of Indonesia
No
Semi-organic Conventional
Urea (kg) SP36 (kg) NPK
(kg) KCl (kg)
Urea
(kg) SP36 (kg) NPK (kg) KCl (kg)
1 50.00 75.00 50.00 - 200.00 200.00 - 50.00
2 234.38 - - - 204.55 170.45 -
-3 25.00 - - - 100.00 150.00 100.00
-4 225.00 175.00 75.00 75.00 223.21 267.86 - 89.29
5 225.00 175.00 125.00 - 225.00 125.00 100.00
-6 175.00 175.00 100.00 - 250.00 125.00 125.00
-7 200.00 175.00 125.00 - 83.33 - -
-8 175.00 200.00 125.00 - 200.00 175.00 -
-9 225.00 150.00 125.00 - 175.00 175.00 75.00
10 150.00 150.00 100.00 - 125.00 250.00 -
-11 175.00 150.00 65.00 - 375.00 375.00 -
-12 200.00 175.00 75.00 - 250.00 250.00 -
-13 175.00 150.00 100.00 - 312.50 208.33 -
-14 200.00 125.00 100.00 - 250.00 250.00 250.00
-15 225.00 - 100.00 - 104.17 104.17 104.17
-16 200.00 100.00 75.00 - 375.00 125.00 50.00
17 200.00 - 87.50 - 267.86 178.57 -
-18 150.00 75.00 100.00 - 225.00 175.00 125.00
-19 250.00 75.00 100.00 - 200.00 200.00 125.00
Semi organic Conventional
Figure 3 Farmers’ Composition based on the Use of Fertilizers
0% 10% 20% 30% 40% 50% 60% 70% 80% 90% 100%
Urea SP 36 ZA KCl NPK 100%
79%
68%
5% 89%
0% 10% 20% 30% 40% 50% 60% 70% 80% 90% 100%
Urea SP 36 ZA KCl NPK 100%
95%
79%
Table 3 Composition of Family Labor and Paid Labor (IDR/ha/season)
Activity
Average Labor Costs
Organic Semi Organic Conventional
family labor paid labor family labor paid labor family labor paid labor
Land tillaging
-(US$ 0.00)
Sub Total 584,234.71 (US$ 49.68)
% 11.43 88.57 3.62 96.38 7.89 92.11
Table 4 Productivity (ton/ha)
Season Organic Semi-organic Conventional
average range average range Average Range
Rainy 5.89 2.92 - 7.50 7.08 5.00 - 9.38 7.44 5.25 - 10.71 Dry 5.38 3.06 - 7.50 5.83 3.75 - 7.81 6.12 4.25 - 10.36
Average 5.64 6.46 6.78
Organic
No Land area (ha)
Production (kg) Productivity (ton/ha)
Rainy Dry Rainy Dry
1 0.20 1,140.00 1,100.00 5.70 5.50
2 1.44 9,720.00 9,360.00 6.75 6.50
3 0.52 3,500.00 3,000.00 6.73 5.77
4 0.20 1,500.00 1,000.00 7.50 5.00
5 0.20 1,200.00 1,100.00 6.00 5.50
6 0.40 2,500.00 2,600.00 6.25 6.50
7 0.36 1,050.00 1,100.00 2.92 3.06
8 0.40 3,000.00 3,000.00 7.50 7.50
9 0.28 1,900.00 1,800.00 6.79 6.43
10 1.00 5,820.00 5,320.00 5.82 5.32
11 0.20 900.00 800.00 4.50 4.00
12 0.20 900.00 750.00 4.50 3.75
13 0.68 3,840.00 3,500.00 5.65 5.15
Average 0.47 2,843.85 2,648.46 5.89 5.38
Semi-organic
No Land area (ha)
Production (kg) Productivity (ton/ha)
Rainy Dry Rainy Dry
1 2,00 10,000.00 7,500.00 5.00 3.75
2 0.64 6,000.00 5,000.00 9.38 7.81
3 0.48 3,600.00 2,400.00 7.50 5.00
4 1.80 11,250.00 10,800.00 6.25 6.00
5 2.52 21,240.00 15,510.00 8.43 6.15
6 0.74 5,430.00 4,505.00 7.34 6.09
7 1.00 7,200.00 6,450.00 7.20 6.45
8 0.40 2,640.00 2,320.00 6.60 5.80
9 0.40 3,020.00 2,620.00 7.55 6.55
10 0.50 3,534.00 2,909.00 7.07 5.82
11 1.00 7,260.00 6,250.00 7.26 6.25
12 0.60 4,212.00 3,510.00 7.02 5.85
No Land area (ha)
Production (kg) Productivity (ton/ha)
Rainy Dry Rainy Dry
14 0.40 2,760.00 2,260.00 6.90 5.65
15 0.80 5,820.00 4,820.00 7.28 6.03
16 1.00 7,080.00 5,830.00 7.08 5.83
17 0.16 840.00 640.00 5.25 4.00
18 0.96 6,840.00 5,640.00 7.13 5.88
19 1.16 8,340.00 6,890.00 7.19 5.94
Average 0.92 6,540.32 5,358.11 7.08 5.83
Conventional
No Land area (ha)
Production (kg) Productivity (ton/ha)
Rainy Dry Rainy Dry
1 1.52 11,400.00 9,500.00 7.50 6.25
2 0.44 3,200.00 2,500.00 7.27 5.68
3 3.00 22,500.00 18,750.00 7.50 6.25
4 0.56 6,000.00 5,800.00 10.71 10.36
5 0.88 6,600.00 4,400.00 7.50 5.00
6 0.40 3,000.00 2,500.00 7.50 6.25
7 1.20 8,708.00 7,160.00 7.26 5.97
8 1.00 7,000.00 6,000.00 7.00 6.00
9 0.40 2,100.00 1,700.00 5.25 4.25
10 0.60 3,300.00 2,560.00 5.50 4.27
11 0.80 5,000.00 4,300.00 6.25 5.38
12 0.20 1,600.00 1,500.00 8.00 7.50
13 0.48 3,600.00 2,400.00 7.50 5.00
14 0.20 1,700.00 1,100.00 8.50 5.50
15 0.48 3,700.00 3,500.00 7.71 7.29
16 0.40 3,800.00 3,000.00 9.50 7.50
17 0.56 3,500.00 3,000.00 6.25 5.36
18 0.40 2,820.00 2,320.00 7.05 5.80
19 0.50 3,510.00 2,885.00 7.02 5.77
Source: Chalil 2014, 526
Table 5 Costs per Kg (IDR/kg)
Scenarios Organic Semi-organic Conventional
existing condition 1,537.01 (US$ 0.13)
1,424.51 (US$ 0.12)
1,286.35 (US$ 0.11)
without subsidies 1,593.07 (US$ 0.14)
1,618.86 (US$ 0.14)
1,483.11 (US$ 0.13)
with opportunity costs 2,647.30 (US$ 0.23)
2,507.32 (US$ 0.21)
2,367.09 (US$ 0.20) Note: Exchange rate: USD 1 = IDR 11.760
Organic
No Production (kg)
existing condition without subsidies with opportunity costs Total costs
1 1,100.00 1,475,500.00 1,341.36 1,475,500 1,341.36 2,765,500.00 2,514.09
2 9,360.00 10,165,000.00 1,086.00 10,165,000 1,086.00 18,073,000.00 1,930.88
3 3,000.00 3,967,500.00 1,322.50 3,967,500 1,322.50 6,652,500.00 2,217.50
4 1,000.00 1,536,785.71 1,536.79 1,536,786 1,536.79 2,606,785.71 2,606.79
5 1,100.00 1,341,000.00 1,219.09 1,341,000 1,219.09 2,441,000.00 2,219.09
6 2,600.00 2,764,166.67 1,063.14 2,764,167 1,063.14 4,699,166.67 1,807.37
7 1,100.00 2,243,250.00 2,039.32 2,403,250 2,184.77 4,143,250.00 3,766.59
8 3,000.00 4,246,250.00 1,415.42 5,996,250 1,998.75 8,386,250.00 2,795.42
9 1,800.00 1,728,833.33 960.46 1,728,833 960.46 3,445,333.33 1,914.07
10 5,320.00 6,589,500.00 1,238.63 6,589,500 1,238.63 11,584,500.00 2,177.54
11 800.00 1,257,250.00 1,571.56 1,257,250 1,571.56 2,342,250.00 2,927.81
12 750.00 3,026,500.00 4,035.33 3,026,500 4,035.33 4,061,500.00 5,415.33
13 3,500.00 4,030,500.00 1,151.57 4,030,500 1,151.57 7,428,500.00 2,122.43
Average 2,648.46 3,413,233.52 1,537.01 3,560,157 1,593.07 6,048,425.82 2,647.30
Semi-organic
No Production (kg)
existing condition without subsidies with opportunity costs Total costs
1 7,500 12,028,000.00 1,604 13,743,000.00 1,832 23,493,000.00 3,132
2 5,000 5,339,250.00 1,068 5,964,250.00 1,193 9,074,250.00 1,815
3 2,400 3,839,733.33 1,600 3,876,933.33 1,615 6,156,933.33 2,565
4 10,800 16,242,000.00 1,504 18,478,500.00 1,711 27,198,500.00 2,518
5 15,510 21,009,500.00 1,355 24,758,000.00 1,596 37,043,000.00 2,388
6 4,505 5,808,000.00 1,289 6,596,100.00 1,464 10,355,100.00 2,299
7 6,450 8,258,500.00 1,280 9,523,500.00 1,477 14,543,500.00 2,255
8 2,320 3,404,000.00 1,467 3,953,000.00 1,704 6,013,000.00 2,592
9 2,620 3,354,000.00 1,280 3,878,000.00 1,480 5,988,000.00 2,285
10 2,909 3,980,050.00 1,368 4,517,550.00 1,553 7,062,550.00 2,428
11 6,250 7,991,000.00 1,279 9,058,500.00 1,449 13,933,500.00 2,229
12 3,510 4,775,500.00 1,361 5,477,500.00 1,561 8,572,500.00 2,442
13 5,950 8,715,000.00 1,465 9,922,500.00 1,668 14,897,500.00 2,504
No Production (kg)
existing condition without subsidies with opportunity costs Total costs
15 4,820 6,322,000.00 1,312 7,236,000.00 1,501 11,306,000.00 2,346
16 5,830 7,893,500.00 1,354 9,088,500.00 1,559 14,133,500.00 2,424
17 640 1,481,700.00 2,315 1,668,100.00 2,606 2,558,100.00 3,997
18 5,640 7,720,600.00 1,369 8,757,400.00 1,553 13,497,400.00 2,393
19 6,890 9,625,700.00 1,397 11,180,100.00 1,623 16,895,100.00 2,452
Average 5,358.11 7,418,528.07 1,424.51 8,490,707.02 1,618.86 13,080,917.54 2,507.32
Conventional
No Production (kg)
existing condition without subsidies with opportunity costs Total costs
1 9,500 12,009,466.67 1,264 9,500 1,396 20,673,466.67 2,176
2 2,500.00 3,278,833.33 1,312 2,500.00 1,445 5,998,833.33 2,400
3 18,750.00 23,684,000.00 1,263 18,750.00 1,435 41,534,000.00 2,215
4 5,800.00 5,542,000.00 956 5,800.00 1,046 8,837,500.00 1,524
5 4,400.00 6,604,500.00 1,501 4,400.00 1,757 11,798,700.00 2,682
6 2,500.00 3,307,500.00 1,323 2,500.00 1,567 5,897,500.00 2,359
7 7,160.00 8,422,214.29 1,176 7,160.00 1,238 14,752,214.29 2,060
8 6,000.00 7,719,000.00 1,287 6,000.00 1,426 13,339,000.00 2,223
9 1,700.00 3,307,666.67 1,946 1,700.00 2,123 5,398,666.67 3,176
10 2,560.00 3,764,333.33 1,470 2,560.00 1,678 7,426,833.33 2,901
11 4,300.00 6,655,833.33 1,548 4,300.00 1,922 12,430,833.33 2,891
12 1,500.00 1,590,333.33 1,060 1,500.00 1,187 2,953,333.33 1,969
13 2,400.00 3,237,875.00 1,349 2,400.00 1,577 6,319,375.00 2,633
14 1,100.00 1,388,250.00 1,262 1,100.00 1,651 3,107,500.00 2,825
15 3,500.00 3,176,666.67 908 3,500.00 1,039 6,210,666.67 1,774
16 3,000.00 3,180,250.00 1,060 3,000.00 1,241 5,700,250.00 1,900
17 3,000.00 3,663,000.00 1,221 3,000.00 1,411 7,240,000.00 2,413
18 2,320.00 2,932,000.00 1,264 2,320.00 1,516 5,638,000.00 2,430
19 2,885.00 3,668,750.00 1,272 2,885.00 1,524 6,991,250.00 2,423
Table 6 R/C Ratio with Existing Selling Price
No Scenario Organic Semi-organic Conventional
1 existing condition 2.63 2.44 2.89
2 without subsidies 2.57 2.16 2.52
3 with opportunity costs 1.47 1.39 1.58
Organic
Average 2.63 2.57 1.47
Semi-organic
Conventional
No
R/C ratio existing
condition
without subsidies
with opportunity
costs
1 3.08 2.79 1.79
2 2.81 2.55 1.54
3 3.09 2.72 1.76
4 3.45 3.15 2.17
5 2.87 2.46 1.61
6 3.21 2.71 1.80
7 3.26 3.10 1.86
8 2.72 2.45 1.57
9 2.10 1.93 1.29
10 2.82 2.47 1.43
11 2.52 2.03 1.35
12 2.70 2.41 1.45
13 2.72 2.33 1.40
14 1.88 1.43 0.84
15 3.99 3.49 2.04
16 3.68 3.14 2.05
17 2.73 2.36 1.38
18 2.84 2.36 1.48
19 2.37 1.98 1.24
Table 7 R/C Ratio with Certified Product Selling Price (IDR/ha/season)
Scenario
Organic
Revenue Cost Income R/C
existing condition 41,603,672 (US$ 3,537.73)
7,717,108 (US$ 656.22)
33,886,563
(US$ 2,881.51) 5.78 without subsidies 41,603,672
(US$ 3,537.73)
8,087,835 (US$ 687.74)
33,515,836
(US$ 2,849.99) 5.65 with opportunity costs 41,603,672
(US$ 3,537.73)
13,497,326 (US$ 1,147.73)
28,106,345
(US$ 2,390.00) 3.22 Note: Exchange rate: USD 1 = IDR 11.760
Organic
(IDR/ha/ season) R/C ratio
1 29,563,392.86 7,377,500 22,185,892.86 4.01
2 60,632,328.87 7,059,028 53,573,301.09 8.59
3 48,893,303.57 7,629,808 41,263,495.88 6.41
4 49,272,321.43 7,683,929 41,588,392.86 6.41
5 45,847,895.09 6,705,000 39,142,895.09 6.84
6 59,619,508.93 6,910,417 52,709,092.26 8.63
7 16,424,107.14 6,231,250 10,192,857.14 2.64
8 56,663,169.64 10,615,625 46,047,544.64 5.34
9 42,409,390.94 6,174,405 36,234,986.18 6.87
10 48,483,964.29 6,589,500 41,894,464.29 7.36
11 19,708,928.57 6,286,250 13,422,678.57 3.14
12 17,245,312.50 15,132,500 2,112,812.50 1.14
13 46,084,112.39 5,927,206 40,156,906.51 7.78
Average 41,603,672.02 7,717,109 33,886,563.07 5.78
No
(IDR/ha/ season) R/C ratio
1 29,563,392.86 7,377,500 22,185,892.86 4.01
2 60,632,328.87 7,059,028 53,573,301.09 8.59
3 48,893,303.57 7,629,808 41,263,495.88 6.41
4 49,272,321.43 7,683,929 41,588,392.86 6.41
5 45,847,895.09 6,705,000 39,142,895.09 6.84
6 59,619,508.93 6,910,417 52,709,092.26 8.63
7 16,424,107.14 6,675,694 9,748,412.70 2.46
8 56,663,169.64 14,990,625 41,672,544.64 3.78
9 42,409,390.94 6,174,405 36,234,986.18 6.87
10 48,483,964.29 6,589,500 41,894,464.29 7.36
No
Without subsidies Revenue
(IDR/ha/ season)
Cost (IDR/ha/ season)
Net Income
(IDR/ha/ season) R/C ratio
12 17,245,312.50 15,132,500 2,112,812.50 1.14
13 46,084,112.39 5,927,206 40,156,906.51 7.78
Average 41,603,672.02 8,087,835 33,515,836.57 5.65
No
With opportunity costs Revenue
(IDR/ha/ season)
Cost (IDR/ha/ season)
Net Income
Table 8 Family Income and Expenditure (IDR/month)
Organic Semi Organic Conventional
Scenario 1: existing condition
household/farm expenditure 3.32 1.76 2.45
farm revenue-total expenditure -768,756 (US$ -65.37)
-319,196 (US$ -27.14)
-448,083 (US$ -38.10) total income-total expenditure 609,274
(US$ 51.81)
1,345,933.81 (US$ 114.45)
1,583,384.74 (US$ 134.64)
Scenario 2: without subsidies
household/farm expenditure 3.16 1.54 2.16
farm revenue-total expenditure -797,089 (US$ -67.78)
-497,892 (US$ -42.34)
-578,287 (US$ -49.17) total income-total expenditure 584,787
(US$ 49.73)
1,167,237.32 (US$ 99.25)
1,453,181.23 (US$ 123.57)
Scenario 3: opportunity costs
household/farm expenditure 1.87 1.00 1.36
farm revenue-total expenditure -1,207,955 (US$ -102.72)
-1,262,927 (US$ -107.39)
-1,194,710 (US$ -101.59) total income-total expenditure 170,076
(US$ 14.46)
402,202.23 (US$ 34.20)
836,757.99 (US$ 71.15) Note: Exchange rate: USD 1 = IDR 11.760
Organic
Scenario 1: existing condition
No
1 450,000 500,000 245,917 1,000,000 (795,917) (295,917)
2 6,645,000 1,500,000 1,694,167 2,500,000 2,450,833 3,950,833
3 1,827,500 1,291,667 661,250 3,000,000 (1,833,750) (542,083)
4 750,000 - 256,131 - 493,869 493,869
5 697,875 900,000 223,500 1,200,000 (725,625) 174,375
6 2,016,667 3,000,000 460,694 2,000,000 (444,028) 2,555,972
7 450,000 - 373,875 - 76,125 76,125
8 1,648,333 750,000 707,708 2,304,333 (1,363,708) (613,708)
9 803,333 1,416,667 288,139 1,154,000 (638,806) 777,861
10 3,690,000 450,000 1,098,250 1,667,000 924,750 1,374,750
11 300,000 1,100,000 209,542 2,433,333 (2,342,875) (1,242,875)
12 262,500 1,050,000 504,417 1,869,000 (2,110,917) (1,060,917)
13 2,385,000 3,200,000 671,750 1,624,000 89,250 3,289,250
Scenario 2: without subsidies
1 450,000 500,000 245,917 1,000,000 (795,917) (295,917)
2 6,645,000 1,500,000 1,694,167 2,500,000 2,450,833 3,950,833
3 1,827,500 1,291,667 661,250 3,000,000 (1,833,750) (542,083)
4 750,000 - 256,131 - 493,869 493,869
5 697,875 900,000 223,500 1,200,000 (725,625) 174,375
6 2,016,667 3,000,000 460,694 2,000,000 (444,028) 2,555,972
7 450,000 - 400,542 - 49,458 49,458
8 1,648,333 750,000 999,375 2,304,333 (1,655,375) (905,375)
9 803,333 1,416,667 288,139 1,154,000 (638,806) 777,861
10 3,690,000 450,000 1,098,250 1,667,000 924,750 1,374,750
11 300,000 1,100,000 209,542 2,433,333 (2,342,875) (1,242,875)
12 262,500 1,050,000 504,417 1,869,000 (2,110,917) (1,060,917)
13 2,385,000 3,200,000 671,750 1,624,000 89,250 3,289,250
Average 1,686,631 1,378,030 593,359 1,886,515 (793,243) 584,787
Scenario 3: opportunity costs
No
1 450,000 500,000 460,917 1,000,000 (1,010,917) (510,917)
2 6,645,000 1,500,000 3,012,167 2,500,000 1,132,833 2,632,833
3 1,827,500 1,291,667 1,108,750 3,000,000 (2,281,250) (989,583)
4 750,000 - 434,464 - 315,536 315,536
5 697,875 900,000 406,833 1,200,000 (908,958) (8,958)
6 2,016,667 3,000,000 783,194 2,000,000 (766,528) 2,233,472
7 450,000 - 690,542 - (240,542) (240,542)
8 1,648,333 750,000 1,397,708 2,304,333 (2,053,708) (1,303,708)
9 803,333 1,416,667 574,222 1,154,000 (924,889) 491,778
10 3,690,000 450,000 1,930,750 1,667,000 92,250 542,250
11 300,000 1,100,000 390,375 2,433,333 (2,523,708) (1,423,708)
12 262,500 1,050,000 676,917 1,869,000 (2,283,417) (1,233,417)
13 2,385,000 3,200,000 1,238,083 1,624,000 (477,083) 2,722,917
Average 1,686,631 1,378,030 1,008,071 1,886,515 (1,207,955) 170,076
Semi-organic
Scenario 1: existing condition
No
1 3,850,000 - 2,004,667 1,845,333 1,845,333
No
3 2,100,000 1,350,000 639,956 1,500,000 (39,956) 1,310,044
4 7,200,000 1,695,000 2,707,000 3,000,000 1,493,000 3,188,000
5 8,814,167 3,200,000 3,501,583 3,117,000 2,195,583 5,395,583
6 2,627,917 3,000,000 968,000 2,281,000 (621,083) 2,378,917
7 3,482,500 - 1,376,417 2,974,000 (867,917) (867,917)
8 1,026,667 834,666 567,333 1,917,000 (1,457,667) (623,001)
9 1,480,000 300,000 559,000 1,367,000 (446,000) (146,000)
10 1,463,583 1,333,333 663,342 2,173,000 (1,372,758) (39,425)
11 3,740,000 5,900,000 1,331,833 3,075,333 (667,166) 5,232,834
12 1,884,167 1,333,333 795,917 2,498,500 (1,410,250) (76,917)
13 3,646,667 333,333 1,452,500 2,559,000 (364,833) (31,500)
14 1,293,333 666,666.00 527,333 1,349,000.00 (583,000) 83,666
15 2,578,333 1,550,000.00 1,053,667 2,043,000.00 (518,333) 1,031,667
16 3,167,500 1,500,000.00 1,315,583 2,191,000.00 (339,083) 1,160,917
17 160,000 2,500,000.00 246,950 1,747,000.00 (1,833,950) 666,050
18 3,056,667 1,000,000.00 1,286,767 1,677,000.00 92,900 1,092,900
19 3,832,500 476,000.00 1,604,283 1,667,000.00 561,217 1,037,217
Average 3,091,439 1,665,130 1,236,421 2,174,213 (319,196) 1,345,934
Scenario 2: without subsidies
No
1 3,850,000 - 2,290,500 - 1,559,500 1,559,500
2 3,333,333 3,000,000 994,042 2,000,000 339,292 3,339,292
3 2,100,000 1,350,000 646,156 1,500,000 (46,156) 1,303,844
4 7,200,000 1,695,000 3,079,750 3,000,000 1,120,250 2,815,250
5 8,814,167 3,200,000 4,126,333 3,117,000 1,570,833 4,770,833
6 2,627,917 3,000,000 1,099,350 2,281,000 (752,433) 2,247,567
7 3,482,500 - 1,587,250 2,974,000 (1,078,750) (1,078,750)
8 1,026,667 834,666 658,833 1,917,000 (1,549,167) (714,501)
9 1,480,000 300,000 646,333 1,367,000 (533,333) (233,333)
10 1,463,583 1,333,333 752,925 2,173,000 (1,462,342) (129,009)
11 3,740,000 5,900,000 1,509,750 3,075,333 (845,083) 5,054,917
12 1,884,167 1,333,333 912,917 2,498,500 (1,527,250) (193,917)
13 3,646,667 333,333 1,653,750 2,559,000 (566,083) (232,750)
14 1,293,333 666,666.00 607,667 1,349,000.00 (663,333) 3,333
15 2,578,333 1,550,000.00 1,206,000 2,043,000.00 (670,667) 879,333
16 3,167,500 1,500,000.00 1,514,750 2,191,000.00 (538,250) 961,750
17 160,000 2,500,000.00 278,017 1,747,000.00 (1,865,017) 634,983
18 3,056,667 1,000,000.00 1,459,567 1,677,000.00 (79,900) 920,100
No Average 3,091,439 1,665,130 1,415,118 2,174,213 (497,892) 1,167,237
Scenario 3: opportunity costs
No Farm Revenue (IDR/month)
1 3,850,000 - 3,915,500 - (65,500) (65,500)
2 3,333,333 3,000,000 1,512,375 2,000,000 (179,042) 2,820,958
3 2,100,000 1,350,000 1,026,156 1,500,000 (426,156) 923,844
4 7,200,000 1,695,000 4,533,083 3,000,000 (333,083) 1,361,917
5 8,814,167 3,200,000 6,173,833 3,117,000 (476,667) 2,723,333
6 2,627,917 3,000,000 1,725,850 2,281,000 (1,378,933) 1,621,067
7 3,482,500 - 2,423,917 2,974,000 (1,915,417) (1,915,417)
8 1,026,667 834,666 1,002,167 1,917,000 (1,892,500) (1,057,834)
9 1,480,000 300,000 998,000 1,367,000 (885,000) (585,000)
10 1,463,583 1,333,333 1,177,092 2,173,000 (1,886,508) (553,175)
11 3,740,000 5,900,000 2,322,250 3,075,333 (1,657,583) 4,242,417
12 1,884,167 1,333,333 1,428,750 2,498,500 (2,043,083) (709,750)
13 3,646,667 333,333 2,482,917 2,559,000 (1,395,250) (1,061,917)
14 1,293,333 666,666.00 969,333 1,349,000.00 (1,025,000) (358,334)
15 2,578,333 1,550,000.00 1,884,333 2,043,000.00 (1,349,000) 201,000
16 3,167,500 1,500,000.00 2,355,583 2,191,000.00 (1,379,083) 120,917
17 160,000 2,500,000.00 426,350 1,747,000.00 (2,013,350) 486,650
18 3,056,667 1,000,000.00 2,249,567 1,677,000.00 (869,900) 130,100
19 3,832,500 476,000.00 2,815,850 1,667,000.00 (650,350) (174,350)
Average 3,091,439 1,665,130 2,180,153 2,174,213 (1,262,927) 402,202
Conventional
Scenario 1: existing condition
No Farm Revenue (IDR/month)
1 6,162,500 3,250,000 2,001,578 3,000,000 1,160,922 4,410,922
2 1,537,500 1,500,000 546,472 1,400,000 (408,972) 1,091,028
3 12,187,500 3,000,000 3,947,333 3,000,000 5,240,167 8,240,167
4 3,190,000 500,000 923,667 5,000,000 (2,733,667) (2,233,667)
5 3,164,333 17,000,000 1,100,750 7,000,000 (4,936,417) 12,063,583
6 1,770,833 1,291,667 551,250 3,000,000 (1,780,417) (488,750)
7 4,571,500 700,000 1,403,702 2,900,000 267,798 967,798
No Farm Revenue
10 1,770,000 120,000 627,389 2,000,000 (857,389) (737,389)
11 2,800,000 683,333 1,109,306 1,500,000 190,694 874,028
12 715,417 180,000 265,056 659,000 (208,639) (28,639)
13 1,470,000 1,500,000 539,646 1,520,500 (590,146) 909,854
14 434,000 2,000,000.00 231,375 2,627,000.00 (2,424,375) (424,375)
15 2,114,000 3,000,000.00 529,444 1,782,333.33 (197,778) 2,802,222
16 1,950,000 840,000.00 530,042 1,221,000.00 198,958 1,038,958
17 1,666,667 720,000.00 610,500 1,486,000.00 (429,833) 290,167
18 1,386,667 1,200,000.00 488,667 1,583,000.00 (685,000) 515,000
19 1,449,583 224,000.00 611,458 878,500.00 (40,375) 183,625
Average 2,789,430 2,031,468 939,759 2,297,754 (448,083) 1,583,385
Scenario 2: without subsidies
No
1 6,162,500 3,250,000 2,210,578 3,000,000 951,922 4,201,922
2 1,537,500 1,500,000 601,972 1,400,000 (464,472) 1,035,528
3 12,187,500 3,000,000 4,484,833 3,000,000 4,702,667 7,702,667
4 3,190,000 500,000 1,011,583 5,000,000 (2,821,583) (2,321,583)
5 3,164,333 17,000,000 1,288,117 7,000,000 (5,123,783) 11,876,217
6 1,770,833 1,291,667 652,917 3,000,000 (1,882,083) (590,417)
7 4,571,500 700,000 1,477,036 2,900,000 194,464 894,464
8 3,500,000 388,889 1,425,667 2,100,000 (25,667) 363,222
9 1,158,667 500,000 601,444 1,000,000 (442,778) 57,222
10 1,770,000 120,000 716,139 2,000,000 (946,139) (826,139)
11 2,800,000 683,333 1,377,639 1,500,000 (77,639) 605,694
12 715,417 180,000 296,722 659,000 (240,306) (60,306)
13 1,470,000 1,500,000 630,896 1,520,500 (681,396) 818,604
14 434,000 2,000,000.00 302,708 2,627,000.00 (2,495,708) (495,708)
15 2,114,000 3,000,000.00 606,111 1,782,333.33 (274,444) 2,725,556
16 1,950,000 840,000.00 620,375 1,221,000.00 108,625 948,625
17 1,666,667 720,000.00 705,500 1,486,000.00 (524,833) 195,167
18 1,386,667 1,200,000.00 586,333 1,583,000.00 (782,667) 417,333
19 1,449,583 224,000.00 732,708 878,500.00 (161,625) 62,375
Average 2,789,430 2,031,468 1,069,962 2,297,754 (578,287) 1,453,181
Scenario 3: opportunity costs
No
1 6,162,500 3,250,000 3,445,578 3,000,000 (283,078) 2,966,922
No
Farm Revenue (IDR/month)
Side jobs Revenue (IDR/month)
Farm expenditure (IDR/month)
Household expenditure (IDR/month)
farm revenue-total
expenditure (IDR/month)
total income-total expenditure (IDR/month)
3 12,187,500 3,000,000 6,922,333 3,000,000 2,265,167 5,265,167
4 3,190,000 500,000 1,472,917 5,000,000 (3,282,917) (2,782,917)
5 3,164,333 17,000,000 1,966,450 7,000,000 (5,802,117) 11,197,883
6 1,770,833 1,291,667 982,917 3,000,000 (2,212,083) (920,417)
7 4,571,500 700,000 2,458,702 2,900,000 (787,202) (87,202)
8 3,500,000 388,889 2,223,167 2,100,000 (823,167) (434,278)
9 1,158,667 500,000 899,778 1,000,000 (741,111) (241,111)
10 1,770,000 120,000 1,237,806 2,000,000 (1,467,806) (1,347,806)
11 2,800,000 683,333 2,071,806 1,500,000 (771,806) (88,472)
12 715,417 180,000 492,222 659,000 (435,806) (255,806)
13 1,470,000 1,500,000 1,053,229 1,520,500 (1,103,729) 396,271
14 434,000 2,000,000.00 517,917 2,627,000.00 (2,710,917) (710,917)
15 2,114,000 3,000,000.00 1,035,111 1,782,333.33 (703,444) 2,296,556
16 1,950,000 840,000.00 950,042 1,221,000.00 (221,042) 618,958
17 1,666,667 720,000.00 1,206,667 1,486,000.00 (1,026,000) (306,000)
18 1,386,667 1,200,000.00 939,667 1,583,000.00 (1,136,000) 64,000
19 1,449,583 224,000.00 1,165,208 878,500.00 (594,125) (370,125)
Figure 5 Farmers Capital Resources
Organic
Capital Resources Frequency Percentage (%)
Have own capital 10 76.92
Loan Capital 3 23.08
Total 13 100.00%
Semi-organic
Capital Resources Frequency Percentage (%)
Have own capital 18 94.74
Loan Capital 1 5.26
Total 19 100.00
Conventional
Capital Resources Frequency Percentage (%)
Have own capital 14 73.68
Loan Capital 5 26.32
Total 19 100.00
0% 10% 20% 30% 40% 50% 60% 70% 80% 90% 100%
Organic Semi-organic Conventional 76,92%
94,74%
73,68%
23,08%
5,26%
26,32%
Own capital
Table 9 Composition of Rice Production and Consumption
Organic Semi organic Conventional
Production (kg)
Rainy 2,834.44 7,712.50 5,688.71
Dry 2,673.33 6,425.00 4,686.47
Average 2,753.89 7,068.75 5,187.59
Consumption (kg)
Rainy 377.22 700.00 673.82
Dry 377.22 700.00 634.41
Average 377.22 700.00 654.12
Percentage
Rainy 13.31 9.08 11.84
Dry 14.11 10.89 13.54
Appendix 1 Cointegrating between Urea Real Price and Paddy’s Production Date: 09/26/14 Time: 14:16
Sample (adjusted): 2005M04 2010M12 Included observations: 69 after adjustments Trend assumption: Linear deterministic trend Series: PRODUCTION UREAPRICE Lags interval (in first differences): 1 to 2
Unrestricted Cointegration Rank Test (Trace)
Hypothesized Trace 0.05
No. of CE(s) Eigenvalue Statistic Critical Value Prob.**
None * 0.351287 31.90612 15.49471 0.0001
At most 1 0.029207 2.045302 3.841466 0.1527
Trace test indicates 1 cointegrating eqn(s) at the 0.05 level * denotes rejection of the hypothesis at the 0.05 level **MacKinnon-Haug-Michelis (1999) p-values
Unrestricted Cointegration Rank Test (Maximum Eigenvalue)
Hypothesized Max-Eigen 0.05
No. of CE(s) Eigenvalue Statistic Critical Value Prob.**
None * 0.351287 29.86082 14.26460 0.0001
At most 1 0.029207 2.045302 3.841466 0.1527
Max-eigenvalue test indicates 1 cointegrating eqn(s) at the 0.05 level * denotes rejection of the hypothesis at the 0.05 level
**MacKinnon-Haug-Michelis (1999) p-values
Unrestricted Cointegrating Coefficients (normalized by b'*S11*b=I):
PRODUCTION UREAPRICE
-1.66E-05 0.000526
-1.21E-06 -0.004974
Unrestricted Adjustment Coefficients (alpha):
D(PRODUCTION) 56202.72 3062.395
D(UREAPRICE) -21.73997 14.36698
1 Cointegrating Equation(s): Log likelihood -1282.857
Normalized cointegrating coefficients (standard error in parentheses)
PRODUCTION UREAPRICE
1.000000 -31.60596
(51.4710)
Adjustment coefficients (standard error in parentheses) D(PRODUCTION) -0.934530
(0.16434)
D(UREAPRICE) 0.000361
No Year Month
No Year Month
Urea
Jan 1,072.78 351,364.93 37
2008
Jan 890.77 300,435.77
2 Feb 1,046.11 347,390.33 38 Feb 880.22 531,520.99
3 Mar 1,112.30 456,923.72 39 Mar 885.99 421,633.00
4 Apr 1,019.33 334,035.32 40 Apr 894.53 167,451.76
5 May 1,017.09 215,915.51 41 May 897.20 176,752.65
6 Jun 1,091.97 264,725.28 42 Jun 887.33 253,596.59
7 Jul 1,114.65 245,797.76 43 Jul 876.99 192,310.67
8 Aug 1,105.50 262,057.90 44 Aug 869.20 272,028.78
9 Sep 1,021.93 261,026.17 45 Sep 867.18 337,581.32
10 Oct 986.40 220,788.94 46 Oct 894.71 200,839.46
11 Nov 898.53 217,756.67 47 Nov 880.80 181,626.25
12 Dec 874.75 270,072.63 48 Dec 832.21 304,956.79
13
2006
Jan 888.33 305,616.24 49
2009
Jan 1,213.93 327,218.93
14 Feb 883.93 381,572.37 50 Feb 1,218.59 502,526.27
15 Mar 879.87 298,308.58 51 Mar 1,267.14 482,904.34
16 Apr 883.99 223,308.04 52 Apr 1,264.66 187,289.85
17 May 881.23 253,157.24 53 May 1,242.80 180,669.62
18 Jun 902.20 206,081.93 54 Jun 1,242.80 257,545.92
19 Jul 896.14 145,462.07 55 Jul 1,234.88 270,212.49
20 Aug 902.79 246,698.51 56 Aug 1,217.44 293,410.81
21 Sep 896.99 289,021.50 57 Sep 1,197.87 351,073.77
22 Oct 888.52 222,834.51 58 Oct 1,224.11 197,348.73
23 Nov 875.44 141,166.21 59 Nov 1,204.61 166,754.30
24 Dec 851.79 294,400.93 60 Dec 1,195.00 310,801.52
25
2007
Jan 791.32 259,299.50 61
2010
Jan 1,178.46 309,888.91
26 Feb 788.27 430,716.29 62 Feb 1,175.28 549,882.99
27 Mar 805.02 404,123.81 63 Mar 1,184.54 516,682.47
28 Apr 796.78 293,614.20 64 Apr 1,499.36 146,744.01
29 May 772.71 223,456.90 65 May 1,537.42 187,307.13
30 Jun 1,217.74 172,840.22 66 Jun 1,508.75 261,284.37
31 Jul 1,203.26 225,898.94 67 Jul 1,490.57 222,354.23
32 Aug 1,210.54 280,707.56 68 Aug 1,496.86 313,843.16
33 Sep 1,205.71 315,139.79 69 Sep 1,482.60 345,728.76
34 Oct 1,208.44 186,795.94 70 Oct 1,481.00 236,633.20
35 Nov 1,194.45 205,313.60 71 Nov 1,459.09 209,205.04
