Refer to Important disclosures in the last page of this report
Stock DataTarget price (Rp) Rp2,900
Prior TP (Rp) Rp3,075
Share price (Rp) Rp2,180
Upside/downside (%) +33.0
Shares outstanding (m) 10,590
Market cap. (US$ m) 1,520
Republic of Indonesia 60.0%
Estimate Change; Vs. Consensus
2018F 2019F PT Indo Premier Sekuritas [email protected] +62 21 5793 1168
Slowing profit growth as rate rises
9M18 profit up 12%, still within our expectation, despite rising rates.
Surprisingly resilient 3Q NIM (+53bps) mitigated provisioning jump.
PSAK 71 implementation led to our higher credit cost assumption.
We lower our earnings and TP (to Rp2,900) but keep BUY rating.
Modest results.
BBTN’s net profit of Rp2.23tn in 9M18 (+11.5%) was still within
our expectation, despite accounting for only 66% of our FY18F forecasts, given its
usually stronger 4Q earnings. Quarterly profit was up 10% qoq in 3Q18, despite a
doubling of loan provisioning, driven by the bank’s strong core profit growth in 3Q
(+27% qoq). Excluding provisions, which increased by 45% yoy, BBTN’s core
profit grew robustly by 19% in 9M18, which was by far the strongest core profit
growth in Indonesia’s banking industry, driven by: 1) strong asset growth (loans:
+19%; deposits: +16%); and 2) resilient NIMs (only -15bps) in the face of rising
rates, and despite its strong operating cost growth (+18%).
Resilient NIMs
. In our calculation, BBTN’s NIM widened to 4.55% in 3Q (2Q:
4.02%; 1Q: 3.89%), which was above its 2017 levels, surprisingly in light of the
bank’s mostly fixed-rate lending and weak deposit franchise. BBTN’s rising asset
yields in 3Q (+67bps qoq) outpaced its cost of funds (+12bps only). However, we
still assume NIMs to narrow to 4.03% in FY18F (-49bps yoy) and to decline by
10bps each year in next 2 years. We expect NIM pressure to be mitigated by new
subsidy schemes such as KPR SSB (interest subsidy is linked to 12mth SBI rate)
and new KPR FLPP scheme (with funding ratio of 75%:25%), which should lower
BBTN’s vulnerability to rising rates while also lowering opex growth.
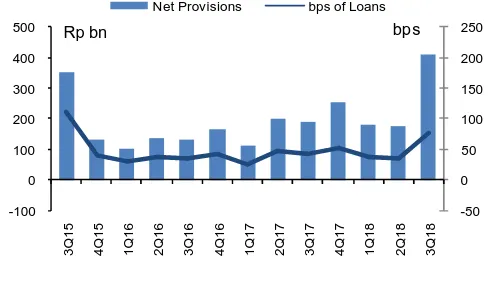
Asset quality
. BBTN’s asset quality was stable with NPL of 2.65% and provision
coverage of 46%, which was above its comfort level of 35-40%. In spite of this,
the bank doubled its credit cost to 83bps in 3Q (2Q: 41bps) in anticipation of a
provision gap arising from implementation of new accounting rule PSAK 71 (vs.
PSAK 55 used at present), which if directly adjusted in equity capital would lower
capital adequacy ratio by 1.5% (CAR was 18% in 3Q18). As such, we increase our
annual credit cost assumption by 10bps to 50bps for FY18F to FY20F as we expect
the bank to cover most of the provisioning gap under PSAK 71 through direct
adjustments to its equity and only partially by increasing provisioning.
Valuation
. We cut our earnings forecasts by 3-5% for FY18-20F, due to higher
provisioning assumption, and lower our TP to Rp2,900 (from Rp3,075). Our TP is
based on GGM-derived target FY18F P/B of 1.26x, assuming LT ROAE of 13.5%
(from 13.8%), LT growth of 8.5%, cost of equity of 12.5%. We estimate LT ROAE
based on DuPont analysis, assuming LT ROAA of 1.13% and asset/equity leverage
of 12x. However, we maintain our BUY rating given the stock’s low valuation.
Bank Tabungan
(
BBTN IJ
)
26 October 2018
Results Note
BUY
(Unchanged)
Year To 31 Dec 2016A 2017A 2018F 2019F 2020F
Operating income (RpBn) 9,268 10,805 12,116 13,698 15,616
PPOP (RpBn) 3,881 4,637 5,027 5,737 6,670
Source: BBTN, IndoPremier Share Price Closing as of : 25-October-2018
2
Refer to Important disclosures in the last page of this report
Fig. 1: Net Interest Income (Rp bn) and NIMs (%) Fig. 2: Non-Interest Income (Rp bn; % of Gross Income)
Source: Company, IndoPremier Source: Company, IndoPremier
Fig. 3: Operating Expense (Rp bn) and Cost/Income Ratio (%)
Fig. 4: Pre-Provision Profit (Rp bn; % of Average Assets)
Source: Company, IndoPremier Source: Company, IndoPremier
Fig. 5: Net Loan Provisioning (Rp bn; bps of Average Loans) Fig. 6: Net Profit (Rp bn) and ROAA (%)
Source: Company, IndoPremier Source: Company, IndoPremier
0%
Net Interest Income Net Interest Margin
Rp bn
Other Income Other Income % of Total
Rp bn
Operating Expenses Cost-Income Ratio
Rp bn
Pre-Provision Profit Pre-Provision Profit ROAA
Rp bn
Net Provisions bps of Loans
bps
Net Profit Net Profit ROAA
3
Refer to Important disclosures in the last page of this report
Third-Quarter 2018 Results
Results (Rp Bn) 9M18 9M17 % Y-Y 3Q18 2Q18 % Q-Q
Customer Deposits 194,830 167,870 16.1 194,830 186,640 4.4
Non-Performing Loans (NPL) 5,825 5,672 2.7 5,825 5,876 -0.9
Special Mention Loans 22,593 21,589 4.7 22,593 21,127 6.9
Loan Loss Reserves (LLR) 2,710 2,270 19.4 2,710 2,452 10.5
Total Assets 272,305 231,935 17.4 272,305 268,044 1.6
Risk-Weighted Assets 122,323 119,780 2.1 122,323 124,072 -1.4
4
Refer to Important disclosures in the last page of this report
Year To 31 Dec (RpBn) 2016A 2017A 2018F 2019F 2020F
Income Statement
Interest income 17,139 19,272 22,042 26,670 31,346
Interest expense (8,975) (9,931) (11,668) (14,949) (17,985)
Net interest income 8,164 9,341 10,374 11,721 13,361
Fees and commissions 591 750 1,000 1,200 1,440
Trading income 282 403 400 400 400
Other operating income 231 311 342 377 414
Total operating income 9,268 10,805 12,116 13,698 15,616
Personnel expenses (2,122) (2,554) (3,014) (3,376) (3,781)
G&A expenses (2,466) (2,953) (3,307) (3,704) (4,149)
Other operating expenses (799) (661) (768) (880) (1,016)
Pre-provision operating profit 3,881 4,637 5,027 5,737 6,670
Provisions (708) (884) (1,086) (1,276) (1,494)
Current account with BI 10,697 12,555 14,472 17,100 20,215
Placements at BI & other banks 17,903 25,254 17,326 22,834 28,924
Short-term investments 4,172 7,706 13,871 15,258 16,784
Government bonds 9,244 8,184 8,184 8,184 8,184
Gross loans 164,446 198,991 235,274 275,257 322,311
Loan provisions (2,116) (2,356) (2,742) (3,418) (4,312)
Other assets 8,816 10,005 10,763 11,586 12,478
Total Assets 214,168 261,365 298,261 348,116 406,138
Customer deposits 159,988 192,474 222,639 263,082 311,000
Deposits from other banks 3,653 5,445 5,990 6,589 7,248
Securities and borrowings 24,304 32,856 37,347 42,187 47,196
Other liabilities 6,595 7,289 8,017 8,819 9,701
Total Liabilities 194,539 238,064 273,994 320,678 375,145
Share capital 7,349 7,349 7,349 7,349 7,349
Reserves and others 2,773 2,802 2,724 2,824 2,824
Retained earnings 9,008 11,512 14,194 17,265 20,820
Shareholders' equity 19,131 21,663 24,267 27,438 30,993
Minority interest 0 0 0 0 0
Total Liabilities & Equity 213,670 259,727 298,261 348,116 406,138
5
Refer to Important disclosures in the last page of this report
Year To 31 Dec 2016A 2017A 2018F 2019F 2020F
Growth Ratios (% yoy)
Gross loans 18.3 21.0 18.2 17.0 17.1
Total assets 24.7 22.0 14.1 16.7 16.7
Customer deposits 25.3 20.3 15.7 18.2 18.2
Net interest income 19.9 14.4 11.1 13.0 14.0
Non-interest income 23.3 32.6 19.0 13.4 14.0
Total operating income 32.3 16.1 5.6 13.4 15.3
Operating expense 20.0 14.5 14.9 12.3 12.4
PPOP 20.7 19.5 8.4 14.1 16.3
Net profit 41.5 15.6 8.6 13.4 15.3
Profitability Ratios
ROAA (%) 1.38 1.33 1.17 1.15 1.14
ROAE (%) 15.7 15.1 14.3 14.4 14.7
NIM (%) 4.71 4.52 4.03 3.93 3.83
Credit cost (bps) 35.4 41.8 42.2 42.2 43.3
Cost/income (%) 58.1 57.1 58.5 58.1 57.3
LDR (%) 102.8 103.4 105.7 104.6 103.6
CAR (%) 20.3 18.9 17.9 17.2 16.5
NPL ratio (%) 2.8 2.7 2.3 2.1 2.0
Provisions/NPL (%) 45.3 44.6 50.4 58.4 66.8
Head Office
PT INDO PREMIER SEKURITAS
Wisma GKBI 7/F Suite 718
Jl. Jend. Sudirman No.28
Jakarta 10210 - Indonesia
p +62.21.5793.1168
f +62.21.5793.1167
INVESTMENT RATINGS
BUY : Expected total return of 10% or more within a 12-month period HOLD : Expected total return between -10% and 10% within a 12-month period SELL : Expected total return of -10% or worse within a 12-month period ANALYSTS CERTIFICATION.
The views expressed in this research report accurately reflect the analyst;s personal views about any and all of the subject securities or issuers; and no part of the research analyst's compensation was, is, or will be, directly or indirectly, related to the specific recommendations or views expressed in the report.
DISCLAIMERS