34
This chapter discusses the research method that includes research design, population and sample, instrument of the study, instrument try out, validity, reliability, index of difficulties, data collection, and data analysis.
A. Research Type
This study is classified into quantitative research where, according to Ary et al., it deals with question of relationship, cause and effect, or current status that writer can answer by gathering and statistically analyzing numeric data. It can be divided into experimental and non-experimental.1 Meanwhile Aliaga and Gunderson in Muijs states quantitative research is a research which explains phenomena by collecting numerical data that are analyzed using mathematically based method (in particular statistics).2
B. Research Design
The design of the study were Ex-post Facto research. The study used quantitative comparative approach. Ex-post Facto is conducted after variation in the variable of interest has already been determined in the natural course of events. This method is sometimes called causal comparative because its purpose is to investigate cause-and-effect
1
Donals Ary, et.al., Introduction to Research in Education, Eight Edition, USA: Wadsworth, Cengage Learning, 2010, p.39
2
relationships between independent and dependent variables.3 One of step in an ex post facto study is to select two or more groups to be compared, it was the study which compare the reading comprehension strategies between good and poor readers at the second year students of MAN Model Palangka Raya , in order to find similarities and the differences. The writer found of casual-effect based relationship or casual comparative research (Ex-post facto research). In relationship to this, Kerlinger in Khalid defines Ex-post Facto research as: “Systematic emperical inquiry in which the scientist does
not have direct control of independent valiables because their manifestations have already occurred or because they are inherently not manipulable.”4
In this study the writer took the second year students of MAN Model Palangka Raya as subject of the study. The subject were divided into two groups based on the students’s proficiency. They were good and goor
readers. Then the two groups were tested to know the differences on their Reading Comprehension Strategies.
C. Population and Sample
1. Population
The population is the group of people who want to generalise to.5 According to Ary population is all members of any well-defined class of people, events, or objects.6
3
Donals Ary, et.al., Donals Ary, et.al., Introduction to Research in Education, Eight Edition, USA: Wadsworth, Cengage Learning, 2010, p.332
4
Marzuki, B Khalid. Research Methodology (Overview of Research and its Methodologies), Module 1, mLaysia:University Teknology Malaysia, p. 22
5
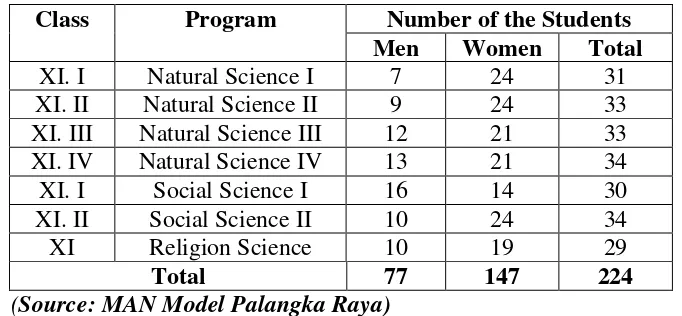
In this study, the population is students in the second year of MAN Model Palangka Raya academic year 2013/2014. Those are 7 groups of learners, they were: 4 Natural Science classes, 2 Social Science classes and 1 Religion Science. The number of population of the students can be seen on the table:
Table 3.1
The Population Number of The Second Year Students Of MAN Model Palangka Raya Academic Year 2013/2014
Class Program Number of the Students
Men Women Total
XI. I Natural Science I 7 24 31 XI. II Natural Science II 9 24 33 XI. III Natural Science III 12 21 33 XI. IV Natural Science IV 13 21 34 XI. I Social Science I 16 14 30 XI. II Social Science II 10 24 34
XI Religion Science 10 19 29
Total 77 147 224
(Source: MAN Model Palangka Raya)
2. Sample
According to Ary, et al., sample is a small group that is observed which is a portion of a population.7 In this study the samples were taken using purposive sampling, because the samples of this study were taken based on the certain purpose.
In the study, all students of the second year of MAN Model Palangka Raya gived reading comprehension test. Based on the test score,
6
Donals Ary, et.al., Donals Ary, et.al., Introduction to Research in Education, Eight Edition, USA: Wadsworth, Cengage Learning, 2010. p.148
7Ibid.
they were selected into two group as the sample namely, high score students as good readers and low score students as poor readers in order to be given questionnaire to investigate they reading strategies. Specifically, it can be seen in this following table:
Table 3.2
Classification of the Students Based on Their Proficiency Level
Background Number %
Group Good readers Poor readers
40 40
50,00 50,00
Total 80 100,00
D. Instrument of the Study
According to Ary, et al., instrument is a device for operationally defining a variable.8 Selecting appropriate and useful measuring instruments in critical to the success of any research study. One must select or develop scales and instruments that can measure complex constructs such as intelligence, achievement, personality, motivation, attitudes, aptitudes, interests, and self-concept.9
In this study, the data collection was conducted while the students in the second year. The data is needed to prove and support this study. By this collecting data, the writer can compare the the reading comprehension strategies used between good readers and poor readers at the second year students of MAN Model Palangka Raya. There are two instruments were used in this study, namely, test and questionaire.
8
Donals Ary, et.al., Donals Ary, et.al., Introduction to Research in Education, Eight Edition, USA: Wadsworth, Cengage Learning, 2010, p. 643
1. Test
To measure students’ reading comprehension ability in this study, the
writer used a test. According Ary, et al., a test is a set of stimuli presented to an individual in order to elicit responses on the basis of which a numerical score can be assigned. This score, based on a representative sample of the individuals behavior, is an indicator of the extent to which the subject has the characteristic being measured.10
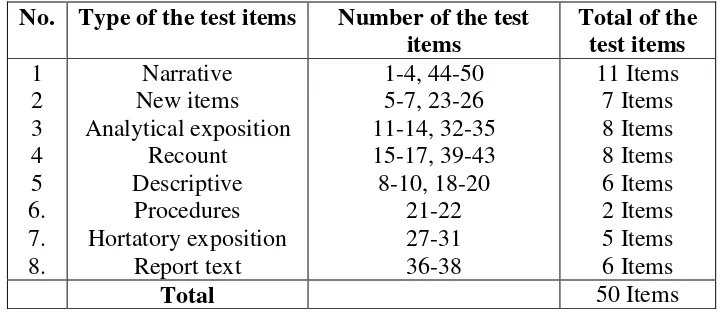
To find out the level ability of the second year students in reading comprehension, test used to measure their level ability. All students gave the test to select as the sample. The test was constructed in the form of multiple choices which consisted of 50 items test. If the students’ answer is right, the
score given is 1 (one). If the students’ answer wrong, the score given is 0 (zero). (see appendix 3)
Table 3.3
The Content Specification of Test Items
No. Type of the test items Number of the test items
Total of the test items 1 2 3 4 5 6. 7. 8. Narrative New items Analytical exposition Recount Descriptive Procedures Hortatory exposition Report text 1-4, 44-50 5-7, 23-26 11-14, 32-35 15-17, 39-43 8-10, 18-20 21-22 27-31 36-38 11 Items 7 Items 8 Items 8 Items 6 Items 2 Items 5 Items 6 Items
Total 50 Items
10
Level of Comprehension:
With literal level questions, readers are asked to identify facts that are explicitly stated in the text. At the inferential level, readers make meaning from the text including meanings of unfamiliar words using context, drawing conclusions, and inferring. Finally, at the critical level, readers identify patterns of organization and the author’s purpose and bias.
Criteria: Students will show improvement as follows: -80% improvement in literal reading.
-70% improvement in inferential reading -50% improvement in critical reading
2. Questionnaire
A questionnaire is used in this study to measure the students reading comprehension strategies. According to Ary, et al., questionnaire is an instrument in which respondents provide written responses to questions or mark items that indicate their responses.11
The people who are expected to give responses is called respondents. To acquire data needed, questionnaire is distributed to respondent. Since questionnaire, as Dornyei notes, can yield three types of data about the respondent: factual, behavior and attitudinal.12 To measure behavioral data, the writer will use likert scale type-questionnaire where the options are
11
Donals Ary, et.al., Donals Ary, et.al., Introduction to Research in Education, Eight Edition, USA: Wadsworth, Cengage Learning, 2010, p. 648
12
concerning with frequency, such as always, often, sometimes, seldom and never.
Scales are used to measure attitudes, values, opinions, and other characteristics that are not easily measured by tests or other measuring instruments. A scale is a set of categories or numeric values assigned to individuals, object, or behavior for the purpose of measuring variables. The likert scale, is one of the most widely techniques to measure attitudes. A likert scale assesses attitudes toward a topic by presenting a set of statement about the topic and asking respondents.13
Reading strategy questionnaire was designed to investigate reading comprehension strategy use. The thirty reading strategy questions were adapted from Pratin Pimsarn in Language Institute Journal ESL Readers at the Graduate Level. The attitudinal scale, a five point categorical scale, was
designed to measure reading strategies in three stages: before reading, while reading and after reading. The questionnaire has two main parts. In the first section, respondents need to write the name of their class. The second part is the reading strategy questions. Respondents asked to tick a statement which best describes their frequency of strategy use. The questionnaire was distributed to collect quantitative data of learner’ strategy use. (see items of
questionnaire in appendix 9)
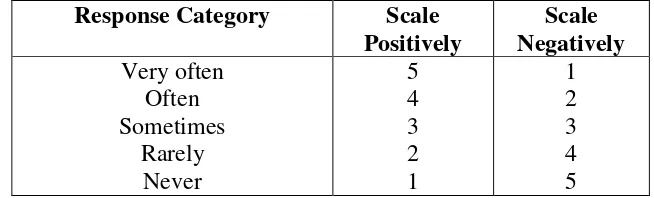
To score the scale, the response categories must be weighted. For favorable or positively stated items. Always is scored 5, often scored is 4,
13
sometimes is scored 3, seldom scored 2, and never scored 1. For unfavorable or negatively statements, never would receive a weight or score of 1 and always a weight of 5.
Table 3.4
Respondents categories and the score of item
Response Category Scale
Positively
Scale Negatively
Very often Often Sometimes
Rarely Never
5 4 3 2 1
1 2 3 4 5
The sum of the weights of all the items checked by the subject is the individual’s total score. The highest possible scale score is 5 x N (the
number of items); the lowest possible score is 1 x N.
After administering the attitude scale to a preliminary group of respondents, the researcher does an item analysis to identify the best funtioning items. The item analysis typically yields three statistics for each item : (1) an item discrimination index, (2) the percentage of respondents marking each choice to each item, and (3) the item mean and standard deviation.
E. Instrument Try Out
the instrument quality that consist of instrument validity, instrument reability and index of difficulty. There were some procedures done by the writer in carrying out the try out as follow:
1. The writer prepared the test instrument
2. The writer gave try out to the respondents, they are the third year students of MAN Model Palangka Raya
3. The writer collected the answers and gave score to the respondents 4. The writer calculated the result of the test
5. The writer analyzed the data obtained to know the instrument validity, instument reliability, and index of difficulty.
6. After the writer knew that there were 18 invalid items and 32 valid items, the writer revised the invalid items to be tested for the real sample (see the result of try out test on Appendix 11,12 and 13)
F. Research Instrument Validity
A valid or measure is one which measures what it is intended to measure. Validity must always be examined with respect to the use which is to be made of the values obtained from the measurement procedure.14
1. Content Validity
Content validity is concerned with what goes into the test. A test will have high content validity if the items are representative of the population of possible task. The content of a test should be decide by
14
considering the purpose of the assessment and then drawn up as a list known as a content specification.15
The instrument must be valid in its content. It means that the items in the instrument are equal and proportional in their distribution as the indicators of the test.
2. Construct Validity
According to Heaton construct validity assumes the existence of certain learning theories and constructs underlying the acquisition of abilities and skills. A test with construct validity is capable to measure certain specific characteristics in accordance with theories of language behavior or language learning. 16
The validity test is done in order to know the degree of the validity of the test items based on the coefficient correlation. To find the validity of test, the formula used is:17
∑ ∑ ∑
√{ ∑ ∑ }{ ∑ ∑ }
Where:
Rxy : The coefficient correlation
∑X : Total Value of Score X ∑Y : Total Value of Score Y
15
Tinambunan, Wilmar, Education of students’s achievement. Jakarta: Depdikbud, 1998. P.12
16
JB. Heaton, Language, p. 14 17
∑XY : Multiplication Result between score X and score Y
N : Number of students
To know the validity level of the instrument, the result of the test was interpreted to the criteria or the correlation index as follows: 0,800 – 1,00 = very high validity
0,600 – 0,799 = high validity
0,400 – 0,599 = fair validity 0,200 – 0,399 = poor validity 0,000 – 0,199 = very poor validity18
In the measurement of validity, the criteria are:
a. If the value of robserved is greater than rtable, the instrument is valid.
It means the instrument can be used.
b. If the value of robserved is lower than rtable, the instrument is invalid.
It means the instrument can be used
c. The value of r table can be seen at alpha = 5% and df = n-1. Df 28-1 = 27 = 0,374
From the measurement of validity, it was known that there were eighteen items (36%) invalid. They were item number 3 (-0.02), 6 (0,116), 7 (-0,02), 8 (0,229), 9 (0,151), 11 (-0,19), 13 (0,334), 14 (0,043), 15 (-0,003), 19 (0,08), 31 (-0,24), 32 (0,067), 37 (0,171), 38 (0,086), 39 (0,063), 40 (0,074), 43 (-0,34), and 50 (-0,328. The other valid items were 32 items (64%).
18
According to Djiwandono test item can be (1) defended because it met the criteria of a good test, (2) revised the formulation based on the result of conducted study, (3) removed of the problem found is deep or need too many revising.19 Therefore, in this study the writer revised the invalid items. Further detail of validity measurement is shown in (the Appendix 12)
G. Research Instrument Reliability
The good instrument in a study is not only the instrument valid but also reliable to measure what suppose to be mesured.
Reliability is a necessary characteristic of any good test for be valid at all, a test must first be reliable as a measuring instrument. Reliability is of primary importance in the use of both public achievement and proficiency test and classroom test. 20
The writer examined the reliability of the item by using Spearman Brown formula:
⁄ ⁄
⁄ ⁄
Based on the measurement of reliability above, it was known that the coefficient of reliability = 0,822. It meant that robserved of reliability was
19
Soenardi Djiwandono, Tes Bahasa, Jakarta: PT Indeks, 2008, p. 228 20
greater than rtable (0,822 > 0,374). Therefore, the instrument was reliable and
could be used (see appendix 13 )
H. Index of difficulties
Index of difficulty is used to know how difficulty or easy of the test items are. To know the level of difficulty of test, the formula used is:
F.V : Facility Value
R : Represent the number of correct answer N : The number of the students taking the test
It will be classified as : F.V. 0,00 – 0,33 = Difficult F.V. 0,30 – 0,17 = Fair
F.V. 0,70 – 1.00 = Easy
After the writer calculated the index of difficulties of the test instrument, it was gotten the number of fair items= 38 items (76%), easy items = 6 items (12%), and difficult items = 6 items (12%). The table of index of difficulties is shown in (the Appendix 11)
I. Data Collection Procedures
1. The writer observed the class 2. The writer determined the class
3. The writer gave the test item of reading comprehension to the students of the second year
4. The writer select the second year students into two groups based on the score namely high score students as good readers and low score students as poor readers
5. The writer gave the questionnaire to know their strategies in reading comprehension to the students of good readers and poor readers 6. The writer analyzed the obtained data from the questionnaires. The
form of data descriptive statistic namely reading comprehension strategies used by good readers and poor readers at the second years students of MAN Model Palangka Raya.
7. The writer analyzed the obtain data using t-test 8. The writer interpreted the analysis result
J. Data Analysis Procedures
After collecting the quantitative data on the two variables for each of the students in the sample, the writer analyzed the data by applying some procedure as follows:
1. Calculating the students’ score in reading comprehension test with the formula :
Where:
S : Students score in reading comprehension test B : Sum of the correct answers
N : Sum of Items
2. Classifying the score of the students’ good reader and poor reader in reading comprehension test.
Table 3.5
Standard valuation score
Nilai Angka Predikat
80 – 100 70 – 80
60-70 50 – 60
0 – 50
Very high high
3. To quantify the students’ score in the questionnaire, the writer would sum the quantitative data of the questionnaire by using formula :
∑ ∑
Where :
S : Students’ score in the questionnaire ∑ X : Total score of answers
∑ P : Total of items
4. Calculating Mean score of the students from the questionnaire by using formula:
∑
Where :
Mx : Mean value
∑x : Sum of each midpoint times by it frequency
N : Number of case.21
5. Calculating Standard Deviation score of the students from the questionnaire by using formula:
√∑
Where :
SD : Standard Deviation
21
∑fx2
: sum of the multiplication result between each skor frequency with the squared deviation score
N : Number of case. 22
6. The writer would show tables to analyze data obtained from the questionnaires. Descriptive statistics employed in calculation process are arithmetic mean, standard deviation, frequency and percentages. Data presents the reading comprehension strategies used by good reader and poor reader at the second years students
7. The writer would determine the hypothesis with the formula:
Where :
to : Result of observation
Mx : Mean of variable 1
My : Mean of variable 2
SE : Standard Error
8. The writer compared the result of both classes to answers the hypothesis of this study by using the result of calculation t-test (to) and
ttable (tt) with criteria:
If to > tt (the level of significance 5 % meant Ha is received.
If to < tt meant Ha is refused and Ho is received.23
22
Anas Sudijono. Pengantar Statistik Pendidikan, Jakarta: PT. Raja Grafindo Persada, 2005, p. 181
23Ibid
The writer used t-test to conclude the answer of the problem of the study.
1. If the tobserved is equal or higher than t value in the table (with
ttable sign), so the null hypothesis stating that there is no mean
difference from the both sample is rejected. It meant the different is significant.
2. If the tobserved os lower than ttable, it means the null hypothesis
stating that there is no mean difference from the both sample is accepted. It meant the difference is not significant.