Empirical Bayesian Method for
the Estimation of Literacy Rate at Sub-district
Level Case Study: Sumenep District of
East Java Province
A.Tuti Rumiati1, Khairil Anwar Notodiputro2, Kusman Sadik2, and I Wayan Mangku3
AbstractThis paper discusses Bayesian Method of Small Area Estimation (SAE) based on Binomial response variable. SAE method being developed to estimate parameter in small area due to insufficiency of sample. The case study is literacy rate estimation at sub-district level in Sumenep district, East Java Province. Literacy rate is measured by proportion of people who are able to read and write, from the population of 10 year-old or more. In the case study we used Social Economic Survey (Susenas)data collected by BPS. The SAE approach was applied since the Susenas data is not representative enough to estimate the parameters at sub-district level because it’s designed to estimate parameters in regional area (in scope of a district/city at minimum). In this research, the response variable being used was logit function trasformation of pi (the parameter of Binomial distribution). We applied direct and indirect approach for parameter
estimation, both using Empirical Bayes approach. For direct estimation we used prior distribution of Beta distribution and Normal prior distribution for logit function (pi) and to estimate parameter by using numerical method, i.e integration
Monte Carlo. For indirect approach, we used auxiliary variables which are combinations of sex and age (which is divided into five categories). Penalized Quasi Likelihood (PQL) was used to get parameter estimation of SAE model and Restricted Maximum Likelihood method (REML) for MSE estimation. Instead of Bayesian approach, we are also conducting direct estimation using classical approach in order to evaluate the quality of the estimators. This research gives some findings, those are: Bayesian approach for SAE model gives the best estimation because having the lowest MSE value compares to the other methods. For the direct estimation, Bayesian approach using Beta and logit Normal prior distribution give a very similar result to the direct estimation with classical approach since the weight of is too large, which is about 0.905. It is also found that direct estimation using Bayesian approach with the Beta prior distribution gives better MSE than using logit normal prior distribution.
KeywordsSAE model, Bayesian approach, Binomial response, Monte Carlo integration, literacy rate
AbstrakPaper ini membahas metode pendugaan area kecil (Small Area Estimation: SAE) berbasis sebaran respon Binomial Metode SAE digunakan untuk pendugaan area kecil dimana jumlah contoh tidak cukup representatif untuk pendugaan area kecil tertentu. Studi kasus yang diambil adalah pendugaan angka melek huruf di wilayah kecamatan di Kabupaten Sumenep, Jawa Timur berbasis data Survai Ekonomi Nasional (Susenas) oleh BPS (2010). Susenas dirancang untuk pendugaan parameter di wilayah regional (minimal Kabupaten/kota) dan tidak cukup representatif untuk pendugaan parameter level kecamatan oleh karena itu digunakan pendekatan Metode SAE. Model SAE yang dibahas dalam penelitian ini menggunakan peubah respon fungsi logit (pi) yang merupakan transformasi logit dari parameter Binomial pi. Pendugaan parameter model
SAE menggunakan Maximum Likelihood Estimator (MLE) dan pendugaan MSE menggunakan metode Restricted Maximum Likelihood (REML). Pendugaan parameter area kecil menggunakan pendekatan Bayes Empirik yaitu dengan mengaplikasikan integrasi numerik menggunakan metode Monte Carlo. Untuk membandingkan kualitas penduga, selain model SAE juga dilakukan pendugaan langsung melalui pendekatan klasik dan melalui pendekatan Bayes yang menggunakan sebaran prior Beta dan sebaran normal untuk fungsi logit (pi). Dalam studi kasus digunakan peubah respon angka melek huruf yang diukur
dari proporsi penduduk berusia 10 tahun ke atas yang bisa baca tulis, sedangkan peubah pembantu merupakan kombinasi antara jenis kelamin dan usia. Pengembangan model SAE menggunakan data Susenas 2010 dan untuk pendugaan area kecil digunakan data sensus penduduk tahun 2010. Dari penelitian ini diperoleh hasil bahwa pendugaan parameter menggunakan model SAE melalui pendekatan Bayes memberikan nilai pendugaan yang paling baik karena memiliki nilai MSE terendah dibandingkan metode lainnya. Metode pendugaan langsung enggunakan pendekatan Bayes memberikan hasil yang hampir sama dengan pendugaan klasik karena bobot untuk terlalu besar yaitu sekitar 0,905. Nilai MSE untuk pendugaan Bayes menggunakan sebaran prior Beta sedikit lebih baik dibandingkan dengan menggunakan sebaran prior logit normal.
Kata KunciModel SAE, pendekatan Bayes, peubah respon Binomial, integrasi Monte Carlo, angka melek huruf
I.INTRODUCTION1
mall Area Estimation (SAE), whereas the estimation method is model based, has been developed and used to estimate the small area parameters if the numbers of
1
A. Tuti Rumiati is with Department of Statistics, FMIPA, Institut Teknologi Sepuluh Nopember, Surabaya, 60111, Indonesia. E-mail: [email protected]
Khairil Anwar Notodiputo and Kusman Sadik are with Department of Statistics, FMIPA, Institut Pertanian Bogor, Bogor, Indonesia.
I Wayan Mangku is with Department of Mathematics, FMIPA, Institut Pertanian Bogor, Bogor, Indonesia.
data from a certain small area are not representative enough to represent the population [1].
The problem of insufficiency data is found in most cases of small area estimation because most of many surveys are designed for larger area (regional or national scale).
In Indonesia, problems of insufficiency data for parameters estimation in small areas (sub-district or village) are also found. For example, if the estimation of small area is using the survey which are designed for national or regional scale (province to district/city) like National Sosial Economy Survey (Susenas) [2].
One of the purposes of Susenas is to estimate Human Development Index (HDI), which is measuring the impact of regional development. HDI is measured in 3 basic dimensions, i.e. education component, health component and decent living standard which is measured by the purchasing capability [3]. Particularly for education component, literacy rate and average length of school period in a certain area are used to measure Education Index. The literacy rate is measured by reading and writing skill at 10-year-old-and-older
people’s. The Variable of Reading and writing skill is a binary variable.
SAE model for binary response variable has been developed by some researchers, such as SAE model applied to survey data in health sector which is based on combination of unit and area using hierarchical Bayesian approach [4], Empirical Bayesian method for binary data for small area estimation [5], SAE model estimation for binary data with Bayesian empirical and hierarchical estimation method [6], SAE model for proportion in business survey [7] and SAE for proportion estimation about labor (working, non-working, and non-working labor force) in Australia [8].
In this research we discuss about SAE model using Bayesian approach based on Binomial response variable. For the case study, we estimate literacy rate at small area (sub district) level based on Susenas data. Literacy rate, which is assumed to have a Binomial distribution with pi parameter, was measured by the number of
people of 10-year-old-or-older who can read and write. Evaluation of quality estimators is done by comparing MSE estimation. To compare the quality of estimators, we also conducting direct estimation with classical and Bayesian approach using prior Beta distribution and logit normal distribution.
II.METHOD
Supose yij is defined as reading and writing ability of
each individual in the population, which is a binary response variable. yij variable is assumed having
Bernoulli distribution with pi parameter, where yij=1 or 0
with the function of probability distribution as follows:
) (
|
~
iind i
ij p Bernoullip
y ,
where, j=1,2,…,ni; i=1,2,…,m
Small Area parameter to be estimated is small area proportion:
i N
j ij i
i Y y N
p i /
1
, whereas Ni is number
of population in the ith area. The sample proportion for
the ith area is n i i
j ij i
i y n y n
pˆ i / /
1
, while
i n j ij i y y 1 has
Binomial distribution with ni and pi parameters. The
probability distribution function of yi is:
i i
i n y
i y i i i i
i p p
y n p y
f
(1 )
) | (
(1)
or written as | ~ ( i, i)
ind i
i p Binomial n p
y .
For the classical approach,
i i i j
ij
i y n y n
pˆ
/ / will bethe direct estimator for proportion in the ith area if the sampling selection is using simple random sampling.
Through Bayesian approach, the pi parameter is
considered as a random variable having a certain distribution. Bayesian approach for direct estimation method is based on two kinds of prior distribution, those are: 1) by assuming that pi has Beta distribution with
parameters α and β; and 2) by assuming that logit (pi) = log [pi/(1-pi)] or probit Ф-1(pi) function has Normal
distribution [7]. In this research, the prior used is Beta and logit-Normal distribution.
A. Parameter Estimation Using Beta Prior Distribution
In this case, pi parameter to be considered as a random
variable having Beta distribution with parameters α and
β as the prior:
0 , 0 ); , (
~Beta p
iid i
The probability function of Beta distribution of pi is:
0 , 0 ; ) 1 ( ) ( ) ( ) ( ) , |
( 1 1
i i
i p p
p
f (2)
Where Γ(.)is Gamma function.
Posterior distribution was obtained by deriving conditional distribution of f(pi|yi,α,β) from the joint
probability distribution of f(pi,yi,α,β), which is
multiplication of the Equation 1 and 2.
With known yi, α and β, the posterior distribution of pi
is also as the form of Beta distribution
) , ( ~ , ,
| i i i ind
i
i y beta y n y
p with
probabi-lity distribution function:
) ( ) ( ) ( ) ( ) ( ) ( ) , | ( x n y n y y n y f i i i i i i i (3)
Bayesian estimator of pi and the posterior variance are
given by: i i i i B i n y y p E
pˆ ( , ) ( | , , ) (4)
and, 2 ) )( 1 ( ) )( ( ) , , | ( i i i i i i i n n y n y y p
V (5)
Empirical Bayes estimator for pi is obtained by
replacing α and β with their estimators, and . The estimators of α and β parameter can be found by applying two methods, by maximizing likelihood function or Maximum Likelihood (ML) method and using moment method.
Using ML estimators, ML and ML are obtained by
maximizing likelihood function of l(α,β) from
binomial Beta
y
ind
i|, ~ distribution. Since the
closed-form for ML and ML is not available, the
Newton-Raphson or other iterative methods can be used to obtain parameter estimation of α and β [7].
The estimator for α and β was found by using moment estimator method as follows:
ˆ ˆ ˆ ˆ p (6)
T i i T
p T m n n n p p m p p s n ) 1 ( / ) ˆ 1 ( ˆ ) 1 )( ˆ 1 ( ˆ 1 ˆ ˆ 1 2 2
(7)
p p
p
pˆiEB ˆiB(
ˆ,
ˆ)
ˆiˆi(1
ˆi)ˆ(8) where, i = ni /(ni + + ). As shown in formula (8), the empirical Bayes estimators of pi ( iEB)is the weighted average of . The bigger value of ni, the bigger weight to
be given to the i. The estimation equation as mentioned above is similar to Fay-Heriot estimator for area-based model. iEB estimator is close to unbiased for pi if the
valuae of m is big enough, because E( iEB-pi) will be
close to zero.
To get MSE ( iEB) estimator we used Jackknife method. This method will give unbiased estimator of MSE ( iEB), i.e mse ( iEB) [6] as follows:
i i EB
i M M
p
mse (ˆ ) ˆ1 ˆ2
(9) where,
ml i l l i i i
i i i y g y g m m y g M
1 1 1
1 1 ) , ˆ , ˆ ( , ˆ , ˆ ( 1 ) , ˆ , ˆ ( ˆ (10)
21 , 2 ˆ 1 ˆ m l EB i EB l i
i p p
m m
M (11)
with,
22 1 , ( ˆ ) , , | ( ) , , | ( ) , , ( B i i i i i i i p y p E y p V y g (12) B. Parameter Estimation Using Prior Logit Normal
Distribution
The second method of direct estimation using Bayesian opproach is by applying logit transformation for pi
parameter where logit (pi) is considered has Normal
distribution:
/(1 )
~ ( , )log ) (
logit p p p N
2iid
i i
i (13)
Implementation of Empirical Bayes method for the above model is more complex because there are no analytical forms for pi estimator and posterior variance.
Bayesian estimator of pi, iB (μ,) = E(pi / yi,μ,), can be
defined as ratio between two expectation value [7], as follows:
exp ( , )
) , ( exp ) ( ) , ( ˆ 2 2 1 z y h E z y h z h E p i i B
i
(14) where, i i z z i i e e p z
h
1 ) ( 1 and ) 1 log( ) ( )) ( , ( 2 z i i
i z z y n e
y
h
) 1 , 0 ( ~ N zi
In this research, we calculate the expectation value of nominator and denominator in the Equation 14 by generating z from normal distribution N(0,1) with n=500. For each value of z, the expectation value of each nominator and denominator is calculated using the following formula:
a a
i z x A
y h z h E 500 1 ) , ( exp ) ( 2
1 (15)
aa
i z B
y h
E 2 500
500 1 )
, (
exp (16)
where, 2 2 / 1 2 1 ) 1 log( ) exp( 1 a a a a z z i i a z z a e x e n y z x e e A
exp ( ) log(1 za)
i i a
a z y n e
B x
2 2 / 1 2
1 za
e
The estimator of μ and σ, which is and , can be obtained by applying ML method (by maximizing likelihood function l(μ,) through Newton-Raphson method) or moment method. The EB estimator of pi, iEB = iB ( , ) is obtained by replacing and in equation 14. Posterior variance, V(piyi,μ,), is defined by the following formula:
) , , ( , ( ˆ ) , , | ( ) , , | ( 1 2 2 i i B i i i i i y g p y p E y p V (17) The posterior variance can be calculated as the expectation value from a function of standard normal distribution Z ~ N(0,1).The calculation of mse J( iEB) using ML estimator is quite complicated. For this reason, in this reasearch we prefer to use moment method[7], using formula:
)]
(
[
ˆ
n
E
h
1z
p
n
y
T Ti i
( )
) 1 ( )(y2 y n n Eh12 z
i i i
i i i
(18)
-l and -l are the estimators obtained by deleting the lth area from data.
Variance calculation can be done through Monte Carlo integration to calculate E(pi) = E[h1(μ + z)] and E( )
= E[ (μ + z)].
Moreover the Jackknife estimator of MSE ( iEB) can be obtained through the same method as explained in Equation 9, 10 and 11.
C. Indirect Estimation (Model-based)
Every unit (individual) in the population can be catagorized into different mutually exclusive and exhaustive groups based on demographic status [6]. In this research we use combination of age (consist of 5 groups) and sex to catagorized each unit, therefore those two variables are used as covariates variables and pij is
proportion of literate of of all 10-year-old-or-older people in each combination.
The logit (pij) can be modeled as logistic regression
which relates the logit (pij) to its covariates (xij) with
random area effect:
i T ij
ij x
p )
( logit
, ~ (0, )
2 N iid i (19) The model above is called logistic linear mixed model, which is a part of generalized linear mixed model. The covariate vector is assumed to be independent to the area i.
The proportion of literate people in area-i (pi) is
proportion of all 10-year-old-or-older people in the population which can read and write in any langguages. Thus, pi can be decomposed into 2 components, they are
not to be taken as samples. Mathematically, pi can be
written with the following formula: *
) 1
( i i
i i
i f y f y
p
(20) where,
fi = ni/Ni,
i
yis sample average (proportion) and
) /( ' * i i s l il
i y N n
y
i
is the average of the unit which are
not taken as samples in the ith area.
In Equation 20, is unknown and will be estimated by using Bayesian estimation, that is:
| ,
,
ˆ*
i i B
i E p y
p lsi pil/(Ni ni)
(21) where yi is sample from the ith area and pil = E(yilpil
,yil, β, v) for l∊ s΄i(s΄i are units in population whose are not taken as samples).
Bayesian estimator of is obtained by replacing μ in Equation 13 with the logit function which is formed as linear model of xij,as shown in Equation 19. Thus,
Bayesian estimator of is :
(22) where,
i i i s j T ij i s j ij T ij s j ij T ij i z x y z y x z y x h exp 1 log ) ( , , (23)Bayesian estimator of pi can be defined as:
B i i i i B i B
i p f y f p
pˆ ˆ (,) (1 )ˆ* (24) Parameter estimation for β and model can be done in various ways, including EM algorithm, MCMC, Penalized Quasi-Likelihood (PQL) and moment method [7]. Therefore, EB for pi is iEB = iB ( , ). Since there is no closed form to get the above expectation value, the expectation value calculation is conducted by using numerical method.
Estimation of MSE( iEB) is conducted by applying Jackknife method, that is replacing iEB = ki(yi, , ) and
) ˆ , ˆ , (
ˆ, i i l l
EB l
i k y
p into Equation 12 and 13, so that the value of 1i, 2i, and MSE are obtained.
D. Data
For aplication, we used two kinds of data, those are National Social Economy Survey (Susenas) data and population census data year 2010 for Sumenep District. The Susenas data was used for parameter estimation of the model and census data was used for estimating proportion of literate people of each subdistrict.
Three variables used from Susenas data are ability to read and write, age and gender. Number of sample of Susenas data in Sumenep district year 2010 is 2,307 (see Table 1).
The census data is used for estimating parameter in small area (kecamatan) as auxilliary information. Two variables to be used for estimation are gender and age. The number of people in Sumenep district based on the census data year 2010 is 884,003. Distribution of population in each subdistrict is shown on Table 1.
III.RESULTS AND DISCUSSION
Based on Susenas data, the numbers of respondents who are 10 years old or older is 2,307 and the average proportion who are literate is about 77.6%. Figure 1 shows the proportion of people who can read and write in every sub-district
It is seen that sub-district of Batuputih and Talango are the areas which have the lowest literacy rate, while sub-district of Arjasa has the highest literacy rate and even higher than Sumenep sub-district. The other sub-districts which have literacy rate below the avarage are Gapura, Batang-batang, Dungkek, Guluk-guluk, Pasongsongan and Ambuten. The complete information is presented in Figure 1.
A. Direct Estimation
Direct estimation is used two approaches, classical and Bayesian approach. Through classical approach, direct estimation is conducted by applying ML estimation, with
i i i j ij
i y n y n
pˆ / / formula.
For the Bayesian approach, we used Empirical Bayes method by using Beta and logit-normal distribution as a prior distribution
For the prior Beta distribution and applying moment method as explained in Equation 4 and 5, parameter estimate of α and β are = 6.007941 and =1.735254. Empirical Bayes of iEB is obtained by applying Equation 8. Furthemore for the prior logit-normal distribution as in Equation 14 and generating z from N(0,1) distribution with n=500, the expectation value of nominator and denominator in Equation 14 are obtained by calculating formula 15 and 16.
Calculation of estimated parameter (pi) using direct
estimation of the three methods, are shown in Figure 2 and Table 1.
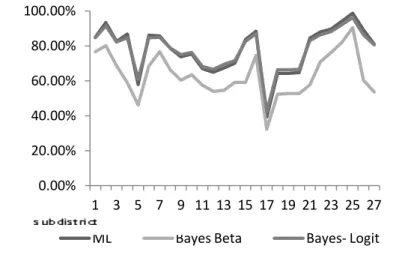
For the direct estimation, Maximum Likelihood (ML) method gives almost similar result with Bayesian method using logit normal distribution but the beta-binomial approach is giving slightly different result. In the Empirical Bayesian estimation using logit-normal prior distribution, the weight for population component is
quite small, so it doesn’t give significant affect to the Bayesian estimation. On the contrary, the weight of in for the Beta prior distribution, i = ni/(ni+ + ) , is also quite large of about 0.905.
The MSE estimation using Jackknife method for direct estimation using Bayesian approach is shown in Figure 3. It can be seen that the two methods, using prior distribution of beta as well as logit normal distribution, do not give good accuracy in term of MSE measurement.
B. Indirect Estimation
For indirect estimation, we used logistic model with two auxilliary variables that are age and gender. Figure 4 are plot of proportion and logit function of proportion of
i i s
j ij i
T ij i
l j s ij i
T ij i il
l il i
leteracy data and with age for male and female group. With pk be a proportion of literate population in kth
category, k=1, …,5.
Figure 4 (a) describes the relation of pk to age, and
Figure 4 (b) describes the relation of logit(pk) = log[pk/(1-pk)] value to age which is grouped into 5 categories; they are 10-30 years old, 30-40 years old, 40-50 years old, 40-50-60 years old, and above 60 years old.This figure is to show that literacy rate is affected by its covariates which are combination of ages and gender. Based on the correlation test with α=5%, it was proven that the proportion of literacy is affected by age and sex. Therefore, sex and age variables can be used as auxiliary variables into SAE model for indirect estimation (model-based). Figure 4 shows that the older the age, the lower the proportion of literate people. Furthermore, the proportion of literate males tends to be larger than the female ones.
Through indirect estimation (with SAE model), model parameter estimation uses PQL method which is then used to estimate through Equation 22. The estimation parameter of model (19) is as follows:
Constant : 4.935
b1 = gender : 0.788 b2 = age : -0.915 sig varian : 0.251
All estimated parameter are siginificant in the model with siginificant level of about <0.0001. In order to get the expectation value of nominator and denominator of the equation we used numerical integration of Monte Carlo method. Furthermore, Bayesian estimation of pi
parameter is calculated based on Equation 24. Using indirect method, the parameter estimate for the proportion of literate people in every sub-district are shown in Table 1 of the Appendix.
C. Comparation of direct and indirect estimation using logit function
Figure 5 is shown the graphic of estimate parameter of pi (the proportion of 10-year-old-or-older literate people) using logit function based on direct and indirect method. As described by Figure 5, the direct estimation method through Empirical Bayesian approach gives significant differences result to the indirect estimation which are includes the two covariates, age and gender variables.
The presence of auxiliary variables, which are age and sex, affects pi estimators, because the weight for the
model component is more dominant than the weight for the direct estimation component due to the small sampling fraction (fi=ni/Ni).
The estimation of MSE( iEB) for the direct and indirect estimation are shown on Figure 6. The MSE values of direct estimation tend to be high. The MSE values for pi
estimation in sub-district of Batuputih are far higher than other sub-districts since the proportion of 10- year-old-or-older people is lower than the proportion in the other sub-districts. The MSE values for indirect estimation is the lowest one, so the indirect estimation using SAE model gives the best estimation.
IV.CONCLUSION
In The aplication using Sumenep regency data was shown that direct estimation through Bayesian approach gives a similar result to the classical approach. The reason are: 1) the weight of population component for empirical bayes estimation using logit-normal prior distribution is quite small, it’s about 0.261% and 2) the weight of in for the Beta prior distribution, i =
ni/(ni+ + ), is quite large of about 0.905. It is due to very small and compare to niwhereas = 6.007941, =1.735254 and in average ni is about 83. Therefore, it
doesn’t give significant affect to the Bayesian estimation. However, using Jackknife method, the MSE estimation for direct estimation with Bayesian approach using beta as the prior distribution as well as for logit normal distribution is quite high. It means that these two methods do not give good accuracy.
Based on Bayesian approach, model-based estimation gives the best MSE values among the three methods. The model-based estimation can give much lower MSE than direct approach with prior Beta and logit-Normal distribution. So we conclude that based on Bayesian approach, the indirect estimation or SAE model gives the best estimation.
The three methods give consistence result, that literacy rate of Batuputih sub-district is the worst while Arjasa subdistrict has the highest literay rate in Sumenep regency.
Figure 2. Plot of estimation result of parameter pi (proportion of literate people aged 10 years old or older) with direct estimation method through
classical (ML) and Bayesian approach
Figure 3. Plot for MSE estimation result to estimate parameter pi
(proportion of literate people aged 10 years old or older)
(a) (b)
Figure 4. The correlation between reading and writing ability with age based on the sex of population aged 10 years old or older in district of Sumenep
Figure 5. Plot for estimation result of parameter pi (proportion of
literate people aged 10 years old or older) with direct and indirect estimation method through Bayesian approach
Figure 6. Plot for MSE estimation result to estimate parameter pi (proportion of literate people aged 10 years old or older) 0.00%
20.00% 40.00% 60.00% 80.00% 100.00%
1 3 5 7 9 11 13 15 17 19 21 23 25 27
ML Bayes Beta Bayes- Logit
0.0000 0.0005 0.0010 0.0015 0.0020 0.0025 0.0030 0.0035 0.0040 0.0045
1 3 5 7 9 11 13 15 17 19 21 23 25 27
MSE Beta MSE Logit
0.400 0.500 0.600 0.700 0.800 0.900 1.000
1 3 5 7 9 11 13 15 17 19 21 23 25 27
2 prediktor 2 predictor logit (direct)
0.0000 0.0010 0.0020 0.0030 0.0040 0.0050 0.0060 0.0070 0.0080 0.0090 0.0100
1 3 5 7 9 11 13 15 17 19 21 23 25 27
2 prediktor 2 predictor logit (direct)
Male
Female
Female Male
subdistrict
TABLE 1.
PARAMETER ESTIMATION RESULT OF PI(PROPORTION OF LITERATE PEOPLE AGED 10YEARS OLD OR OLDER) AND MSE IN SUBDISTRICTS
REFERENCES
[1] R. E. Fay and R. A. Herriot, “Estimates of Income for Small Places: An Application of James Stain Procedures to Cencus Data”, Journal of the American Statistical Association, 1979. [2] BPS, ”Kumpulan Metodologi Survei Sosial Tahun 2003-2005”,
Badan Pusat Statistik (BPS), Jakarta, 2005.
[3] UNDP, “Concept and Measurement of Human Development”,
Human Development Report, 1990.
[4] D. Malec, J. Sedransk, J. L. Moriarity, and F.B. Leclere, Small Area Inference for Binary Variables in National Health Interview Survey, Journal of the American Statistical Association, 1997.
[5] J. Jiang and P. Lahiri, Empirical Best Prediction for Small Area
Inference with Binary Data. Annals of the Institute of Statistical
Mathematics, 2001.
[6] J. N. K. Rao, Small Area Estimation, John Willey and Son, Inc. Publication, 2003.
[7] H. Chandra, R. Chambers, and N. Salvati, “Small Area Estimation of Proportions in Business Survey”. Working Paper. Centre for Statistical and Survey Methodology The University of Wollongong, 2009.
[8] H. J. Boonstra, B. Buelens, K. Leufkens, and M. Smeets, “Small Area Estimates of Labour Status in Dutch Municipalities”. Statistics Netherlands: The Hague/Heerlen, 2011.
Subdistrict N Direct Logit Beta Model
pEB pEB MSE pEB MSE pEB MSE