Accredited by DGHE No: 66b/DIKTI/Kep/2011 DOI: 10.5398/medpet.2013.36.1.70
*Corresponding author: E-mail: [email protected]
Analysis of Regional Distribution Capacity and Priorities for Improving Beef Cattle
Population in East Nusa Tenggara Province
U. R. Lolea,*, S. Hartoyob, Kuntjorob, & I W. Rusastrac
aFaculty of Animal Husbandry, Nusa Cendana University Jln. Adisucipto-Penfui, Kupang-East Nusa Tenggara 85361, Indonesia bFaculty of Economics and Management, Bogor Agricultural University
Jln. Kamper, Kampus IPB Darmaga Bogor-West Java 16680, Indonesia cIndonesian Center for Agriculture Socio Economic and Policy Studies
Jln. Ahmad Yani No 70 Bogor-West Java 16161, Indonesia (Received 01-02-2013; Reviewed 26-02-2013; Accepted 01-04-2013)
ABSTRACT
Cattle farms resources in NTT are potential to be developed, but regency has not used it ef -fectively. As a consequently, a huge disparity of beef cattle deployment between regencies occur. The objectives of the research were�� a�� to analy�e the level ofwere�� a�� to analy�e the level of Capacity of Increasing Beef Cattle Population (CIBCP�� in each regency, and b�� to analy�e the priorities of each regency for the develop -ment of beef cattle. Methods of the research used maximum potential of land resources (MPLR�� and maximum potential of householder (MPNH�� equation to analy�e the effectiveness of CIBCP for re -gency. This analysis used to analy�e the capacity and priorities. To formulate the beef cattle develop -ment policies, analysis of the ratio of the density of population and livestock are used. Conclusions�� (a�� NTT has a very large capacity to increase beef cattle to about 3.2 times that of the current popu -lation (based on land and labor resources��, with the existing technology and management. Regency areas with large land resources and labor generally have a large CIBCP. On the other hand, regions with large land resources but small labor resource (or vice versa��, have a small CIBCP (depending on the most limited resources��, and (b�� Scale of the priority regions are not only dominated by the larg -est number of cows. The number of households and the cultivated land has positive and powerful impacts (compared to pasture areas�� to CIBCP effective.
Key words: beef cattle, deployment, regions capacity, priority scale, NTT
ABSTRAK
Sumberdaya peternakan sapi dalam wilayah NTT sangat potensial untuk dikembangkan,NTT sangat potensial untuk dikembangkan, namun belum dimanfaatkan secara efektif oleh setiap kabupaten. Akibatnya, terdapat disparitas penyebaran sapi yang sangat besar antar-kabupaten. Penelitian bertujuan�� a�� Menganalisis tingkatMenganalisis tingkat kapasitas penambahan populasi sapi pada setiap kabupaten; dan b�� Merumuskan skala prioritas tiap wilayah kabupaten untuk pengembangan sapi. Metode yang digunakan adalah analisis kapasitas peningkatan populasi ternak sapi (KPPTS�� Efektif untuk tiap kabupaten menggunakan persamaan potensi maksimum berdasarkan sumberdaya lahan (PMSDL�� dan potensi maksimum berdasarkan jumlah kepala keluarga (PMKK��. Analisis ini digunakan untuk menganalisis kapasitas dan skala prioritas. Analisis rasio densitas penduduk dan ternak digunakan untuk merumuskan kebijakan pengembangan sapi. Kesimpulan�� (a�� Kapasitas wilayah NTT masih sangat besar untuk penambahan ternak sapi hingga sekitar 3,2 kali dari populasi saat ini (berdasarkan sumberdaya lahan dan tenaga kerja��, dengan tingkat teknologi dan manajemen yang ada. Wilayah kabupaten dengan sumberdaya lahan besar namun sumberdaya tenaga kerja kecil (atau pun sebaliknya��, akan memiliki nilai KPPTS efektif yang kecil pula, tergantung pada sumberdaya fisik mana yang paling terbatas; dan (b�� Skala prioritas wilayah tidak didominasi wilayah dengan jumlah sapi terbanyak saja. Jumlah kepala keluarga dan lahan garapan berpengaruh positif dan dominan (dibanding luas padang rumput�� terhadap KPPTS Efektif.
INTRODUCTION
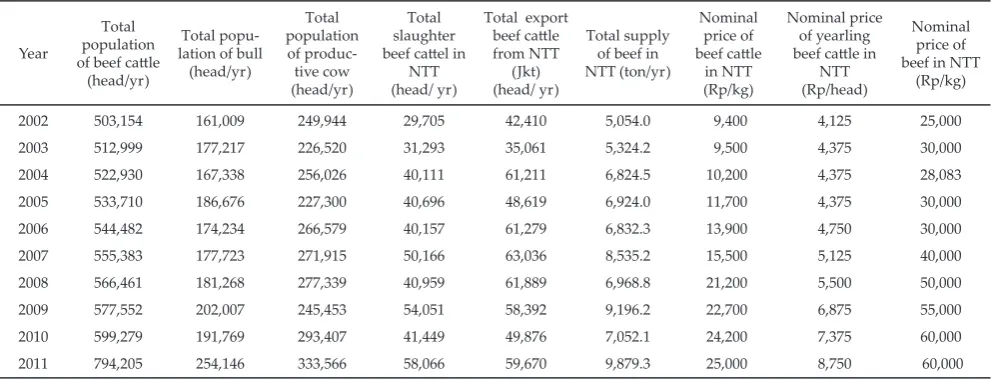
Beef cattle business in East Nusa Tenggara Province (NTT) has comparative and competitive advantages. Such of the advantages is the high number of beef and buffalo population that is about 794,205 heads (Ditjennak, 2012). Nevertheless, competitive advantage became weak with the entry of new production regions, strengthening of old production regions, increased imports of beef cattle/beef, and the ineffectiveness of the trading and pricing policies (Talib et al., 2007; Lawalu et al., 2008). This trend should be note, because all of the production regions in Indonesia supplied the same con -sumption region, namely DKI Jakarta (Ditjennak, 2012). Table 1 shows the trend of population growth, slaughter, exports and the price of cattle in NTT over the last 10 yr (Disnak NTT, 2012). Total cattle population was not fully able to offset the rate of slaughter cattle in NTT and rate of exports out of the NTT. This fact indicated that the depletion phenomenon has emerged from the cattle population.
In fact, comparative advantage has not been fully established and developed in order to take into national consideration. One indicator of this condition is the scale of the beef cattle distribution is not equal at all regen -cies. This cause a main problem to utilize some potential resources in regencies. Animal distribution mostly in Timor which is approximately 80.0%, and the rest is 8.9% in Sumba and 11.1% in Flores (Disnak NTT, 2012). In NTT, there are regions that assumed have densely beef cattle population, but continues to be developed with the old system and have great government atten -tion. Conversely, there are regions with small number of beef cattle population but received less attention in its development (Basuno, 2004; Talib, 2007). Therefore, in order to make NTT as a production centre with both advantages, all of the potencies of all regions must be revitalized. Decentralization policy will provide the flex -ibility to prioritize this program. Thus, provincial and regency governments and various related organizations
in farm and community economic development should work together (Lawalu et al., 2008). Implementation of government policies need to be synchronized. For example, synchronization between cattle development in “Anggur Merah Program” (budget for wealthy com -munity) of local government and self-sufficient of beef policy (SSBP) that is categorize NTT as a region of cattle development based on intensification of natural mating (INKA) which is less technology.
Therefore, the initial effort to regionalize, deploy -ment, and development of beef beef cattle in NTT needs to be applied through the identification of the physical capability of each regency, so that, in each region can estimate livestock units, including priorities scale (Ditjennak, 2012). If beef cattle distribution and development carried out simultaneously in all regen -cies, positive effects were; distribution of livestock is more balance, the number of beef cattle farmer increase, farmers’ income increases, good raising beef cattle, and funding from various source increases (Yusdja & Ilham, 2004; Lole, 2009).
To provide guidelines for the development and as an empirical argument to the government needs a research to strengthen the operational basis of beef cattle deployment. The first step is by analyzing the physical capability of the region and increases the population capacity of regency. The research is to generate a devel -opment of priority scale per regency as a blue print of deployment and development of beef cattle. It is also to determine the performance and potential dynamics of region.
Deployment and development of beef cattle throughout all of the regencies is a strategic step to strengthen its comparative advantages of the regen -cies. If reinforcement carried out simultaneously and continuously (by all of the stakeholders), NTT could be managed and even enhance the status as a national pro -duction centre. Obviously, the main benefit is to increase welfare of farmers and their families from the beef cattle business and related industries. The objectives were: a)
Source: Disnak NTT 2012 (processed).
2002 503,154 161,009 249,944 29,705 42,410 5,054.0 9,400 4,125 25,000
2003 512,999 177,217 226,520 31,293 35,061 5,324.2 9,500 4,375 30,000
2004 522,930 167,338 256,026 40,111 61,211 6,824.5 10,200 4,375 28,083
2005 533,710 186,676 227,300 40,696 48,619 6,924.0 11,700 4,375 30,000
2006 544,482 174,234 266,579 40,157 61,279 6,832.3 13,900 4,750 30,000
2007 555,383 177,723 271,915 50,166 63,036 8,535.2 15,500 5,125 40,000
2008 566,461 181,268 277,339 40,959 61,889 6,968.8 21,200 5,500 50,000
2009 577,552 202,007 245,453 54,051 58,392 9,196.2 22,700 6,875 55,000
2010 599,279 191,769 293,407 41,449 49,876 7,052.1 24,200 7,375 60,000
2011 794,205 254,146 333,566 58,066 59,670 9,879.3 25,000 8,750 60,000
to analyze the level of Capacity of Increasing Beef Cattle Population (CIBCP) in each regency, and b) to analyze the priorities of regency for development of beef cattle.
METHODS
Sources and Types of Data
The study was conducted at the entire regency of NTT, using secondary data from various related agen -cies. Primary data was obtained from the various par -ties involved in six regencies of the three main islands, through in deep-interview based on questionnaires.
Calculation of the Capacity of Increasing Beef Cattle Population
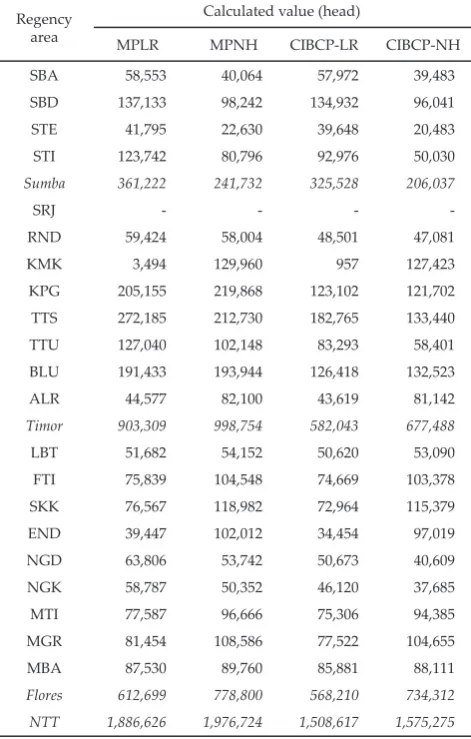
Analysis of data applied the Maximum Potential of Land Resources (MPLR) equation and Maximum Potential of Householder (MPNH) equation to analyze the effectiveness of CIBCP for regency. This analysis was used to analyze the capacity and priorities. The calcula -tion of the Capacity of Increasing Beef Cattle Popula-tion (CIBCP) was based on Land Resources (CIBCP-LR) and the Number of Households (CIBCP-NH) in regency using an Effective CIBCP formula. Effective CIBCP was defined as CIBCP-LR or CIBCP-NH with a small value (Ditjennak, 1995).
Determine of Priority Scale and General Strategy of Development
CIBCP value was the only criteria for determining priorities scale in this study. Although, this method had some weaknesses, it was considered adequate in estimation study. Analysis of the ratio of beef cattle den -sity was used to formulate development policies of beef cattle farm.
RESULTS AND DISCUSSION
Physical, Socio-Cultural, and Economics Capability
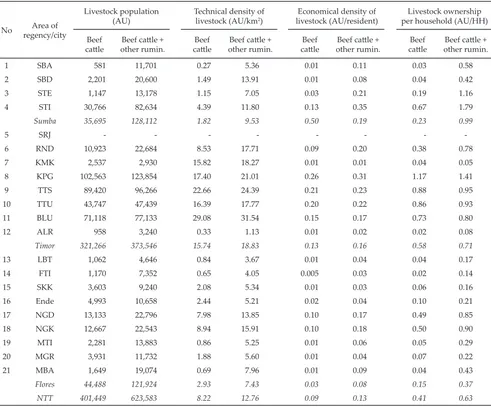
With unique geographical conditions among regions, there is a difference of potential physical, socio-cultural, and economic. Synthesize various forms and levels of resource capability into the comparative and competitive advantages of each region, and define the level of regional competitiveness in the development area of beef cattle farm (Table 2).
Physical potential included support of several resources namely land, water, feed, livestock and labor. Potential of land resources included land of natural pasture, pasture upgrade, fodder crops, cultivated food crops, integrated forest, and so forth. Natural pasture degradation of quality continuously occured, because there was no improvement (Ilham, 2006; 2007).
Another important potential resource was wide of cultivated land for food crops with high quality by-product. Evidently, the region with large cultivated land (but has no pasture), was able to support a large number of quality feed for beef cattle. Forage crops
(superior grass, legume, trees feed and so on) were also potential, because it was able to produce quality feed. Large carrying capacity of the by-product of food crop and main-product of feed crop was an alternative feed to substitute pasture. These results were in accordance with Sutaryono (2008) who stated that forage in the form of natural grass, leftover crops, bush beans, bananas and papaya trunks, and leaves of trees, were potential feed during the dry season.
Resource capability of beef cattle was quite large, but the main issue was the imbalance between regions and the deployment of beef cattle ownership per household (based on availability of family labor). Approximately 80.0% of beef cattle population spread out in Timor, 8.9% in Flores and 11.1% in Sumba. Beef cattle population drastically declined in the last decade, also inhibits the deployment beef cattle inter-regional efforts and the distribution of beef cattle among house -holds. The stagnant breeding activities were more diffi -cult than the deployment and distribution of beef cattle.
Increase Capacity of Beef Cattle Population and Development Priority Region
Analysis of CIBCP showed various empirical facts (Table 3). These results were important for assessment of opportunities and their impact on the subsequent pro -gram (Disnak NTT, 2012). These three regions (Timor, Sumba, and Flores) were analyzed separately, because each had different characteristic. It was important to ob -tain specific description, both the potential and capacity of the region as well as suitable strategy for the develop -ment of beef cattle for each region.
Timor region. Analysis results based on land resources (Table 3) showed that even though technical density of beef cattle in Timor is relatively large, it was not a con -straint to develop beef cattle. However, in order to in -crease the beef cattle population in Belu, land resources was the first constraint to be noted first as compared to the resources of family labor. Technical density of beef cattle in Kupang was very small, because it had the larg -est area with a relatively large number of beef cattle. On the other hand, technical density of beef cattle in Belu was the greatest, because it had the smallest area with a relatively large number of beef cattle too.
The capacity of land resource (pasture and culti -vated land) in Timor was large enough for beef cattle, because many untapped land resources used optimally. Thus, although the land resource was common con -straint in beef cattle development in Timor, but it was not an effective constraint that limits increasing capacity of beef cattle population directly. On the other hand, land resource in Belu was a constraint that affects the increasing capacity of beef cattle population directly. Therefore, labor resource per farmer household was not a constraint to increase the capacity of beef cattle in Belu. This was caused by the total population (farmer household) was the largest and the highest population density.
Source: BPS NTT Year 2011 (processed). No Area of
regency/city
Livestock population
(AU) Technical density of livestock (AU/km2)
Economical density of
livestock (AU/resident) per household (AU/HH)Livestock ownership
Beef
cattle other rumin. Beef cattle + cattleBeef other rumin. Beef cattle + cattleBeef other rumin. Beef cattle + cattleBeef other rumin. Beef cattle +
1 SBA 581 11,701 0.27 5.36 0.01 0.11 0.03 0.58
2 SBD 2,201 20,600 1.49 13.91 0.01 0.08 0.04 0.42
3 STE 1,147 13,178 1.15 7.05 0.03 0.21 0.19 1.16
4 STI 30,766 82,634 4.39 11.80 0.13 0.35 0.67 1.79
Sumba 35,695 128,112 1.82 9.53 0.50 0.19 0.23 0.99
5 SRJ - - -
-6 RND 10,923 22,684 8.53 17.71 0.09 0.20 0.38 0.78
7 KMK 2,537 2,930 15.82 18.27 0.01 0.01 0.04 0.05
8 KPG 102,563 123,854 17.40 21.01 0.26 0.31 1.17 1.41
9 TTS 89,420 96,266 22.66 24.39 0.21 0.23 0.88 0.95
10 TTU 43,747 47,439 16.39 17.77 0.20 0.22 0.86 0.93
11 BLU 71,118 77,133 29.08 31.54 0.15 0.17 0.73 0.80
12 ALR 958 3,240 0.33 1.13 0.01 0.02 0.02 0.08
Timor 321,266 373,546 15.74 18.83 0.13 0.16 0.58 0.71
13 LBT 1,062 4,646 0.84 3.67 0.01 0.04 0.04 0.17
14 FTI 1,170 7,352 0.65 4.05 0.005 0.03 0.02 0.14
15 SKK 3,603 9,240 2.08 5.34 0.01 0.03 0.06 0.16
16 Ende 4,993 10,658 2.44 5.21 0.02 0.04 0.10 0.21
17 NGD 13,133 22,796 7.98 13.85 0.10 0.17 0.49 0.85
18 NGK 12,667 22,543 8.94 15.91 0.10 0.18 0.50 0.90
19 MTI 2,281 13,883 0.86 5.25 0.01 0.06 0.05 0.29
20 MGR 3,931 11,732 1.88 5.60 0.01 0.04 0.07 0.22
21 MBA 1,649 19,074 0.69 7.96 0.01 0.09 0.04 0.43
Flores 44,488 121,924 2.93 7.43 0.03 0.08 0.15 0.37
NTT 401,449 623,583 8.22 12.76 0.09 0.13 0.41 0.63
Table 2. Population, density, and ownership of beef cattle and other ruminant in East Nusa Tenggara Province, Indonesia, per 2011
arguing. Therefore, efforts to increases the capacity of population in Timor (the primary region) needs to be executed, along with the efforts to the deployment beef cattle in Sumba and Flores (the secondary and tertiary regions). The effort to deployment of beef cattle needs to be executed to harness the potential of land resource in Sumba and Flores. It was also to anticipate the increas -ing number of population in Timor in the future (given approximately 45.3% of the population living in Timor).
In contrast, analysis based on labor resource (households) showed that economics density in Timor was relatively small. Similarly, economies of density per household or the average ownership of beef cattle was also small. Economic density of beef cattle in Kupang was the highest, because it had the largest beef cattle population, while the economies density of beef cattle in Belu was the lowest, because it had the largest population.
Compared with the potential of land resources, human resource potential was identified as an effective constraint in increasing the capacity of the beef cattle
population in Timor, except in Belu. This meant that the current increase in population in Timor was not effec -tively constrained by the availability of land resources, but it would be effectively constrained by the availabil -ity of labor resources in each household. At first glance, limitations of household labor were still dominant in extensive system in Timor where beef cattle grazed on pasture without adequate supervision. In addition, the average number of beef cattle ownership per household (NH) was low and not evenly distributed among the farmers causing the decrease of labor productivity itself.
-ture land carrying capacity, so that the efforts to increase production and productivity of cultivated land could encourage the increasing beef cattle population.
Therefore, the participation of all labor in each household, especially farmers with large cultivated land was needed to increase beef cattle population in Timor. Distributing beef cattle to all farmers were an important operational step. The improvement of management skills and raising beef cattle was needed to improve performance business of beef cattle.
Sumba region. Table 3 showed that technical density for beef cattle in Sumba was relatively small. Beef cattle population was concentrated in East Sumba (approxi -mately 86.19%), so that there is inequality of beef cattle deployment in the four regencies. Data showed that pas -toral land was lower than the potential area, which was only about 22.73% (BPS NTT, 2011). For all ruminants, technical density increased dramatically. This suggests that although the number of beef cattle in other regen
-cies (except East Sumba) was very small, but the capabil -ity of others ruminants (buffalo, horse, goat) was quite large.
Similar with the conditions in Timor, the effective constraint in Sumba was a labor resource. This mean that although land resources in Sumba (especially in East Sumba) have an enormous capacity for beef cattle, the utilization of existing potential is still limited. This could be due to many land resources have not used optimally, to produce grass and crop by-product result from lack of labor availability. The improvement of management skills and good maintenance of beef cattle was needed to improve business performance, so that farmers were able to maintain more cows in each farm household. The government policy for the deployment and distribution of beef cattle ownership to region capa -bility was strategic to increase population. Realization of investment from financial institutions and the private sector required to support government policy.
Southwest Sumba and West Sumba regions were relatively more fertile and had large of cultivated land for feed to increase beef cattle population. The introduc -tion of beef cattle from government and private parties could accelerate the process of ruminant diversifica -tion (not only buffalo and horse). The improvement in population structure through the introduction beef cattle program would encourage beef cattle population.
The development of hybrid beef cattle Ongol Sumba (SO) was good due to its suitable habitat (climatic and geographic). In addition, in terms of socio-cultural context, beef cattle become an important part in people’s lives inherently. The efforts to increase the capacity of SO in Sumba should be developed inter-sector coopera -tion from various stakeholders.
Flores region. Table 3 showed that Flores had small technical densities for beef cattle. Beef cattle were concentrated in Ngada and Nagakeo which was about 57.99% of total beef cattle in Flores (or about 6.43% of the total beef cattle in NTT), while the beef cattle population in other areas was very small. A fertile region with large cultivated land area had a greater capacity to increase the beef cattle population. In fact, the existing capacity has not been use optimally, and cultivated land capacity was higher than the natural pasture such as in Timor and Sumba.
Two effective constraints happened in Flores. In general, the seven regencies faced an effective constraint on land resources, while two other districts (Ngada and Nagakeo) faced an effective constrained on labor resource. This means that although the current land resources in seven regencies have large enough capacity of beef cattle, but it will be the first constraint in the future, if the increasing of population based on existing potential.
In contrast, land resources in Nagakeo and Ngada have a large, but the dominant effective constraint was limited labor. Thus, increasing beef cattle in the two regencies will face the labor resources constraint. Improvement of management skills and good main -tenance of beef cattle was needed to improve the beef cattle business itself. Therefore, each farmer was encour
-Table 3. The maximum potential of land resources (MPLR), maximum potential of householder (MPNH), and ca
-pacity of increasing beef cattle population based on land resources (CIBCP-LR) and the number of house
-holds (CIBCP-NH) in East Nusa Tenggara Province,
age to have increase beef cattle population and pro -ductivity through some programs, that were livestock grants, soft loans (interest rate or duration), and public participation.
In the last 10 yr, the development of beef cattle in Flores has increased significantly, especially in Ngada and Nagakeo. This gives new hope that beef cattle in Flores can develop based on land potential and labor in regencies. The potential by-product of the vast arable land can directly support the beef cattle development.
The Dynamics Capability of the Regional Distribution
The difference value between CIBCP (LR) and CIBCP (NH) illustrated that a greater potential of one re -source (while other re-sources are much smaller), would not be effective to support efforts to increase population in a region (technology and investment is assumed to remain). For example, a region with wide pasture or cultivated land (LR), but has less labor (NH), will be difficult to increase population based on capacity of the pasture. Conversely, if a region with a large population (NH), but has limited land resources, will be difficult to increase population based on labor availability. This
condition could be improved if there were changes in technology and/or management of beef cattle.
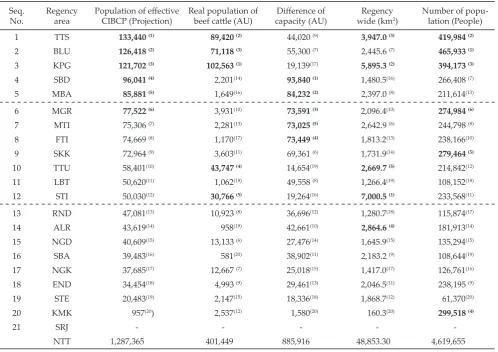
The top five regencies that most prominent to increase beef cattle capacity in NTT were TTS, Belu, Kupang, Southwest Sumba, and West Manggarai. CIBCP value determined by the availability of specific resources each district, in this case associated with an area of land and amount of labor. Every region in the top-five group generally had a relatively large land area and/or the amount of labor.
The comparison between total areas with the total population showed that Kupang was the biggest area with the smallest number of population, but based on the CIBCP value, ranked the third place. In contrast, Belu was the smallest region with the largest population, but based on the CIBCP value ranked second place. Furthermore, TTS was the second order in terms of areas and population, but based on the CIBCP value this region ranked first.
From these facts, it can be conclude that the value of CIBCP will reach maximum, if there is a balance between the main resources needed to increase the beef cattle population, in this case sufficient land and resources of agricultural labor. This balance will create a
Note: - Figures in parentheses express order from largest to smallest number of the indicator. - Bold figures are the top five in each indicator.
Seq.
No.
Regency area
Population of effective
CIBCP (Projection) Real population of beef cattle (AU) capacity (AU)Difference of wide (kmRegency 2)
Number of popu -lation (People)
1 TTS 133,440 (1�� 89,420 (2�� 44,020 (9) 3,947.0 (3�� 419,984 (2��
2 BLU 126,418 (2�� 71,118 (3�� 55,300 (7) 2,445.6 (7) 465,933 (1��
3 KPG 121,702 (3�� 102,563 (1�� 19,139(17) 5,895.3 (2�� 394,173 (3��
4 SBD 96,041 (4�� 2,201(14) 93,840 (1�� 1,480.5(16) 266,408 (7)
5 MBA 85,881 (5�� 1,649(16) 84,232 (2�� 2,397.0 (8) 211,614(13)
6 MGR 77,522 (6�� 3,931(10) 73,591 (3�� 2,096.4(10) 274,984 (6��
7 MTI 75,306 (7) 2,281(13) 73,025 (5�� 2,642.9 (6) 244,798 (8)
8 FTI 74,669 (8) 1,170(17) 73,449 (4�� 1,813.2(13) 238,166(10)
9 SKK 72,964 (9) 3,603(11) 69,361 (6) 1,731.9(14) 279,464 (5��
10 TTU 58,401(10) 43,747 (4�� 14,654(19) 2,669.7 (5�� 214,842(12)
11 LBT 50,620(11) 1,062(18) 49,558 (8) 1,266.4(19) 108,152(18)
12 STI 50,030(12) 30,766 (5�� 19,264(16) 7,000.5 (1�� 233,568(11)
13 RND 47,081(13) 10,923 (8) 36,696(12) 1,280.7(18) 115,874(17)
14 ALR 43,619(14) 958(19) 42,661(10) 2,864.6 (4�� 181,913(14)
15 NGD 40,609(15) 13,133 (6) 27,476(14) 1,645.9(15) 135,294(15)
16 SBA 39,483(16) 581(20) 38,902(11) 2,183.2 (9) 108,644(19)
17 NGK 37,685(17) 12,667 (7) 25,018(15) 1,417.0(17) 126,761(16)
18 END 34,454(18) 4,993 (9) 29,461(13) 2,046.5(11) 238,195 (9)
19 STE 20,483(19) 2,147(15) 18,336(18) 1,868.7(12) 61,370(20)
20 KMK 957(20) 2,537(12) 1,580(20) 160.3(20) 299,518 (4��
21 SRJ - - - -
-NTT 1,287,365 401,449 885,916 48,853.30 4,619,655
stable condition to increase beef cattle population in the future. Obviously, changes can occur significantly if sys -tem was raised intensifically through good technology, increasing investment, and improving production and pricing policies. Table 4 showed comparison of the real population in 2010 with a projected population based on CIBCP value.
Dynamics of Potential Development Area of Beef Cattle
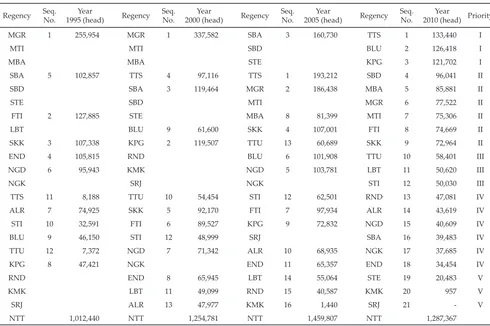
The dynamics of the potential area showed a change in some of the indicators over time, which in this study shown in the four periods, i.e. 1995, 2000, 2005, and 2010. Values changing on some indicators or variables determined the value of CIBCP were beef cattle popula -tion (animal units), spacious land resources (pasture and arable land), and the amount of labor resources (number of farm households). CIBCP value and dynamics of change in priorities for the last 15 yr (i.e. 1995, 2000, 2005 and 2010) was shown in Table 5.
Table 5 showed that the rates of change of capacity differed from each other in the regency, due to different resources in each region. In general, the regions in NTT were more likely to have an effective constraint on the availability of land resources. In detail, about 60.0% of the areas had an effective constraint on the limited land resources and 40.0% of regency had an effective con -straint on the limited labor resources. There were some
areas with big difference between effective constraints of land and labor resources, and there were some areas that almost equal.
The bigger potential for one of the resources (while other resources are much smaller) will not effective to increase population in the area. For example, large areas of pasture or arable lands with little number of workers is difficult to increase population based on the capac -ity of the existing pasture. Conversely, big population area with little land resources is hard to increase beef cattle population based on existing labor availability. Improvement in technology and/or management system of beef cattle rising can solve that condition.
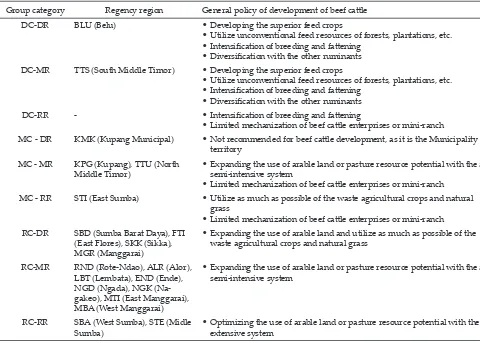
General Policy for the Priority Development Area of Beef cattle
Analysis of the population density ratio and beef cattle density obtained some actual specific condi -tions, thus requiring different problem-solving efforts across the region. The categorization of population and livestock density in each region as well as public policy could implement in each region. Categorization of re -gency were as follows: dense cattle-dense residents (DC-DR), dense cattle-moderate residents (DC-MR), dense cattle-rare residents (DC-RR), moderate cattle-dense residents (MC-DR), moderate cattle- moderate residents (MC-MR), moderate cattle-rare residents (MC-RR), rare cattle-dense residents (RC-DR), rare cattle-moderate
Regency Seq. No.
Year
1995 (head) Regency
Seq.
No.
Year
2000 (head) Regency
Seq.
No.
Year
2005 (head) Regency
Seq.
No.
Year
2010 (head) Priority
MGR 1 255,954 MGR 1 337,582 SBA 3 160,730 TTS 1 133,440 I
MTI MTI SBD BLU 2 126,418 I
MBA MBA STE KPG 3 121,702 I
SBA 5 102,857 TTS 4 97,116 TTS 1 193,212 SBD 4 96,041 II
SBD SBA 3 119,464 MGR 2 186,438 MBA 5 85,881 II
STE SBD MTI MGR 6 77,522 II
FTI 2 127,885 STE MBA 8 81,399 MTI 7 75,306 II
LBT BLU 9 61,600 SKK 4 107,001 FTI 8 74,669 II
SKK 3 107,338 KPG 2 119,507 TTU 13 60,689 SKK 9 72,964 II
END 4 105,815 RND BLU 6 101,908 TTU 10 58,401 III
NGD 6 95,943 KMK NGD 5 103,781 LBT 11 50,620 III
NGK SRJ NGK STI 12 50,030 III
TTS 11 8,188 TTU 10 54,454 STI 12 62,501 RND 13 47,081 IV
ALR 7 74,925 SKK 5 92,170 FTI 7 97,934 ALR 14 43,619 IV
STI 10 32,591 FTI 6 89,527 KPG 9 72,832 NGD 15 40,609 IV
BLU 9 46,150 STI 12 48,999 SRJ SBA 16 39,483 IV
TTU 12 7,372 NGD 7 71,342 ALR 10 68,935 NGK 17 37,685 IV
KPG 8 47,421 NGK END 11 65,357 END 18 34,454 IV
RND END 8 65,945 LBT 14 55,064 STE 19 20,483 V
KMK LBT 11 49,099 RND 15 40,587 KMK 20 957 V
SRJ ALR 13 47,977 KMK 16 1,440 SRJ 21 - V
NTT 1,012,440 NTT 1,254,781 NTT 1,459,807 NTT 1,287,367
residents (RC-MR), and regency with rare cattle-rare residents (RC-MR).
In general, the option of beef cattle development policy could be adapted to the conditions of real re -sources available in the field. The DC-DR region tend to choose alternatives to implement intensification program, which aims to increase the capacity of the lim -ited-capacity-land, and to support more livestock units per hectare. In contrast, the RC-RR region tend to choose alternatives to implement extension program, so that the unused potential land resources can exploit optimally. Description more details about the various combinations of conditions between livestock density and population density, was shown in Table 6.
Timor had empirical evidence about positive rela -tionship between beef cattle and residents. The number of beef cattle in each region related and linked to the local residents. Thus, the distribution policy of beef for family farmer who running semi-intensive and intensive system with a certain minimum amount (e.g. 1–3 ST),
was needed to increase the beef cattle population in DC-DR region. In contrast, RC-RR region needed the form of beef cattle distribution policy for every head of family farmers (4–5 ST) who running extensification system.
The moderate or intermediate region could have various policies between the two extreme conditions above.
Recommendation of this research are: (a) Types of different livestock development policy are need for a specific region base on actual resources. The policy is highly depending on the potential of resources (labor supply, feed by-product, and feed pastures). For ex -ample, the policy in DC-DR region (in Belu Regency) could implement in farm intensification program (on feed crop, breeding, and fattening) and diversification program (on other sources of feed and other kind of ruminant animal). (b) Technically, as a relevant follow-up is the arrangement of the development of beef cattle agribusiness which includes the dynamics of consump -tion and animal produc-tion, deployment of sustainable beef cattle, livestock trading flow control optimum in each region, and appropriate management of production systems.
CONCLUSION
NTT region has large capacity for additional beef cattle up to about 3.2 times that of the current popula -tion (based on feed resources and labor), with existing technology, management, and market factor. Regency areas with land resources and large labor generally have a greater value of CIBCP. On the other hand, regions with large land resources but small labor resource (or
Notes: Cattle: DC= dense cattle; MC= moderate cattle; RC = rare cattle
Residents: DR= dense residents; MR= moderate residents; RR= rare residents.
Group category Regency region General policy of development of beef cattle
DC-DR BLU (Belu) Developing the superior feed crops
Utilize unconventional feed resources of forests, plantations, etc. Intensification of breeding and fattening
DC-MR TTS (South Middle Timor) Developing the superior feed crops
Utilize unconventional feed resources of forests, plantations, etc. Intensification of breeding and fattening
DC-RR - Intensification of breeding and fattening
Limited mechanization of beef cattle enterprises or mini-ranch
• •
MC - DR KMK (Kupang Municipal) Not recommended for beef cattle development, as it is the Municipality territory
•
MC - MR KPG (Kupang), TTU (North
Middle Timor) Expanding the use of arable land or pasture resource potential with the a semi-intensive system Limited mechanization of beef cattle enterprises or mini-ranch
•
•
MC - RR STI (East Sumba) Utilize as much as possible of the waste agricultural crops and natural grass
Limited mechanization of beef cattle enterprises or mini-ranch
•
• RC-DR SBD (Sumba Barat Daya), FTI
(East Flores), SKK (Sikka), MGR (Manggarai)
Expanding the use of arable land and utilize as much as possible of the waste agricultural crops and natural grass
•
RC-MR RND (Rote-Ndao), ALR (Alor),
LBT (Lembata), END (Ende),
NGD (Ngada), NGK (Na-gakeo), MTI (East Manggarai),
MBA (West Manggarai)
Expanding the use of arable land or pasture resource potential with the a semi-intensive system
•
RC-RR SBA (West Sumba), STE (Midle
Sumba) •Optimizing the use of arable land or pasture resource potential with the extensive system Table 6. The general policy of development of beef cattle in each a category of regions in NTT based on the density of residents and
vice versa), will have a smaller effective of CIBCP value, depending on the physical resources that are most lim -ited. Priority scale order of development regions is not only dominated by the region with the largest number of beef cattle. Cultivated land area has more dominant effect than the vast grasslands in determining the value of effective CIBCP.
REFERENCES
Basuno, E. 2004. Returns the status of the Nusa Tenggara as a
production center of beef cattle. Agricultural Policy Analy -sis 2: 354-368.
Disnak NTT [NTT Provincial Livestock Office]. 2012. Annual Report of the Animal Husbandry Department of NTT. NTT Livestock Office, Kupang.
Ditjennak [Directorate General of Livestock]. 2010. Blue Print of Self-Sufficient Program in 2014. Jakarta: Directorate General of Livestock, Department of Agricultural RI.
Hadi, P. U. 2012. Manajemen Rantai Pasok Ternak dan Daging
Sapi di Nusa Tenggara Timur. Dalam: E. M. Lokkolo (Ed). Bunga Rampai Komoditas Pertanian Indonesia. IPB Press, Bogor.
Hadi, P. U. & N. Ilham. 2002. Problem and prospect of beef cattle
breeding in Indonesia. Journal of Agricultural Research and
Development 21: 148-157.
Ilham, N. 2006. Socio-economic analysis and strategies for achieving self-sufficiency in meat in 2010. Agricultural
Policy Analysis 4: 131-145.
Ilham, N. 2007. Alternative policies to increased GDP growth in livestock subsector in Indonesia. Agricultural Policy
Analysis 5: 335-357.
Kameo, D. 2006. Poverties of smallholder farm in NTT. A case
study in Regency of Kupang and South Central Timor. In: Analysis of CSIS Year XXV No 1, January-February, Ja -karta.
Kariyasa, I. K. 2005. Integration of crop-livestock systems in the
perspective of fertilizer subsidy policy reorientation and increase farmers’ income. Agricultural Policy Analysis 3:
68-80.
Lole, U. R. 2009. Develop of farm model in East Nusa Tenggara:
reliability vs aberration. Scientific Journal “Lingkungan Semiringkai” Research Center for Environment and Natu
-ral Resources Undana, Vol 2 No 9, June 2009.
Sutaryono, Y. A. 2008. Forage resources in livestock-cropping
smallholder systems. a case study of farmers at transmi
-gration areas of Dompu, West Nusa Tenggara. Med. Pet.
31: 146-154.
Talib, C., I. Inounu & A. Bamualim. 2007. The restructuring of
livestock in Indonesia. Agricultural Policy Analysis 5:
1-14.
Winarso, B., R. Sajuti, & C. Muslim. 2005. Economic overview of beef cattle in East Java. Forum Penelitian Agro Ekonomi
23: 61-71.
Yusdja, Y. & N. Ilham. 2004. Review of the policy of develop
-ment of agribusiness beef beef cattle. Agricultural Policy