Fitri Nurfatriani1,2 and Zahrul Muttaqin1
ABSTRACT
6JKUTGUGCTEJYCUCKOGFCVECNEWNCVKPIVJGGEQPQOKEXCNWGQHJ[FTQNQIKECNDGPGſVU associated with protecting forest in the upper Brantas Sub-watershed. The hydrological DGPGſVYCUNKOKVGFVQEQOOGTEKCNWUGUQHYCVGTHTQOVJGHQTGUVYJKEJKPENWFGFVCR drinking water, hydropower generation, and industrial uses. The economic value was calculated using the full cost method in which the cost should be paid by all users ICKPKPIDGPGſVU6JGECNEWNCVGFEQUVYCUHWVJGTWUGFVQFGVGTOKPGCVCTKHHHQTYCVGT WUCIGUQPGVJCVDGVVGTTGƀGEVGFVJGUWUVCKPCDNGWUGXCNWGQHYCVGT
-G[YQTFU 'EQPQOKE XCNWCVKQP J[FTQNQIKECN DGPGſVU RTQVGEVKPI HQTGUV HWNN EQUV method
I. INTRODUCTION
The contribution of forestry sector to the economic development is often
EQPUKFGTGFCPFECNEWNCVGFQPN[HTQOKVUVCPIKDNGDGPGſVUCUKVUKPVCPIKDNGDGPGſVU CTGWUWCNN[FKHſEWNVVQECNEWNCVG*QYGXGTFGXGNQROGPVQHTGUQWTEGGEQPQOKEU JCURTQXKFGFUGXGTCNOGVJQFUCPFVGEJPKSWGUKPSWCPVKH[KPIKPVCPIKDNGDGPGſVU
of forest towards more comprehensive valuation of forest resources related to
VJGEJQKEGUQHHQTGUVNCPFWUGU$KUJQR
'EQPQOKE XCNWCVKQP QH PCVWTCN TGUQWTEG DGPGſVU ECP KNNWUVTCVG OWVWCN
relationship between economic and environment for better natural resource management. The valuation is also able to describe advantages as well as disadvantages related to policy and managerial options for natural resources
CPFGXGPVWCNN[ECPDGGZRGEVGFVQCEJKGXGHCKTPGUUKPVJGFKUVTKDWVKQPQHDGPGſVU
derived from natural resource management.
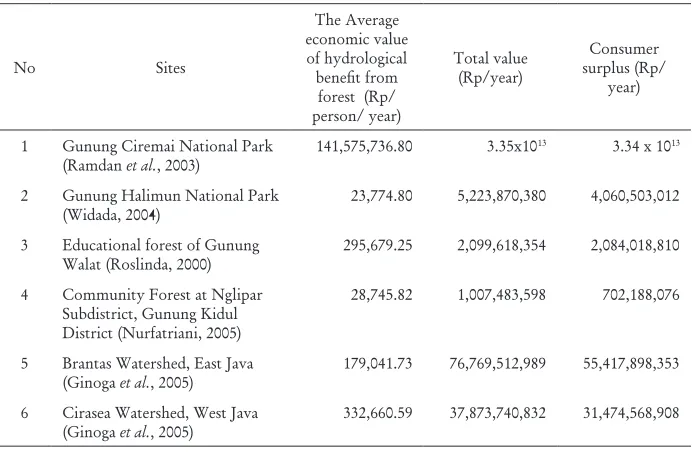
QHJ[FTQNQIKECNDGPGſVHTQO)WPWPI%KTGOCK0CVKQPCN2CTMKP9GUV,CXCHQT JQWUGJQNFWUCIG6JGCXGTCIGGEQPQOKEXCNWGYCU4RRGTUQP
year, in total it reached Rp. 3.35x10¹³[GCT6CDNGFGUETKDGUEQORNGVGN[UGXGTCN
UVWFKGUTGNCVGFVQVJGGEQPQOKEXCNWGQHJ[FTQNQIKECNDGPGſVHTQOHQTGUVU
Table 1. Forest hydrology value from several studies
No Sites
141,575,736.80 3.35x10¹³ 3.34 x 10¹³
2 )WPWPI*CNKOWP0CVKQPCN2CTM
#UUGUUKPI GEQPQOKE XCNWG QH VJG J[FTQNQIKECN DGPGſV HTQO HQTGUVU KU
useful for the development of management plan, allowing the integration of all marketable and non-marketable values derived from more scarce forest resources. This study is important as an element for policy recommendation for land use allocation especially in comparing between conservation, rehabilitation
QTGZRNQKVCVKQPQDLGEVKXGU6JGGEQPQOKEXCNWGQHJ[FTQNQIKECNDGPGſVHTQO HQTGUVUECPTGƀGEVUJQYKORQTVCPEGHQTGUVTGUQWTEGKUPQVQPN[HTQOOCTMGVCDNG
commodity but also from environmental services provided by forests.
6JKU RCRGT TGRQTVU VJG GEQPQOKE XCNWG QH J[FTQNQIKECN DGPGſV HTQO
protecting forests, using Upper Brantas watershed as a case. Brantas Sub-watershed was choosen as the research site according to Sub-watershed degradation that occurred at Brantas Sub-watershed currently. Meanwhile, it supports the life system for communities living surround Brantas Sub-watershed since it became the huge watershed in East Java. Hence, the information of the
Sub-watershed will be crucial to determine the direction of policy taken for improving the performance of Brantas Sub-watershed.
The scope of this study was limited to the calculation of hydrological
DGPGſVHTQOEQOOGTEKCNWUGUQHYCVGTHTQOVJGHQTGUVYJKEJKPENWFGFVCR
drinking water, hydro power generation, and industrial uses.
II. MATERIALS AND METHODS
This research combined the utilisation and full cost methods. In this study,
YCVGTYCUCUUWOGFVQDGCRTQFWEVQHRTQVGEVKPIHQTGUVU6JGſTUVUVGRYCUVQ
identify various uses of water resources followed by assessing forest resources including biophysical and socio-economic resources by quantifying any aspect indicating hydrological service provided by the forests. This will produce an estimation of the economic value of water for any usage based on market values.
The full cost of water provision was calculated by internalising environmental
EQUVU VQ DG RTQRQTVKQPCNN[ FKUVTKDWVGF VQ VJG WUGT DGPGſEKCT[RC[RTKPEKRNG
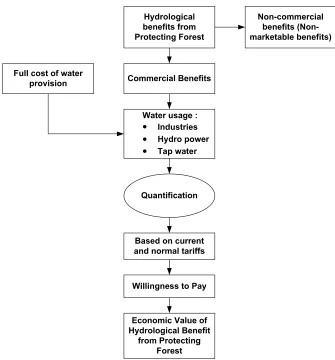
Hydrological benefits from Protecting Forest
Non-commercial benefits (Non-marketable benefits)
Commercial Benefits
Water usage : Industries Hydro power Tap water
Quantification
Based on current and normal tariffs
Willingness to Pay
Economic Value of Hydrological Benefit
from Protecting Forest Full cost of water
provision
Figure 1. Analytical framework for economic valuation of water for commercial use in the upper Brantas Sub-watershed
A. Research Sites
This research was conducted in Upper Brantas Sub-watershed, East Java from March to December 2006. Data for calculating the economic value of
YCVGTHQTEQOOGTEKCNWUGUYCUQDVCKPGFHTQO,CUC6KTVC+5VCVG'PVGTRTKUG2,6 +KP/CNCPI'CUV,CXC$TCPVCU5WDYCVGTUJGFKUWPFGTVJGCWVJQTKV[QH2,6+ YJKEJKUCUUKIPGFD[VJG)QXGTPOGPVVQRTQXKFGYCVGTHQTRTQFWEKPIJ[FTQ
ƀQQFCPFOCKPVCKPYCVGTSWCNKV[,CUC6KTVC+5VCVG'PVGTRTKUGYCUGUVCDNKUJGF VJTQWIJ)QXGTPOGPV4GIWNCVKQP220QYJKEJYCUTGPGYGFD[22 0Q
Forest management in upper Brantas Sub-watershed varied according to the forest function in each Sub-watershed. There are conservation and protection
HQTGUVU YJKEJ CTG OCPCIGF D[ (QTGUV 5GTXKEG 1HſEG KP 'CUV ,CXC 4 5QGTLQ (QTGUV2CTM(QTGUV5VCVG'PVGTRTKUGKP/CNCPI4GIKQPCPF$TQOQ6GPIIGT 5GOGTW 0CVKQPCN 2CTM QHſEG 6JQUG HQTGUVU JCXG C UKIPKſECPV TQNG CU C NKHG
support system for livelihood in Brantas sub-watershed. The important role of
VJGHQTGUVKUCUCECVEJOGPVCTGCVJCVDGPGſVEQOOWPKV[YJQNKXGUWTTQWPFVJG HQTGUV6JGTGCTGUGXGTCNURTKPIUUWTTQWPFKPIVJGHQTGUVYJKEJƀQYVJGYCVGT
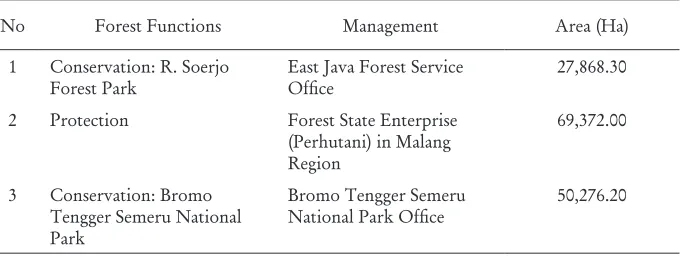
for household and agricultural usage. Table 2 describes the type and function of the forest, and forest manager institutions.
Table 2. Forests area in upper Brantas sub-watershed
No Forest Functions Management #TGC*C
1 %QPUGTXCVKQP45QGTLQ
Forest Park
East Java Forest Service
1HſEG
27,868.30
2 Protection Forest State Enterprise
2GTJWVCPKKP/CNCPI
Region
69,372.00
3 %QPUGTXCVKQP$TQOQ
Tengger Semeru National Park
Bromo Tengger Semeru
0CVKQPCN2CTM1HſEG
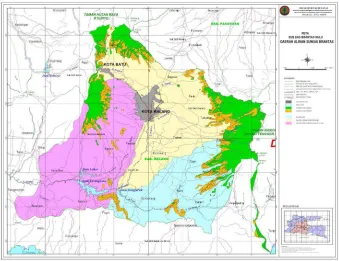
Figure 2. /CRQHWRRGT$TCPVCUUWDYCVGTUJGFUQWTEG$2$TCPVCU
B. Data Collection
The primary data were obtained through semi-structured interviews of respondents and by observations, while the secondary data were gathered from
NKVGTCVWTGTGXKGYUCPFTGHGTGPEGURTQXKFGFD[TGNCVGFKPUVKVWVKQPU,CUC6KTVC 5VCVG'PVGTRKUG2,6+5VCVG'NGEVTKEKV['PVGTRTKUG2.0.QECN)QXGTPOGPV 1YPGF9CVGT'PVGTRTKUG2&#/%CVEJOGPV#TGC/CPCIGOGPV#WVJQTKV[ $2;CVGT/CPCIGOGPV#WVJQTKV[&KPCU2GPICKTCP5VCVG9QTMU&KPCU 2GMGTLCCP7OWO.QECN#WVJQTKV[HQT'PXKTQPOGPVCN+ORCEV/CPCIGOGPV $#22'&#.&#
C. Data Analysis
6JGGEQPQOKEXCNWCVKQPQHJ[FTQNQIKECNDGPGſVUHTQORTQVGEVKPIHQTGUVHQT UGXGTCNEQOOGTEKCNWUGUYCUEQPFWEVGFWUKPIVJGOCTMGVXCNWGOGVJQF$KUJQR 6JKUOGVJQFTGSWKTGFVJGOCTMGVXCNWGQHYCVGTCPFPQTOCNVCTKHHQH
Environmental externalities
Full cost Sustainable use value Economic externalities
Total economic
cost
1RRQTVWPKV[EQUV
%QUVQH
capital
Full supply cost
1RGTCVKPI
cost
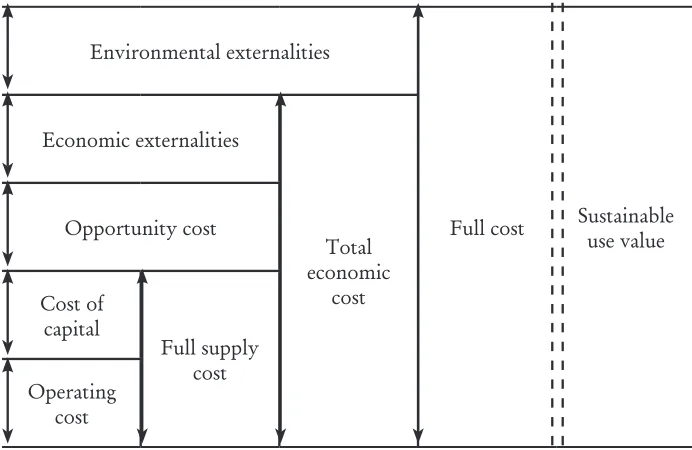
Figure 3. %CNEWNCVKQPQHVJGYCVGTRTQXKUKQPHWNNEQUV4QIGTUet al.,
1. %CNEWNCVKQPQHEQUVURCKFD[WUGTU
The cost that should be paid by every user was calculated through
OWNVKRNKECVKQPQHVJGDGPGſVRTQRQTVKQPRTQFWEGFD[WUGTYKVJVJGHWNNEQUVQH
water provision as expressed in the following formula:
UCi = a% x FC ...
where:
7%i %QUVRCKFD[WUGTK
C $GPGſVRTQRQTVKQPRTQFWEGFD[WUGT
BP = Full cost of water provision 2. %CNEWNCVKQPQHVJGPQTOCNVCTKHH
NT = UCi ...
Qi
where,
NT = Normal tariff
Qi 9CVGTXQNWOGYCVVCIGQHGNGEVTKEKV[
3. Environmental value
The difference between the current tariff and the normal tariff was considered as an environmental value, which was obtained using the following formula:
EV = (NT-CT) x Qi...
where,
EV = Environmental value
%6 %WTTGPVVCTKHH
4. Values of water for industries, hydro power and tap water
6JG XCNWG QH YCVGT HQT KPFWUVTKGU KU FGſPGF CU VJG XCNWG QH YCVGT WUCIG
for industrial purposes, under an assumption that the water is sourced from a dam collecting water produced by forests in the Upper Brantas Sub-watershed.
.KMGYKUGYKVJVJGXCNWGUQHYCVGTHQTJ[FTQRQYGTIGPGTCVKQPCPFVCRYCVGT
Those values were calculated using Formula 4, 5 and 6, respectively.
VWI = QWI x PWI...
where,
V9+ 8CNWGQHYCVGTHQTKPFWUVTKGU4R[GCT
Q9+ 8QNWOGQHYCVGTFGOCPFGFD[KPFWUVTKGUO3
P9+ = Normal tariff of water for industries - current tariff of water for
KPFWUVTKGU4RO3
VWH = QE x PWH...
where,
V9* 8CNWGQHYCVGTHQTJ[FTQRQYGT4R[GCT
QE 'NGEVTKEKV[QWVRWVM9J
P9* = Normal tariff of water for hydro power - current tariff of water for
VWT = QWT x PWT...
where,
V96 8CNWGQHYCVGTHQTVCRYCVGT4R[GCT
Q96 8QNWOGQHVCRYCVGTRTQFWEGFO3
P96 = Normal tariff of water for tap water - current tariff of water for tap
YCVGT4RO3
III. RESULTS AND DISCUSSION
The utilisation of water for commercial purposes in Indonesia can be valued on the basis of market price, in the form of a tariff. In the case of Brantas Sub-watershed, the tariff was determined by the government. However, in practice,
VJGDGPGſVFGTKXGFHTQOVJGVCTKHHFGVGTOKPCVKQPEQWNFPQVOGGVVJGQRGTCVKPI EQUV+FTWU
A. 'EQPQOKE8CNWGQH*[FTQNQIKECN$GPGſVHTQO2TQVGEVKPI(QTGUVKP5WD
$TCPVCU5WDYCVGTUJGFWUKPIVJG(WNN%QUV/GVJQF
Rogers et al. RTQRQUGFCOGVJQFVQECNEWNCVGVJGTGCNXCNWGQHYCVGT
i.e. sustainable use value. The method calculated all costs for producing and distributing the water to different types of consumers. The costs included operational and maintenance cost, capital cost, opportuniy cost, and costs expended for environmental rehabilitation as the production process may result in environmental degradation. Hence the value of water has internalised externalities. The following sections discuss how each type of cost was calculated in order to have the total value of water.
1. 1RGTCVKPICPFOCKPVGPCPEGEQUVUQH,CUC6KTVC+5VCVG'PVGTRTKUG
1RGTCVKQPCNCEVKXKVKGUEQPFWEVGFD[2,6+KPENWFGFYCVGTCNNQECVKQP KTTKICVKQPCWFKVTKXGTCWFKVƀQQFEQPVTQNYCVGTSWCNKV[CWFKV QDUGTXCVKQPQHJ[FTQOGVGQTQNQI[CPFFCVCTGRQTVCPFGXCNWCVKQP/GCPYJKNG OCKPVGPCPEGCEVKXKVKGUKP2,6+KPENWFGGTQUKQPCPFUGFKOGPVCVKQPEQPVTQN TKXGTDCPMUOCKPVGPCPEGCPFOCKPKPHTCUVTWEVWTGOCKPVGPCPEGKPENWFKPI
dam, tunnel and check dams. The operational and maintenance costs in 2001 reached Rp. 95.13 billions and Rp. 106.68 billions in 2005.
KPƀWGPEGFD[UGXGTCNHCEVQTUUWEJCUKPƀCVKQPOKPKOWOYCIGUCPFDWKNFKPIU
The normal cost also tends to increase as the quality of water decreased and conservation activities increased. According to PJT I document, the operating and maintenance cost was predicted to increase 1-2% annually from investment cost. Unfortunately, due to limited budget, PJT I could not implement all activies required to maintain their facilities.
2. %QUVQHECRKVCN
6JGEQUVQHECRKVCNKUFGſPGFCUVJGEQUVHQTDWKNFKPIKTTKICVKQPHCEKNKVKGU
which are considered as the asset of PJT I. The facilities include dams, tunnels, channels and pump stations. The value of the capital is the value when the facilities were built. As the facilities were built partly using foreign currency
75 CPF f VJG XCNWG KU EQPXGTVGF VQ +PFQPGUKCP 4WRKCJ 4R WUKPI VJG EWTTGPVTCVG#P[EQUVRCKFKP4WRKCJKUVJGPKPƀCVGFWUKPIRTKEGKPFKEGU6JG
value of capital owned by PJT I in 2005 was Rp. 8.6 trillion, or reaching Rp. 154 billion per annum.
3. 1RRQTVWPKV[EQUV
The opportunity cost of producing water for several purposes is considered
\GTQUKPEGVJGTGKUPQDGVVGTQRVKQPVQVJGEWTTGPVCNVGTPCVKXG6JGEWTTGPV CNVGTPCVKXGYJKEJKUKPENWFGFJ[FTQRQYGTVCRYCVGTKPFWUVT[KTTKICVKQPƀQQF
management, water quality and management is better than other alternatives such as tourism and aquaculture.
4. Economic externalities
%QUVU QT DGPGſVU ECWUGF D[ HQTGUV FGITCFCVKQP QT KORTQXGOGPV KP VJG
upstream will be paid or received by people in the downstream. This is considered as economic externalities. Hence, economic externalities may have positive or negative impacts.
In this research, the economic externalities are approached through sedimentation of dam caused by erosion due to forest degradation. The value is obtained from the change in the cost paid by tap water provider per cubic
OGVGTOWNVKRNKGFD[VJGXQNWOGRTQFWEGFD[VJGRTQXKFGT5WRCTOQMQ
The increase in production cost of water is mainly due to the increase in the amount of chemical addition needed as the quality of water is becoming
NQYGT+PRCTVKEWNCTVJGYCVGTEQPVCKPUJKIJNGXGNQHHGTTWO(GVJGTGHQTG
TGƀGEVGFD[VJGKTKPETGCUGKPRTQFWEVKQPEQUV6CDNGUJQYUJQYVJGECNEWNCVKQP
is conducted.
Table 3. Economic externalities due to forest degradation
Year %QUVQHYCVGT
2004 77,731,913,877 234,211,213 277
14
2005 81,766,917,250 236,513,683 291 3,270,840,985
State water company at Malang
Regency
2004 114,218,408 29,910,000 3.82
4.96
2005 118,468,415 13,490,000 8.78 66,953,660
Average 1,668,897,323
Source:2&#/-QVC5WTCDC[CCPF2&#/-CD/CNCPI
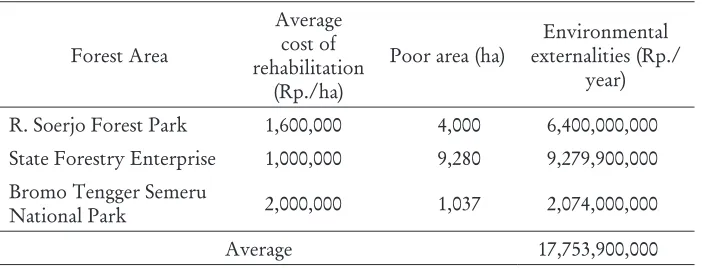
5. Environmental externalities
The cost of environmental externalities is approached using environmental rehabilitation activities as a minimum prediction for environmental degradation
4QIGTUet al., 6JGFGITCFCVKQPQH7RRGT$TCPVCU5WDYCVGTUJGFYCU KFGPVKſGFHTQOVJGCTGCQHRQQTNCPFUKP45QGTLQ(QTGUV2CTM$TQOQ6GPIIGT 5GOGTW0CVKQPCN2CTM60$65CPFRTQVGEVGFCTGCUYKVJKPRTQFWEVKQPHQTGUVU
managed by State Forestry Enterprise. Table 4 shows the calculation of environmental externalities.
Table 4. Environmnetal externalities due to forest degradation
Forest Area
The average cost of rehabilitation is calculated from several activities including planting wages, supplies, transport and seedlings. The value of environmental
GZVGTPCNKVKGUTGƀGEVUGEQPQOKEXCNWGQHGPXKTQPOGPVCNFGITCFCVKQPVJCVJCUVQ
be returned to the upstream to revive the functions of the forest.
B. Full Cost
From the previous calculations through several approaches, the value of water based on the full cost method is represented in Figure 3.
Environmenta externalities = 17.75
Full cost = 316.22
Sustainable use value Economic externalities =
1.67
Total economic cost = 269.8
1RRQTVWPKV[EQUV
%QUVQH
capital = 154
Full supply cost = 269.8
1RGTCVKPI
cost = 142.8
Source: Adapted from Rogers et al. (1996)
Figure 4. Full cost of water supply at Brantas Hulu – billion Rp. per annum
The full cost for providing water, Rp. 316.22 billion per annum, can be used as a basis for determining water tariff as the cost has covered the value of water utilisations along the stream. The tariff is calculated by allocating the
HWNNEQUVRTQRQTVKQPCNN[VQVJGWUGTUWUKPIUKORNKſGFDGPGſVDCUGFOGVJQFYKVJ
Table 5. 2TQRQTVKQPQHDGPGſVCPFEQUVVJCVJCUVQDGRCKFD[WUGT
Use 2GTEGPVCIGQHDGPGſV Allocated cost
4RDKNNKQP[GCT
a. Electricity 36.20 114.47
b. Tap water 18.17 57.46
c. Industries 24.70 78.11
Sub total 79.07 250.04
d. Irrigation 18.27 57.77
e. Flood control 0.83 2.62
H9CVGTSWCNKV[ 1.83 5.79
Sub total 20.93 66.19
Total 100.00 316.22
Source:2,6+4GECNEWNCVGF
+TTKICVKQPƀQQFEQPVTQNCPFYCVGTSWCNKV[CWFKVCTGCEVKXKVKGUCUUKIPGFD[ VJGIQXGTPOGPVVQ2,6+CURWDNKEUGTXKEGU6JGDGPGſVXCNWGQHKTTKICVKQPKU
obtained from the revenue resulting from agricultural land using the irrigation
YCVGT6JGXCNWGQHƀQQFEQPVTQNKUQDVCKPGFHTQOVJGTGFWEVKQPQHNQUVFWGVQ ƀQQFKPIRTGXGPVKQP6JGYCVGTSWCNKV[KUXCNWGFHTQOYCVGTWUGFHQTTGFWEKPI
erosion and sedimentation.
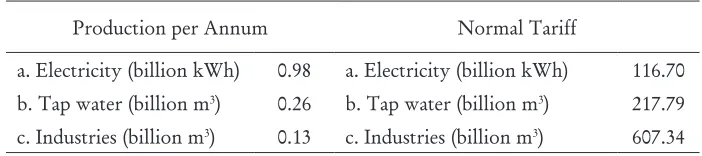
By averaging production volumes for each usage, a normal tariff is then obtained. The tariff is calculated by dividing the cost with by the volume. Table 6 shows the normal tariffs for each usage.
Table 6. Production and normal tariff for several purposes
Production per Annum Normal Tariff
C'NGEVTKEKV[DKNNKQPM9J 0.98 C'NGEVTKEKV[DKNNKQPM9J 116.70
D6CRYCVGTDKNNKQPO3 0.26 D6CRYCVGTDKNNKQPO3 217.79
therefore the difference between the two types of tariff is considered as the environmental value that should be returned to the upstream.
IV. CONCLUSIONS AND RECOMMENDATIONS
6JGXCNWGQHJ[FTQNQIKECNDGPGſVUHTQORTQVGEVKPIHQTGUVECPDGCUUGUUGF
using a combination of the full cost method and the multiple uses method.
6JGTGUGCTEJTGXGCNUVJCVVJGXCNWGQHDGPGſVKUJKIJGTVJCPEWTTGPVWUGTURCKF HQTTGƀGEVGFD[VJGJKIJGTPQOKPCNXCNWGQHVJGPQTOCNVCTKHHUCUEQORCTGFVQ
that of current tariffs. This leads to a policy implication that the government may increase the tarrifs for water supplied by PJT I, which in turn will enable an increase in the budget for environmental conservation and rehabilitation.
;GVKVKUTGCNKUGFVJCVVJGRQNKE[KUFKHſEWNVVQKORNGOGPVCUVJGPCVKQPCN
economy is not adequately condusive. However, gradual internalisation of the
GZVGTPCNKVKGUYKNNCNUQJGNRVJGPCVWTCNTGUQWTEGUVQRTQXKFGDGPGſVUWUVCKPCDN[
and eventually contribute to the economic development.
REFERENCES
Bishop JT. 1999. Valuing forests: A review of methods and applications in developing countries. International Institute for Environment and
&GXGNQROGPV.QPFQP
Darusman, D. 1993. Nilai ekonomi air untuk pertanian dan rumah tangga: studi
MCUWUFKUGMKVCT6COCP0CUKQPCN)WPWPI)GFG2CPITCPIQ/CMCNCJRCFC
Simposium Nasional Permasalahan Air di Indonesia di Institut Teknologi Bandung.
Idrus, H. 2005. Kajian pemberlakuan tarif dalam bidang usaha di Perum Jasa Tirta II. Perusahaan Umum Jasa Tirta II.
)KPQIC-(0WTHCVTKCPK;%9WNCP&&LWPCGFK/.WIKPCCPF%$
Darmi. 2005. Kajian nilai ekonomi manfaat hidrologis hutan lindung.
.CRQTCP*CUKN2GPGNKVKCP2WUNKV5QUKCN'MQPQOKFCP-GDKLCMCP-GJWVCPCP
Bogor.
Nurfatriani, F. 2005. 0KNCKGMQPQOKMCYCUCP[CPIFKTGJCDKNKVCUK*WVCPFCP .CJCP5VWFK-CUWU2TQ[GM4*.-GECOCVCP0INKRCT-CDWRCVGP)WPWPI
Kidul, Di Yogyakarta. Karya Siswa Program Master. IPB.
Perum Jasa Tirta I. 2005a. Usulan penyesuaian tarif biaya jasa pengelolaan
UWODGT FC[C CKT FJ +WTCP RGODKC[CCP 12 RTCUCTCPC RGPICKTCP FK
Perum Jasa Tirta I. 2005b. Usulan penyesuaian tarif biaya jasa pengelolaan sumber daya air di wilayah Sungai Kali Brantas tahun 2006 untuk pembangkitan listrik. Perum Jasa Tirta I. Tidak Diterbitkan.
2GTWO,CUC6KTVC+E-GYCLKDCPRGNC[CPCPWOWO-27CVCWRWDNKE UGTXKEGQDNKICVKQP251FCNCORGPIGNQNCCPUWODGTFC[CCKTFKYKNC[CJMGTLC
Perum Jasa Tirta I Tahun 2005. Perum Jasa Tirta I. Tidak Diterbitkan. Perum Jasa Tirta I. 2005d. Pedoman operasi dan pemeliharaan di DAS kali
Brantas. Perum Jasa Tirta I. Tidak Diterbitkan.
Ramdan, H., Yusran dan D. Darusman. 2003. Pengelolaan Sumberdaya Alam
FCP 1VQPQOK &CGTCJ 2GTURGMVKH -GDKLCMCP FCP 8CNWCUK 'MQPQOK
Alqaprint, Jatinangor, Sumedang.
4QIGTU 2 4 $JCVKC FCP # *WDGT 9CVGT CU C UQUKCN CPF GEQPQOKE IQQF*QYVQRWVVJGRTKPEKRNGKPVQRTCEVKEG)NQDCN9CVGT2CTVPGTUJKR 6GEJPKECN#FXKUQT[%QOOKVVGG7PRWDNKUJGF
4QUNKPFC ' 0KNCK GMQPQOK JWVCP RGPFKFKMCP )WPWPI 9CNCV FCP
kontribusinya terhadap masyarakat sekitar [tesis]. Bogor: Institut Pertanian Bogor, Program Studi Ilmu Pengetahuan Kehutanan.
Suparmoko. 2002. Buku Pedoman Penilaian Ekonomi: Sumberdaya Alam