The 4
th
Report of the
National Eye Database
2010
port
of the
National Eye
Database
Sponsors:
Clinical Research Center Ministry of Health
The National Eye Database is funded with grants from:
April 2012©
Telephone : 603-61203233 Ext.: 4169 Fax : 603-61202761
Email : [email protected]
Website : http://www.acrm.org.my/ned
Important information
The Fourth Report of the National Eye Database is the copyright of Ophthalmology Sevice, Ministry of Health and Clinical Research Centre. We are happy for our materials to be downloaded, printed out, copied, used and distributed free of charge for non-commercial purposes only. Where our materials are copied, used or distributed, the source of the material must be identified and the copyright status acknowledged. No alteration or adaptation of any of the materials may be made without obtaining the permission of the steering committee of National Eye Database. Reproduction
or distribution of materials either in whole or in part for a commercial purpose is prohibited without the prior written
permission of steering committee of National Eye Database.
Suggested citation is:
Mohamad Aziz Salowi, Goh PP (Eds). Fourth Report of the National Eye Database 2010, Kuala Lumpur 2012. This report is published electronically on the website of the national eye database at: http://acrm.org.my/ned
Disclaimer
ACKNOWLEDGEMENTS
Acknowledgements
The National Eye Database (NED) would like thank each and everyone who have directly or indirectly contributed to the success of the National Eye Database.
In particular we would like to thank the following:
1. Ophthalmologists, heads of MOH Ophthalmology Departments, doctors in-charge, site coordinators mainly optometrists and paramedics at all the 36 MOH hospitals with ophthalmology service and resident optometrists at district hospitals without ophthalmologists. Thank you for being the source data providers for NED. The success of NED depends on you.
2. Staff Nurse Teng Kam Yoke, NED clinical registry manager at Registry Coordinating Centre.
3. The Division of Research and Technology Support, Ministry of Health, for financial support.
4. The Patient Registry Unit, Clinical Research Centre, MOH, namely Dr. Jaya Purany Stanley Ponniah and Mr. Naren Kumar A/L Surendra for technical support.
5. Information technology personnel namely Ms Lim Jie Ying, database administrator, Ms Amy Porle, web application programmer, Ms Azizah Alimat, desktop publisher and Ms Huziana Fauzi, clinical data assistant.
6. Statisticians Puan Tassha Hilda bt Adnan, Puan Evi Diana, Miss Nur Amirah bt Zolkepali.
7. Alcon Laboratories Sdn Bhd and Novartis for providing financial support.
Last but not least, the Director-General of Health for the permission to publish this report.
Thank you.
NED Steering Committee Members
ii
THE 4
thREPORT OF THE NATIONAL EYE DATABASE 2010
Chairperson Dr Goh Pik PinDirector, Clinical Research Centre, MOH
Members Dr Mariam Ismail
Vitreoretinal Consultant,
Hospital Sultanah Nur Zahirah, K. Terengganu
Dr Mohamad Aziz Salowi
Secretariat Teng Kam Yoke
Ophthalmic trained staff nurse,
ABOUT NATIONAL EYE DATABASE
About nAtionAl eye dAtAbAse
Introduction
The National Eye Database (NED) is an eye health information system supported by MOH. It is a clinical database consisting of six patient registries and a monthly ophthalmology service census. The patient registries are Cataract Surgery Registry, Diabetic Eye Registry, Contact Lens-Related Corneal Ulcer Surveillance, Glaucoma Registry, Retinoblastoma Registry, and Age Related Macular Degeneration Registry. The source data producers are eye care providers, currently from the public. Information collected, both clinical and epidemiological, are very useful in assisting the MOH, Non-Governmental Organizations, private healthcare providers and industry in the planning, evaluation and continuous improvement of eye care services, leading to prevention and control of blindness in the nation.
Vision
An accessible eye health information.
General Objectives of the National Eye Databases
1. To establish and maintain a web based eye health information system on natural history of visual threatening eye diseases, which are of public health importance. The information is useful in the planning and evaluation of eye care service.
2. To determine the effectiveness of treatment, both clinical outcomes and cost, and to identify factors influencing outcomes. This serves the needs of outcome assessment.
3. To provide information necessary to evaluate ophthalmology services through census and key performance indicators, as well as on safety or harm of products and services used in the treatment of a disease. This contributes to continuous quality initiative.
4. To evaluate the accessibility and equity in health care provision. This information enhances accountability. 5. To provide a mean of prompt and wide dissemination of epidemiological and clinical information through web such
as real time registries reports and notification of epidemic of contact lens-related corneal ulcer. This is essential for public health advocacy.
6. To stimulate and facilitate research on eye diseases.
Cataract Surgery Registry
The Cataract Surgery Registry (CSR) was initiated in 2002 and collects data pertaining to patients who have had cataract surgery. Data collected include demography, medical history, operative events, post-operative visual outcomes and probable causes for poor outcome. Since 2008, data on posterior capsular rupture, visual outcome and post-operative endophthalmitis were linked to online key performance indicator for monitoring centre performance while data on incidence of posterior capsular rupture and patients with poor visual outcome are linked to online cumulative sum (CUSUM) to monitor competency of individual surgeon. Annual reports for the year 2002, 2003, 2004 and 2007 are available at www.acrm.org.my/ned, under the section of publication.
Speciic Objectives
1. To determine the frequency, distribution and practice pattern of cataract surgery in Malaysia. 2. To determine the outcomes and factors influencing outcomes of cataract surgery.
3. To evaluate cataract surgery services based on rate of posterior capsular rupture, post-operative infection, post-operative visual outcome and induced astigmatism. 4. To stimulate and facilitate research on cataract and its management.
Retinoblastoma Registry
Retinoblastoma registry collects data on the pattern of clinical presentation, mode of treatment and outcome of patients with retinoblastoma seen at ophthalmology clinics with paediatric ophthalmology service. The main SDP is Hospital Kuala Lumpur.
Speciic Objectives
1. To determine the incidence and distribution of retinoblastoma in different states in Malaysia. 2. To determine the ethnic-specific prevalence of retinoblastoma in Malaysia.
3. To study characteristics of RB patients in terms of clinical presentation and stage of disease based on International Intraocular Retinoblastoma Classification. 4. To evaluate types of treatments and monitor treatment trends.
iv
THE 4
thREPORT OF THE NATIONAL EYE DATABASE 2010
ABOUT NATIONAL EYE DATABASE
Age Related Macular Degeneration Registry
Age Related Macular Degeneration (AMD) registry collects data on demographics, risk factors, clinical features and methods of treatment used in newly diagnosed patients with AMD. Hospital Selayang is the only SDP in 2008.
Speciic Objectives
1. To determine patients’ characteristics, risk factors and clinical presentation of AMD. 2. To study types of AMD based on clinical and investigative examinations.
3. To evaluate quality of life among AMD patients. 4. To evaluate types of treatments given to patients.
Monthly Ophthalmology Service Census
Since 2002, Ophthalmology Service of MOH has been collecting annual census from all the hospitals with ophthalmology departments. Data include essential service census and key performance indicators for ophthalmology service. There are 13 sections in the census return, namely out-patients, inpatients, major eye operations, cataract service, diabetic service, glaucoma service, and optometry service, and subspecialty services which include vitreoretinal, corneal, paediatric ophthalmology, oculoplasty, medical retinal, and a public health ophthalmology, and data on training records and prevention of blindness activities. Data are entered monthly by staff at sites via on-line data entry. Heads of ophthalmology department can view their own and other hospitals’ real-time reports.
Speciic Objectives
1. To evaluate service output in all ophthalmology departments. 2. To study trends in service output and service patterns.
3. To get baseline and norm from services provided by MOH ophthalmology departments.
4. To determine norm and set standards for performance indicators for centres which differ in strength of physical
and human resources.
CUSUM-Ophthalmology
Cataract surgery is the most common procedure done in ophthalmology departments. The procedure is quite consistent and outcome is measured by visual acuity. Cataract surgery outcome depends greatly on surgeons’ skill. With advancement in technology and intraocular lens implantation, good visual outcome is almost certain among patients without pre-existing ocular co-morbidity. Hence, monitoring and evaluating surgeons’ competency, especially trainees’ performance, are essential in ensuring standard of care.
Cumulative Sum (CUSUM) software auto-mine data on occurrence of posterior capsular rupture and patients with post-operative vision worse then 6/12 from cataract surgery registry on surgery done by individual surgeon using unique surgeon ID. From 2008, by using individual unique username and password, surgeon can access his/her own CUSUM charts via eCUSUM web page. Consultant ophthalmologists can view their own as well as their trainees’ charts. By doing so, monitoring on surgeons’ competency in cataract surgery is made most effectively and easily.
Key Performance Indicator
The Ministry of Health (MOH) launched the implementation of Key Performance Indicators (KPIs) in February 2008 with the aim to assess the overall performance of services provided by Clinical Departments in MOH. The MOH Ophthalmology Service has identified eight KPIs which measure clinical performance of core ophthalmology service such as out-patient service, cataract surgery and diabetic eye screening.
ABOUT NATIONAL EYE DATABASE
Ophthalmology Service KPIs:
Aspect of Performance : QUALITY & SAFETY
Dimension : Patient-focused Care Optimal Target / Standard
No. 1 Waiting time to see a doctor at the Specialist Clinic > 90% of the patients are seen
within ninety (90) minutes No. 2 Waiting Time to get an appointment for First Consultation
for Diabetic Patients at the Specialist Clinic
> 80% of the patients are given an appointment for First
Consultation within 6 weeks
No. 3 Waiting Time for Cataract Surgery > 80% of patients have appointment given
for cataract surgery within 16 weeks
Dimension : Clinical Efectiveness & Risk Management
No. 4 Rate of Infectious Endophthalmitis following Cataract Surgery < 0.2% (2 cases per 1000 operations)
No. 5 Rate of Posterior Capsular Rupture during Cataract Surgery < 3 % (50 cases per 1000 operations) No. 6 Rate of Post-operative Visual Acuity of 6/12 or
better within 3 months following Cataract Surgery in Patients without Ocular Co-morbidity
> 85 % (850 cases per 1000 operations)*
No. 7 Average Frequency of Mortality / Morbidity Review being
Conducted in Ophthalmology Department Monthly At least 6 times in 6 months
Aspect Of Performance : PRODUCTIVITY Dimension : Workload
No. 8 Percentage of Out-patients seen by Specialist
in specialist clinic per Month
To be decided
The NED website also has interactive online registry charting that allows public users to review data captured in cataract surgery registry and adverse incident reporting to notify defect in intraocular lens (IOL) noted during or after cataract surgery by public and private eye care providers, an initiative to promote patient safety.
Methods of the National Eye Database
The National Eye Database is designed as a cohort study. It is an online clinical database hosted at the Association of Clinical Registry Malaysia website at www.acrm.org.my/ned. Its protocol was approved by the Medical Research Ethical Committee of MOH on 2nd September 2008 (reference number NMRR 08-552-1707) and is accessible at the NED website.
Data collection and data entry are done at SDP sites. Data are collected either using case report forms (CRF) which are later entered into the web application, or are directly entered into the web application during the course of clinical work.
Data management using data query are set in the web application to reduce inconsistency, out-of-range or missing values. Authorised staff at each SDP is given passwords to perform data entry. Individual SDP reports and aggregated reports based on cumulative data of all SDPs are available real-time at NED website. These reports are only accessible by heads of department, doctors-in-charge and site coordinators via authorised password. The web reports are descriptive analysis of data which have been entered. Annual statistical report will be produced based on data collected for a specific year. The statistical reports will be published yearly and distributed to users in MOH divisions and units, all the ophthalmology departments, universities, other relevant public agencies and non-governmental organisations.
vi
THE 4
thREPORT OF THE NATIONAL EYE DATABASE 2010
• Independent data monitoring • Outcome evaluation
NED SOURCE DATA PROVIDERS
ned source dAtA Providers
List of doctors in charge & site coordinator for 2010
Northern Zone
No. SDP Doctor-in-charge Site Coordinator
1. Hospital Kangar Dr Noram Azian bin Ramli Roslinda bt Rahman
2. Hospital Sultanah Bahiyah Dr Lee Annie Nur Diana Mohd Zani
3. Hospital Sungai Petani Dr Nor’aini Ramlee Juliana Md Desa
4. Hospital Pulau Pinang Dr Ang Ee Ling Noor Asmah Md Azmi
5. Hospital Bukit Mertajam Dr Ng Seok Hui Marhaini Othman
6. Hospital Ipoh Dr Ummi Kalsom Noraini Harith
7. Hospital Taiping Dr Ng Sok Lin Rohaiza bt Abdul Hamid
8. Hospital Teluk Intan Dr Mimi Marina Adawiyah Ismail
9. Hospital Sri Manjung Dr Yushaniza Yaacob Juhaida bt Zahri
Central Zone
No. SDP Doctor-in-charge Site Coordinator
10. Hospital Kuala Lumpur Dr Rohanah Alias Intan Khusiah Abd Rahman
11. Hospital Putrajaya Dr Salmah Othman Lily Muhanifa Mustafa
12. Hospital Selayang Dr Haireen Kamaruddin Nurul Aini Yusoff
13. Hospital Tengku Ampuan Rahimah Dr Fiona Chew Lee Min Najihah Muhammad Sharif
14. Hospital Serdang Dr Zaida Mohd Kasim Yusrina Mohamat Hata
15. Hospital Sungai Buloh Dr. Chan U-Teng Majidah Zainal Abidin
16. Hospital Ampang Dr Zalifa Zakiah bt Asnir Noriah binti Abdullah
Southern Zone
No SDP Doctor in charge Site Coordinator
17. Hospital Tuanku Jaafar Dr Norlelawati Abu Normalisa Muhammad Som
18. Hospital Tuanku Ampuan Najihah Kuala Pilah Dr Khairul Husnaini binti Mohd Khalid Nazura Selamat
19. Hospital Melaka Dr Juliana Jalaluddin Eryanti Md Omar
20. Hospital Sultanah Aminah Dr Kevin Ong Nurazilah Ismail
21. Hospital Pakar Sultanah Fatimah Dr Ngim You Siang Roziana Sumardi
22. Hospital Batu Pahat Dr. Liu Han Seng Nur Adilah Abdullah
23 Hospital Sultan Ismail Dr Hooi Siew Tong Nursalinah bt Adam
viii
THE 4
thREPORT OF THE NATIONAL EYE DATABASE 2010
NED SOURCE DATA PROVIDERS
Southern Zone
No SDP Doctor in charge Site Coordinator
25. Hospital Temerloh Dr Fatimah Suhaila Sukaimi Nor Hanim Ahmad Adnan
26. Hospital Kuala Terengganu Dr Nor Anita Che Omar Noor Hayati Mohammad
27. Hospital Kota Bharu Dr Azma Azalina Ahmad Alwi Rossaidah bt Mustapa
28. Hospital Kuala Krai Dr. Hj Abdul Mutalib Othman Farawahida Fakaruddin
East Malaysia Zone –Sarawak
No SDP Doctor-in-charge Site Coordinator
29. Hospital Umum Sarawak Dr Mohamad Aziz Salowi Nazirin bin Arshad
30. Hospital Sibu Mohammad Ridzwan Bihem
31. Hospital Bintulu Dr KM Reddy Mohd Zharif Mohd Nor
32. Hospital Miri Dr Chieng Lee Ling Nur Hafizah Mat Jalil
East Malaysia Zone –Sabah
No SDP Doctor-in-charge Site Coordinator
33. Hospital Queen Elizabeth Dr Chin Kelvin Iramayanah Ambo Mase
34. Hospital Duchess Of Kent Dr Suriana Suaibun Norhafizah Abd Razik
35. Hospital Tawau Dr Ajit Majumder Arni Rehny Ahmad Rakhli
FOREWORD
Foreword
The fourth National Eye Database (NED) report for the year 2010 has finally been published. The 7-year results in the key registry in particular the cataract surgery registry (CSR) showed an encouraging trend. This hopefully represented the actual parallel improvement in the provision of cataract services by the participating source data producers (SDPs). The percentage of intra-operative complication such as posterior capsular rupture (PCR) and the occurrence of post-operative infectious endophthalmitis were decreasing.
As in past reports, we would like to reemphasize the importance of ascertainment in NED. Although the cumulative results were improving, poor ascertainment was still the major issue in certain SDP. Besides producing inaccurate data due to missing or underreported denominators, poor ascertainment might have resulted in the possible underreporting of important intra-operative complication for example PCR or poor visual outcome to NED.
In the year 2010, NED continued to play its role as the main ophthalmology database in the country. But in future, NED will expand its role as a platform for research and publication to be done not only by the MOH staff but by other eye care providers from academic institutions and private centre as well. Hence we would sincerely like to invite the participation of the universities and the private sectors, especially to the cataract surgery registry. The reason is that participation by all ophthalmology centres in the country will give a better representation of national status of eye diseases captured in this NED such as aged-related macular degeneration and retinoblastoma and also cataract surgery practice pattern and outcome.
Data in NED have increasingly been used to formulate healthcare plan and policy of ophthalmology services in the country. The satellite cataract services and the Klinik Rawatan Katarak Bergerak 1Malaysia (KRKB1M) used data from cataract surgery registry in their proposal. We also foresee that NED data will be used in the prevention of blindness activities in the country.
We would like to emphasize that the rich data collected in NED can be utilized by all level of users for many purposes. People who want to access the data just need to write to NED steering committee for approval. We appeal to all ophthalmologists to join us as editor to the annual report and encourage them to do further research on the data collected and publish the findings at peer-reviewed journals.
Thank you.
NED Advisor NED Chairperson
……… ……….
Dr Elias Hussein Dr Goh Pik Pin
Head, Director,
Ophthalmology service (2010- till date) Clinical research Centre
x
THE 4
thREPORT OF THE NATIONAL EYE DATABASE 2010
PDR Proliferative Diabetic Retinopathy
CONTENT
content
ACKNOWLEDGEMENTS ... i
NED STEERING COMMITTEE MEMBERS 2010 ... ii
ABOUT NATIONAL EYE DATABASE ... iii
NED ORGANIZATION ... vi NED SOURCE DATA PROVIDERS ... vii FOREWORD ... ix CHAPTER 1: CATARACT SURGERY REGISTRY ... 1
1.1 Stock and flow ... 2
1.2 Characteristics of patient ... 5
1.2.1 Patient demography ... 5
1.2.2 Medical history ... 6
1.2.2.1 Systemic co-morbidity ... 6
1.2.2.2 Causes of cataract ... 7
1.2.2.3 First or fellow eye surgery ... 8
1.2.2.4 Past ocular surgery of the operated eye ... 8
1.2.2.5 Preexisting ocular co-morbidity ... 9
1.2.2.6 Pre-operative vision ... 11
1.2.2.7 Target refractive power ... 14
1.3 CATARACT SURGICAL PRACTICES ... 15
1.3.1 Number of Cataract Surgery by SDP ... 15
1.3.2 Number of Cataract Surgery by Month ... 15
1.3.3 Number of Cataract Surgery Registered to CSR by State ... 16 1.3.4 Surgeon Status ... 16 1.3.5 Duration of Surgery ... 17
1.3.6 Distribution of Cataract Surgery Performed Under Day Care Setting ... 17
1.3.7 Distribution of Types of Cataract Surgery ... 20
1.3.8 Distribution of Combined Surgery ... 24
1.3.9 Anaesthesia in Cataract Surgery ... 26 1.3.10 Intraocular Lens Implantation ... 36 1.4 INTRA-OPERATIVE COMPLICATIONS ... 38
1.4.1 Intra-operative Complications by Years ... 38
1.4.2 Intra-operative Complication by Type of Surgery ... 39
1.4.3 Intra-operative Complications by Combined Surgery ... 42
1.4.4 Intra-operative Complications by Types of Local Anaesthesia ... 43
1.4.5 Intra-operative Complications by Surgeon Status ... 44
1.4.6 PCR ... 46 1.4.7 PCR by Type of Cataract Surgery ... 48
1.5 CATARACT SURGERY OUTCOME ... 49
1.5.1 Post-operative Complications ... 49
1.5.1.1 Post-operative Infectious Endophthalmitis ... 49
1.5.1.2 Unplanned Return to Operating Theatre (OT) ... 53
1.5.1.3 Post-operative Follow-up Period ... 54
1.5.2 Post-operative Visual Acuity ... 55
1.5.2.1 Post-operative Visual Acuity (All Eyes) ... 55
1.5.2.2 Post-operative Visual Acuity (Eyes without Ocular Co-morbidity) ... 57
1.5.2.3 Post-operative Visual Acuity 6/12 or Better Among Eyes without Ocular Co-morbidity ... 59
1.5.3 Reasons for No Record of Visual Acuity ... 65 1.5.4 Factors Contributing to Post-operative Refracted Visual Acuity of Worse than 6/12 ... 66
xii
THE 4
thREPORT OF THE NATIONAL EYE DATABASE 2010
CONTENT
CHAPTER 2: AGE RELATED MACULAR DEGENERATION REGISTRY ... 73
1.1 Introduction ... 74
1.2 Characteristic of patients and treatment ... 75
CHAPTER 3: RETINOBLASTOMA REGISTRY ... 79
3.1 Introduction ... 80
3.2 Patient demography ... 80
3.3 Ocular history and presentation ... 81
3.4 Investigation and classification ... 82
3.5 Management and outcome ... 83
LIST OF TABLES
list oF tAbles
Table 1.1(a) : Stock and Flow ... 2
Table 1.1(b) : Ascertainment for MOH Hospitals, CSR 2002-2010 ... 2
Table 1.1(c) : Ascertainment for CSR by SDP in 2010 ... 3
Table 1.2.1 : Age and Gender Distributions, CSR 2002-2010 ... 5
Table 1.2.2.1 : Distribution of Systemic Co-Morbidity, CSR 2002-2010 ... 6
Table 1.2.2.2 : Causes of Cataract, CSR 2002-2010 ... 7
Table 1.2.2.3 : First or Fellow Eye Surgery, CSR 2002-2010 ... 8
Table 1.2.2.4 : Past Ocular Surgery of the Operated Eye, CSR 2002-2010 ... 9
Table 1.2.2.5 : Distribution of Pre-existing Ocular Co-Morbidity, CSR 2002-2010 ... 10
Table 1.2.2.6 : Distribution of Pre-Operative Vision, CSR 2002-2010 ... 11
Table 1.2.2.7(a) : Distribution of Target Refractive Power, CSR 2007-2010 ... 14
Table 1.2.2.7(b) : Distribution of Target Refractive Power, CSR 2007-2010 ... 14
Table 1.3.1 : Range of Cataract Surgery Registered by SDP per year, Census versus CSR 2002-2010 ... 15
Table 1.3.2 : Number of Cataract Surgery by Month, CSR 2002-2010 ... 15
Table 1.3.4 : Surgeon Status, CSR 2002-2010 ... 16 Table 1.3.5(a) : Duration of Surgery by Types of Cataract Surgery in minutes, CSR 2007-2010 ... 17
Table 1.3.5(b) : Duration of Surgery by Surgeon Status, CSR 2007-2010... 17
Table 1.3.6(a) : Distribution of Cataract Surgery Performed Under Day Care Setting, CSR 2002-2010 ... 17
Table 1.3.6(b) : Distribution of Cataract Surgery (Excluding Children and Combined Surgery) Performed as Day Care by SDP, CSR 2002-2010 ... 18
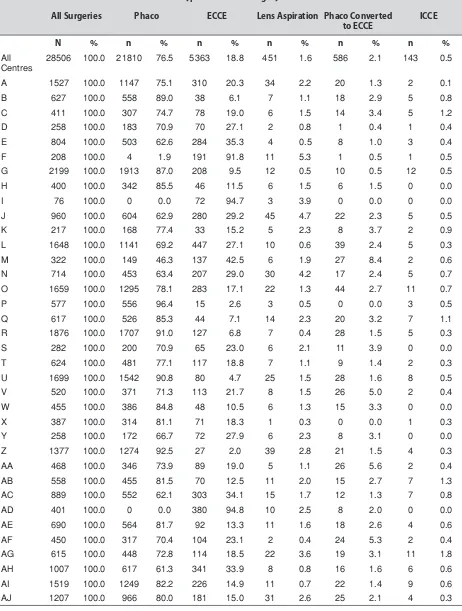
Table 1.3.7(a) : Distribution of Types of Cataract Surgery, CSR 2002-2010 ... 20
Table 1.3.7(b) : Distribution of Types of Cataract Surgery by SDP, CSR 2010 ... 21
Table 1.3.7(c) : Distribution of Phacoemulsification by SDP, CSR 2002-2010 ... 22
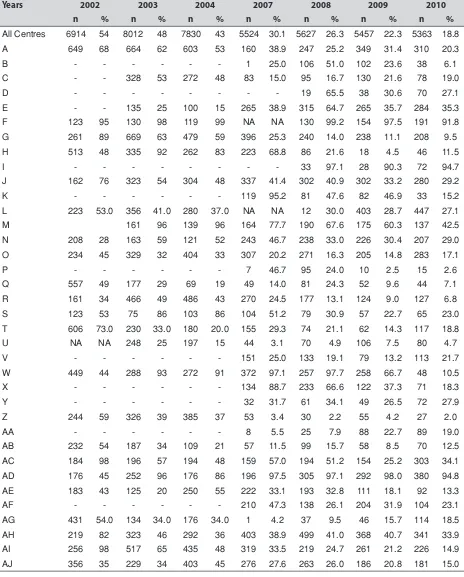
Table 1.3.7(d) : Distribution of ECCE by SDP, CSR 2002-2010 ... 23
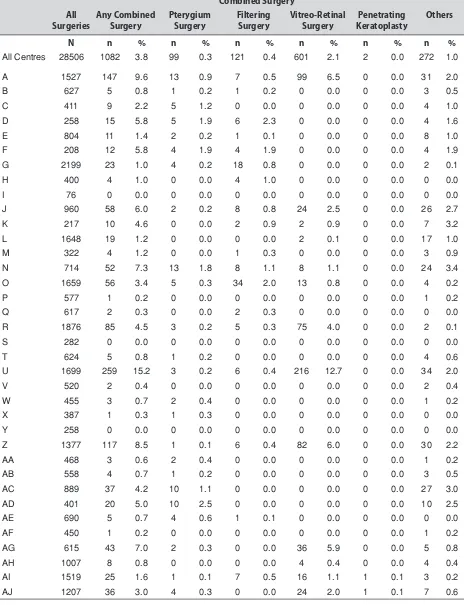
Table 1.3.8(a) : Distribution of Combined Surgery all SDP, CSR 2002-2010 ... 24
Table 1.3.8(b) : Distribution of Combined Surgery by SDP, CSR 2010 ... 25
Table 1.3.9(a) : Types of Anaesthesia all SDPs, CSR 2002-2010 ... 26 Table 1.3.9(b) : Types of Anaesthesia by SDPs, CSR 2010 ... 27
Table 1.3.9(c) : Types of Local Anaesthesia by SDPs, CSR 2010 ... 28
Table 1.3.9(d) : Types of Local Anaesthesia by SDPs Excluding Combined Surgery, CSR 2010 ... 29
Table 1.3.9(e) : Subtenon Anaesthesia by SDPs, CSR 2002-2010 ... 30
Table 1.3.9(f) : Topical Anaesthesia by SDPs, CSR 2002-2010 ... 32
Table 1.3.9(g) : Types of Sedation in Eyes Given Local Anaesthesia by SDPs, CSR 2010 ... 33
Table 1.3.9(h) : Oral Sedation Alone by SDPs, CSR 2002-2010 ... 34
Table 1.3.9(i) : Intravenous Sedation Alone by SDPs, CSR 2002-2010 ... 35
Table 1.3.10(a) : Intraocular Lens Implantation, CSR 2002-2010 ... 36 Table 1.3.10(b) : Distribution of IOL Placement by SDP, CSR 2010 ... 37
Table 1.4.1(a) : Distribution of Type of Intra-operative Complications, CSR 2002-2010 ... 38
Table 1.4.1(b) : Distribution of Type of Intra-operative Complications – Posterior Capsule Rupture, CSR 2002-2010 ... 38
Table 1.4.2(a) : Intra-operative Complications by Types of Cataract Surgery, CSR 2002-2010 ... 39
Table 1.4.2(b) : Distribution of Types of Intra-operative Complications by Specific Types of Cataract Surgery, CSR 2010 ... 39
Table 1.4.2(c) : Distribution of Types of Intra-operative Complications by SDP, CSR 2010 ... 40
Table 1.4.2(d) : Distribution of Types of Intra-operative Complications in “Phaco Converted to ECCE” by SDP, CSR 2010 ... 41
Table 1.4.3(a) : Distribution of Intra-operative Complications by Any Combined Surgery, CSR 2002-2010 ... 42
Table 1.4.3(b) : Distribution of Intra-operative Complications by Specific Combined Surgery, CSR 2010 ... 42
Table 1.4.3(c) : Distribution of Intra-operative Complications when Combined with Filtering Surgery, CSR 2002-2010 ... 43
Table 1.4.3(d) : Distribution of Intra-operative Complications when Combined with VR Surgery, CSR 2002-2010 ... 43
Table 1.4.4 : Intra-operative Complications by Types of Local Anaesthesia, CSR 2010 ... 43
Table 1.4.5(a) : Percentage of Intra-operative Complications by Surgeon Status, CSR 2003-2010 ... 44
Table 1.4.6 : PCR by SDP, CSR 2007-2010 ... 46 Table 1.4.7 : PCR by Type of Cataract Surgery, CSR 2002-2010 ... 48
Table 1.5.1 : Distribution of Cataract Surgery with Post-operative Complication Record, CSR 2002-2010 ... 49
Table 1.5.1.1(a) : Post-operative Infectious Endophthalmitis, CSR 2002-2010 ... 49
xiv
THE 4
thREPORT OF THE NATIONAL EYE DATABASE 2010
LIST OF TABLES
Table 1.5.1.2(a) : Unplanned Return to OT, CSR 2004-2010 ... 53
Table 1.5.1.2(b) : Reasons for Unplanned Return to OT, CSR 2004-2010 ... 53
Table 1.5.1.2(c) : Time from Surgery to Unplanned Return to OT, CSR 2010 ... 54
Table 1.5.1.3(a) : Median Follow-up Period for Eyes with Unaided Vision (in weeks) by Types of Surgery, 2010 ... 54
Table 1.5.1.3(b) : Median Follow-up Period for Eyes with Refracted Vision (in weeks) by Types of Surgery, 2010 ... 54
Table 1.5.2.1 : Post-operative Visual Acuity, All Eyes, CSR 2002-2010 ... 55
Table 1.5.2.2 : Post-Operative Visual Acuity for Eyes without Ocular Co-morbidity, CSR 2002-2010 ... 57
Table 1.5.2.3(a) : Post-operative Visual Acuity 6/12 or Better for Eyes without Ocular Co-morbidities by Types of Surgery, CSR2002-2010 ... 59
Table 1.5.2.3(b) : Post-operative Refracted Visual Acuity 6/12 or Better in Eyes without Ocular Co-morbidities by Complications and Types of Surgery, CSR 2010 ... 61 Table 1.5.2.3(c) : Post-operative Refracted Visual Acuity 6/12 or Better in Eyes without Ocular Co-morbidities by Surgeon Status and Types of Surgery, CSR 2010 ... 61 Table 1.5.2.3(d) : Post-operative Refracted Visual Acuity 6/12 or Better for Patients without Ocular Co-morbidities by SDP and Types of Surgery, CSR 2010 ... 63 Table 1.5.3 : Reasons for No Records of Visual Acuity, CSR 2002-2010 ... 65 Table 1.5.4(a) : Factors Contributing to Post-operative Refracted VA of Worse than 6/12 in All Eyes, CSR 2002-2010 ... 66
Table 1.5.4(b) : Factors Contributing to Post-operative Refracted VA of Worse than 6/12 in Eyes without Preexisting Ocular co-morbidity, CSR 2004-2010 ... 67 Table 1.5.5(a) : Distribution of Target and Actual Refractive Power in ECCE and Phaco, CSR 2007-2010 ... 68
Table 1.5.5(b) : Percentage Distribution of Target and Actual Refractive Power in ECCE and Phaco, CSR 2007-2010 ... 68 Table 1.5.5(c) : Difference in Target and Actual Refractive Power for Patients who had Phacoemulsification Only, CSR 2007-2010 ... 70
Table 3.4 : Classification of Retinoblastoma ... 83
Table 3.5(a) : Chemotherapy by patient ... 83
Table 3.5(b) : Treatment method by no. of eyes ... 84
Table 3.5(c) : Outcome and complications, by no. of eyes ... 84
Table 3.5(d) : Outcome by patient ... 85
LIST OF FIGURES
list oF Figures
Figure 1.1(a) : Stock and flow ... 2
Figure 1.1(c) : Ascertainment for CSR by SDP in 2010 ... 4
Figure 1.2.1 : Age Distribution, CSR 2002-2010 ... 6
Figure 1.2.2.1 : Percentage of Patients with Specific Ocular Co-morbidity, CSR 2002-2010 ... 7
Figure 1.2.2.4 : Percent Distribution of Past Ocular Surgery of the Operated Eye, CSR 2002-2010 ... 9
Figure 1.2.2.5 : Percent Distribution of Eyes with Diabetic Retinopathy, Glaucoma or Lens-induced Glaucoma, CSR 2002-2010 ... 11
Figure 1.2.2.6(a) : Distribution of Pre-Operative Vision (Unaided/presenting and refracted), CSR 2002-2010 ... 12
Figure 1.2.2.6(b) : Distribution of Pre-Operative Vision (Unaided/presenting), CSR 2002-2010 ... 13
Figure 1.2.2.6(c) : Distribution of Pre-Operative Vision (Refracted), CSR 2002-2010 ... 13
Figure 1.3.2 : Number of Cataract Surgeries by Month, CSR 2002-2010 ... 16 Figure 1.3.3 : Number of Cataract Surgery Registered to CSR by State, CSR 2002-2010 ... 16 Figure 1.3.6(a) : Distribution of Cataract Surgery Performed as Day Care by SDP, CSR 2010 ... 19
Figure 1.3.6(b) : Distribution of Cataract Surgery Performed as Day Care and In-patient by SDP (Excluding Surgery Done in Children and Combined Surgery), CSR 2010 ... 19
Figure 1.3.6(c) : Distribution of Cataract Surgeries Performed as Day Care all SDPs (Excluding Surgery Done in Children and Combined Surgery), CSR 2002-2010 ... 19
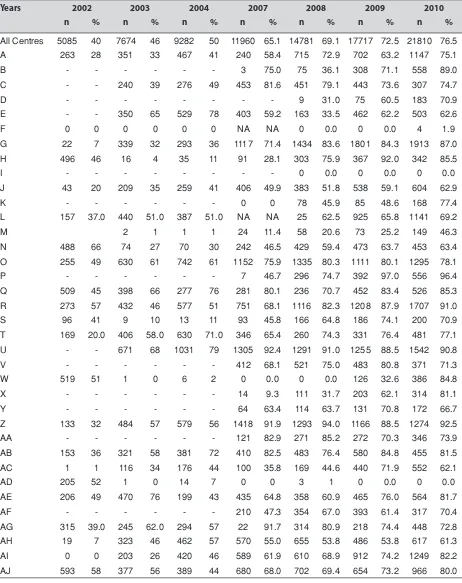
Figure 1.3.7 : Distribution of Phacoemulsification, ECCE and Phaco Converted to ECCE, CSR 2002-2010... 20
Figure 1.3.8(a) : Distribution of Specific Combined Surgery, CSR 2002-2010 ... 24
Figure 1.3.9 : Types of Anaesthesia all SDPs, CSR 2002-2010 ... 26 Figure 1.3.10 : Intraocular Lens Implantation, CSR 2002-2010 ... 36 Figure 1.4.1 : Distribution of Specific Type of Intra-operative Complications, CSR 2002-2010 ... 38
Figure1.4.2 : Intra-operative Complications by Types of Cataract Surgery, CSR 2002-2010 ... 39
Figure 1.4.5 : Percentage Distribution of Intra-operative Complications by Surgeon Status, CSR 2003-2010 ... 45
Figure 1.4.6(a) : PCR by SDP, CSR 2010-Bar Chart (National KPI set at 5.0%) ... 47
Figure 1.4.6(b) : PCR by SDP, CSR 2010-Radar Chart (National KPI set at <5%) ... 47
Figure 1.4.7 : PCR by Type of Cataract Surgery, CSR 2002-2010 ... 48
Figure 1.5.1.1(a) : Rate of Post-operative Infectious Endophthalmitis, CSR 2002-2010 ... 49
Figure 1.5.1.1(b-i) : Post-operative Infectious Endophthalmitis, by SDP CSR 2007 ... 50
Figure 1.5.1.1(b-ii) : Post-operative Infectious Endophthalmitis, by SDP CSR 2008 ... 50
Figure 1.5.1.1(b-iii) : Post-operative Infectious Endophthalmitis, by SDP CSR 2009 ... 50
Figure 1.5.1.1(b-iv) : Post-operative Infectious Endophthalmitis, by SDP CSR 2010 ... 51
Figure 1.5.1.1(c-i) : Post-operative Infectious Endophthalmitis, by SDP CSR 2007 ... 51
Figure 1.5.1.1(c-ii) : Post-operative Infectious Endophthalmitis, by SDP CSR 2008 ... 51
Figure 1.5.1.1(c-iii) : Post-operative Infectious Endophthalmitis, by SDP CSR 2009 ... 52
Figure 1.5.1.1(c-iv) : Post-operative Infectious Endophthalmitis, by SDP CSR 2010 ... 52
Figure 1.5.1.2 : Reasons for Unplanned Return to OT, CSR 2004-2010 ... 53
Figure 1.5.2.1(a) : Percent Distribution of Post-operative Unaided and Refracted Visual Acuity, CSR 2002-2010 ... 56 Figure 1.5.2.1(b) : Post-operative Unaided and Refracted Visual Acuity by Visual Category for All Eyes, CSR 2002-2010 ... 56 Figure 1.5.2.2(a) : Post-Operative Visual Acuity for Eyes without Ocular Co-morbidity, CSR 2002-2010 ... 58
Figure 1.5.2.2(b) : Post-operative Visual Acuity by Visual Category for Eyes without Ocular Co-morbidity, CSR 2002-2010 ... 59
Figure 1.5.2.3(a) : Post-operative Visual Acuity 6/12 or Better for Eyes without Ocular Co-morbidities by ECCE and Phaco, CSR 2002-2010 ... 60
Figure 1.5.2.3(b) : Post-operative Refracted Visual Acuity 6/12 or Better in Eyes without Ocular Co-morbidities by Surgeon Status and Types of Surgery, CSR 2002-2010 ... 62
Figure 1.5.2.3(c) : Post-operative Refracted Visual Acuity 6/12 or Better for Patients without Ocular Co-morbidities by SDP and All Surgeries, CSR 2010 ... 64
Figure 1.5.2.3(d) : Post-operative Refracted Visual Acuity 6/12 or Better for Patients without Ocular Co-morbidities by SDP for Phacoemulsification, CSR 2010 ... 65
Figure 1.5.2.3(e) : Post-operative Refracted Visual Acuity 6/12 or Better for Patients without Ocular Co-morbidities by SDP for ECCE, CSR 2010 ... 65 Figure 1.5.4 : Factors Contributing to Post-operative Refracted VA of Worse than 6/12 in All Eyes,
xvi
THE 4
thREPORT OF THE NATIONAL EYE DATABASE 2010
LIST OF FIGURES
Figure 1.5.5(a) : Percentage Distribution of Actual Refractive Power in ECCE and Phaco,
CSR 2007-2010 ... 70
Figure 1.5.5(b) : Difference in Target and Actual Refractive Power for Patients who had Phacoemulsification Only, CSR 2007-2010 ... 71
Figure 2.2(a) : Presenting Visual Acuity ... 76 Figure 2.2(b) : Staging of AMD ... 76 Figure 2.2(c) : Distribution of Advanced AMD ... 76 Figure 3.4(b) : Disease Staging (IIRC) ... 83
Figure 4.1 : Number of out-patients visits at Ophthalmology clinics, 2002-2010 ... 88
Figure 4.2 : Number of in- patients admitted to eye wards, 2002-2010 ... 88
Figure 4.3 : Number of ocular operation* performed, 2002-2010 ... 89
Figure 4.4 Number of cataract surgeries, ECCE and phacoemulsification performed, 2002-2010 .... 89
Figure 4.5 : Trend of cataract surgeries performed by ECCE and phacoemulsification, 2002 to 2010 ... 89
Figure 4.6 : Diabetic patients seen at ophthalmology clinics, 2002-2010 ... 90
Figure 4.7 : Number of vitreo-retinal surgery performed at hospitals with vitreoretinal surgeons, 2002-2010 ... 90
Figure 4.8 : Number of refractions performed at ophthalmology clinics, 2002-2010 ... 90
Figure 4.9 : Number of patients with low vision assessments, 2002-2010 ... 91
Figure 4.10 : Number of premature infants screened for retinopathy of prematurity screening, 2002-2010 ... 91
REPORT SUMMARY
rePort summAry
CATARACT SURGERY REGISTRY
1. Stock and Flow
· • From the year 2008 to 2010, all the 36 MOH Ophthalmology departments participated in CSR. •· The number of SDP increased from 25 SDPs in 2002 to 36 SDPs in 2010.
· • The total number of cataract surgery registered to CSR increased from 12798 in 2002 to 28506 in 2010. •· The CSR ascertainment rate increased from 87.6 % in 2002 to 95.4% in 2010.
2. Characteristics of Patients
· • The mean age of patients at the time of cataract surgery maintained at 64 – 65 years old from 2002 to 2010. This age was younger than data published by the Swedish cataract surgery register (74 years old).
•· Up to 1/3 of patients presented within the age group of 65-74 years old (37.6% in 2010).
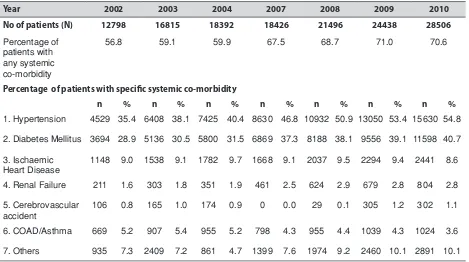
· • The proportion of patients with systemic co-morbidity increased from 56.8% in 2002 to 70.6% in 2010
•· There was an increase in the proportion of patients presented for cataract surgery who had hypertension (from 35.4% in 2002 to 54.8% in 2010) and diabetes mellitus (from 28.9% in 2002 to 40.7% in 2010).
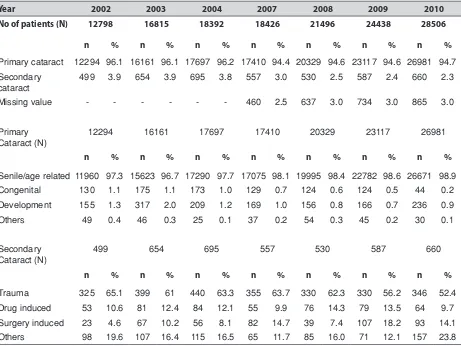
· • Senile cataract was the commonest cause of primary cataract (98.9% in 2010). •· Trauma was the commonest cause for secondary cataract (52.4% in 2010).
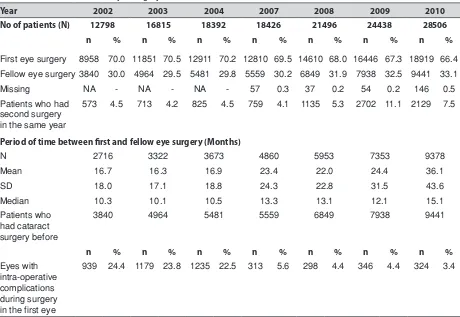
· • The proportion of patients who returned for cataract surgery in the fellow eye remained the same from 2002 to 2009, i.e. only one third (33.1% in 2010).
•· Majority of the eyes had no prior ocular surgery (96.9% in 2010).The commonest prior ocular surgery was vitreoretinal surgery (1.3% in 2010).
•· One third of the eyes had ocular co-morbidity (42.0% in 2010). The commonest ocular co-morbidity was diabetic retinopathy in any forms (12.5% in 2009).
· • About half of the eyes had unaided vision in the blindness category (2/60-NPL) (49.6% in 2010). With refracted vision, the proportion decreased to less than 30% (26.6% in 2010). This trend was consistent over the years. •· Refraction was not done in more than 2/3 of the eyes (72.3% in 2010).
· • Bimodal pattern of pre-operative vision was consistently observed over the years with one peak at the range between 6/18 to 6/36 and another peak at CF-HM.
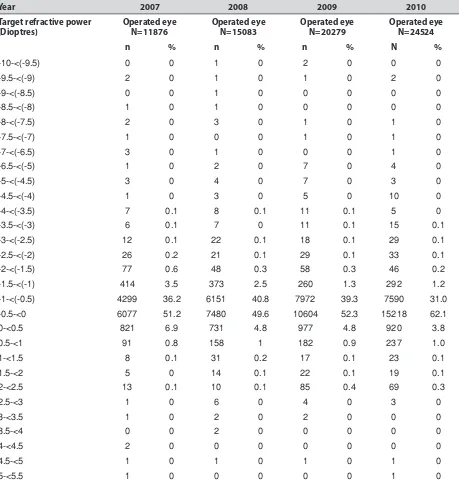
· • In term of the choice of IOL power, majority of surgeons chose target refraction as emmetropia or slightly myopic. The mean target refractive power in 2010 was -0.4D (SD 0.4).
3. Cataract Surgery Practice Patterns
· • The number of cataract surgery performed by SDPs varied. IN 2010, of the 36 SDPs, 14 performed less than 500 surgeries, 12 performed between 501 to 1000, and 10 performed more than 1000 cataract surgeries a year.
•· The number of surgery performed was lower than average in the month of February and September.
· • Selangor (5 SDPs), Perak (4 SDPS), Johor (4 SDPS), Penang (2 SDPS), and Sarawak (4 SDPS), performed higher number of cataract surgeries compared to other state. This is mainly because of population density and higher number of ophthalmology department in these states.
· • More than 2/3 of the cataract surgery was performed by specialists (84.9% in 2010).
•· The mean duration taken to do a cataract surgery was 31.3 min for phaco and 47.4 min for ECCE in 2010. · • Though there is an increasing trend for day care surgery, from 39.3% in 2002 to 51.5% in 2010, the percentage
varied among SDPs. In 2010, 4 SDPs did not perform any cataract surgery under day care, 17 SDPs performed less than 50.0% and only 8 SDPs performed more than 90.0% of cataract surgery as day care.
· • Phaco was the preferred method of cataract surgery and the proportion increased from 39.7% in 2002 to 76.5% in 2010. Percentage of ECCE decreased from 54.0% in 2002 to 18.8% in 2010.
· • The preferred IOL material was acrylic and non-foldable type.
· • The percentage of phaco converted to ECCE was 2.1% in 2010. It remained constant over the years.
· • Among combined surgery, VR surgery showed an increasing trend (0.2% in 2002 to 2.1% in 2010) while filtering surgery showed a decreasing trend (1.2% in 2002 to 0.4% in 2010).
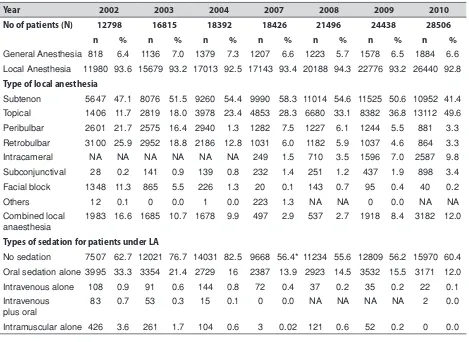
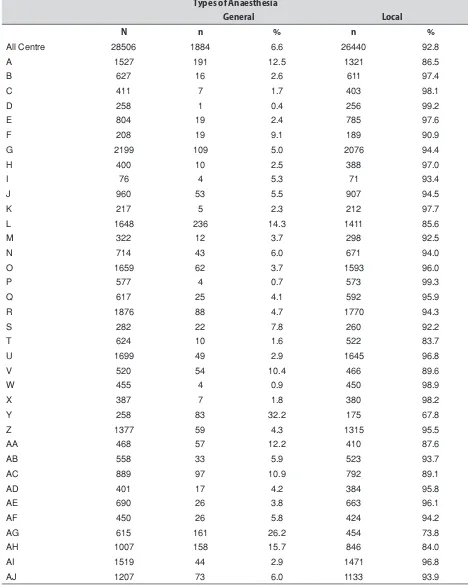
•· Majority of cases were done under local anaesthesia (92.8% in 2010). The preferred type of local anesthesia was topical (49.6% in 2010).
· • The use of topical anesthesia has increased from 11.7% in 2002 to 49.6% in 2010. •· The use of retrobulbar anesthesia has decreased from 25.9% in 2002 to 3.3% in 2010. · • There is a decrease in the use of oral sedation (33.3% in 2002 to 12.0% in 2010).
xviii
THE 4
thREPORT OF THE NATIONAL EYE DATABASE 2010
REPORT SUMMARY
4. Intra-operative Complications
· • There is a reduction in intra-operative complication from 10.4% in 2002 to 5.6% in 2010.
· • The rate of PCR decreased from 6.0% in 2002 to 2.9% in 2010 and vitreous loss decreased from 5.7% in 2002 to 2.2% in 2010.
•· Intra-op complication was seen among 42.5% of patients who had phaco converted to ECCE and 44.8% who had ICCE in 2010.
· • In 2010, the percentage of intra-op complication was higher if cataract surgery was combined with filtering surgery (6.6%) pterygium excision (8.1%) or vitreoretinal (5.8%). For cataract surgery combined with VR surgery, the intra-operative complication rate dropped from 35.0% in 2002 to 5.8% in 2010 and rate of vitreous loss reduced from 19.0% in 2002 to 1.5% in 2010.
· • In 2010, the rate of intra-operative complication was higher in surgeries performed by MO ( 9.2%), followed by gazetting specialists (7.0%) as compared to specialist ( 5.2%).
•· In 2010, 34 out of 36 SDPs achieved the national KPI standard of PCR below 5%.
5. Cataract Surgery Outcome
· • Up to 80% of patient registered to CSR had cataract surgery outcome data.
• The percentage of patients with post-operative endophthalmitis declined from 0.2% in 2002 (25 patients) to 0.09% in 2010 (24 patients)
· • The percentage of patients with unplanned return to OT initially increased over the years, from 0.34% in 2004 to 0.53% in 2009, but it declined in 2010 (0.47%). The common reasons for the need to have re-operation were iris prolapse, wound dehiscence and IOL related problems.
· • In eyes without ocular co-morbidity, less than 50% of eyes had post-op unaided visual acuity 6/12 or better and the patterns were consistent over the years. With refraction, more than 80% achieved post-op vision 6/12 or better (81.0% in 2002, 89.0% in 2003, 90.0% in 2004, 84.0% in 2007, 88.0% in 2008, 90.9% in 2009 and 92.0% in 2010). This observation suggested that poor post- op unaided vision was due to refractive error and patients’ vision could be improved with glasses.
· • Patients who had phaco had better post-op visual outcome when compared to other type of surgeries. 93.8% of phaco patients had refracted vision of 6/12 or better in 2010 as compared to ECCE (85.5%), phaco convert to ECCE (78.3%), lens aspiration (75.0%) and ICCE (52.0%).
· • Post-op visual outcome improved over the years. Refracted visual outcome of 6/12 or better among phaco patient improved from 87.0% in 2002 to 93.8% in 2010 and among ECCE patients from 78.0% in 2002 to 85.5% in 2010.
· • In all type of surgeries, visual outcome became less favourable when there were intra-operative complications.
· • The post-op visual outcomes within 1 week to 3 months was better in eyes with IOL implantation compared to non IOL, in eyes with foldable IOL and IOL made of acrylic.
· • The main contributing factor for eyes with post-operative refracted VA worse than 6/12 was pre-existing ocular co-morbidity followed by high astigmatism and posterior capsule opacification.
· • When patients with preexisting ocular co-morbidity were excluded from analysis, high astigmatism followed by preexisting ocular co-morbidity (not detected preoperatively) were the major causes of poor visual outcome. · • In 2010, the choice of IOL power was aimed towards targeted refraction of -0.4D and post-operative actual
refraction was -0.3D for all eyes, -0.6D for phaco eyes, and -0.9D for ECCE eyes. Thus, eyes which had undergone ECCE had more myopic shift than eyes which had phaco.
· • In 2010, there was disparity between the targeted and the actual refraction. 27.0% of eyes had a different in target and actual refraction of between 0 and -0.5D, and 22.3% had a different of between 0 to +0.5D.
AGE RELATED MACULAR DEGENERATION REGISTRY
1. Stock and Flow
· • A total of 169 patients registered with 289 affected eyes.
2. Patient Demography and Vision
· • Mean age was 65.7 years
· • Mean duration of symptom was 11.5 months (1 week to 120 months)
· • Proportion of eye with VA 6/6-6/12 was 20.1%, VA 6/18-4/60 was 49.8% and VA 3/60 or worse was 26.0%.
3. Status of AMD
· • Majority of patients present late to the tertiary referral centre. · • 2/3 of the eyes had advance AMD
· • Disciform scar was present in 1/3 of eyes.
· • Only 50% of cases were treatable of which 48.0% were polypoidal choroidal vasculopathy and 57.0 % were choroidal neovascularisation.
REPORT SUMMARY
· • Anti VEGF therapy was the main form of therapy in 36.1% of cases followed by photodynamic therapy (20.2%).
•· Only a small number of patients received combination therapy with PDT and anti VEGF in view of the financial constraints.
RETINOBLASTOMA REGISTRY
1. Stock and Flow
· • A total of 101 patients registered, of which 17 patient were diagnosed in 2010.
2. Patients Demography
· • Majority were of Malay ethnicity (52.5%), followed by Chinese (18.8%) and Indians (9.9%).
3. Ocular History and Presentation
· • The most common presentation was leukocoria.
· • Mean duration of disease from onset of symptoms to presentation was 4.8 months with the majority (77.9%) within 1 to 6 months.
· • 30 patients (33.4%) had bilateral disease.
· • 1 patient had positive family history of retinoblastoma.
4. Investigation and Classiication
· • The presence of calcified mass was detected in 83.0% by CT scan.
· • In patients who underwent MRI, 10.4% showed presence of mass but only 8.1% had calcification.
· • Extraocular extension detected by CT scan in 12.6% of eyes and by MRI in 3.7% of eyes, the majority involved the optic pathway.
· • Two-thirds (65.9%) of the patients presented with Group E Retinoblastoma.
5. Management
· • 63.4% of patients had systemic chemotherapy with a mean of 7 cycles (maximum 15 chemotherapy cycles). · • 5 patients had subtenon injection of chemotherapy combined with systemic chemotheraphy
· • 57 affected eyes out of 67 eyes (85.1%) with unilateral RB were enucleated with 46.3% of these eyes showed histopathological extension outside eyeball.
CHAPTER 1
CATARACT SURGERY REGISTRY 2010
Contributing Editors
Dr Goh Pik Pin
2
THE 4
thREPORT OF THE NATIONAL EYE DATABASE 2010
CHAPTER 1 :
CATARACT SURGERY REGISTRY 2010
cHAPter 1: cAtArAct surgery registry
1.1
STOCK AND FLOW
The number of CSR source data provider (SDP) maintained at 36 in 2010. The number of cataract surgeries being registered to CSR increased from 12798 in 2002 to 28506 in 2010.
From 2002-2004, CSR was a paper-based registry. During this period, there was a decrease in the percentage of eyes with visual outcome recorded in CSR. When the web-based registry was introduced in 2007, the percentage for each year showed an increasing trend except for the year 2009 (84.3%).
Table 1.1(a): Stock and Flow
Year 2002 2003 2004 2007 2008 2009 2010
Number of SDP 25* 32* 33* 32 36 36 36
Total number of cataract surgery registered to CSR
12798 16815 18392 18426 21496 24438 28506
n % n % n % n % n % n % n %
Cataract surgery
with visual
outcome records
12512 97.7 14683 87.3 6228 33.9 15786 85.7 19063 88.7 20590 84.3 24521 86.0
*2002, 2003 and 2004 included private centre and University Hospital
The ascertainment was maintained at more than 80% for the year 2002-2004 and 2007-2010. The reduced ascertainment which was observed in 2007 was possibly due to the change from a paper-based to a web-based registry. The percentage increased from 2007 onwards. In the year 2010, Hospital T and AH only reported 72.1% and 71.2% of cataract surgery performed to CSR respectively. Other hospital with poor percentage of outcome form submitted were Hospital D (6.6%), Hospital W (79.9%), Hospital AB (77.8%), Hospital AD (53.6%) and Hospital AG (76.5%).
Table 1.1(b): Ascertainment for MOH Hospitals, CSR 2002-2010
Year 2002 2003 2004 2007 2008 2009 2010
Total number of cataract surgery
performed at MOH Hospitals
(Source: MOH census returns) 14316 16498 18884 22051 25393 26274 29873
Total number of cataract surgery
performed at MOH hospitals
and registered to CSR
12552 16039 17536 18426 21496 24438 28506
Ascertainment (%) 87.6% 97.2% 92.9% 83.6% 84.6% 93.0% 95.4%
THE 4
Table 1.1(c): Ascertainment for CSR by SDP in 2010
Ascertainment
All Centres 29873 28506 26009 24521 22579 95.4 91.2 94.3 86.8
A 1536 1527 1527 1325 1251 99.4 100.0 86.8 81.9
B 630 627 626 617 565 99.5 99.8 98.6 90.3
C 417 411 410 349 343 98.6 99.8 85.1 83.7
D 269 258 258 253 17 95.9 100.0 98.1 6.6
E 811 804 804 791 683 99.1 100.0 98.4 85.0
F 240 208 207 202 192 86.7 99.5 97.6 92.8
G 2258 2199 874 837 719 97.4 39.7 95.8 82.3
H 404 400 388 374 368 99.0 97.0 96.4 94.8
I 83 76 76 73 76 91.6 100.0 96.1 100.0
J 1010 960 831 815 797 95.0 86.6 98.1 95.9
K 264 217 201 199 171 82.2 92.6 99.0 85.1
L 1764 1648 1470 1431 1346 93.4 89.2 97.3 91.6
M 375 322 320 294 292 85.9 99.4 91.9 91.3 N 719 714 712 708 673 99.3 99.7 99.4 94.5
O 1548 1659 1659 1501 1391 107.2 100.0 90.5 83.8
P 685 577 577 577 576 84.2 100.0 100.0 99.8
Q 649 617 616 600 534 95.1 99.8 97.4 86.7 R 1910 1876 1780 1626 1570 98.2 94.9 91.3 88.2
S 281 282 277 275 263 100.4 98.2 99.3 94.9
T 865 624 615 575 539 72.1 98.6 93.5 87.6
U 1662 1699 1699 1673 1530 102.2 100.0 98.5 90.1
V 455 520 520 510 439 114.3 100.0 98.1 84.4
W 438 455 452 447 361 103.9 99.3 98.9 79.9
4
Y 258 258 258 255 251 100.0 100.0 98.8 97.3
Z 1443 1377 1324 1254 1195 95.4 96.2 94.7 90.3
AA 513 468 468 451 382 91.2 100.0 96.4 81.6
AB 558 558 558 552 434 100.0 100.0 98.9 77.8
AC 889 889 889 879 840 100.0 100.0 98.9 94.5
AD 452 401 401 277 215 88.7 100.0 69.1 53.6
AE 733 690 683 622 615 94.1 99.0 91.1 90.0
AF 501 450 411 388 380 89.8 91.3 94.4 92.5
AG 566 615 592 563 453 108.7 96.3 95.1 76.5
AH 1414 1007 985 967 843 71.2 97.8 98.2 85.6
AI 1503 1519 947 758 894 101.1 62.3 80.0 94.4
AJ 1377 1207 1207 1123 1023 87.7 100.0 93.0 84.8
THE 4
The mean age for patients presented for cataract surgery showed an increasing trend over the years. In 2010, the minimum age, increased to 1.8 months old and the maximum age maintained at 99 years old.
A larger percentage of patients presented within the age group of 65-74 years old except for the year 2007. There was no marked gender difference over the years. The slight female preponderance reflected higher female ratio in the aging population.
Table 1.2.1: Age and Gender Distributions, CSR 2002-2010
Year 2002* 2003* 2004* 2007 2008 2009 2010 Total number of cataract surgery 12798 16815 18392 18426 21496 24438 28506 Age
Mean (years) 64.0 63.7 63.5 64.3 64.6 64.7 65.0 Median (years) 66 66 66 66 66 66 66 Minimum (month) 1.0 1.0 1.0 1.0 1.0 1.2 1.8
Maximum (years) 97 100 104 97 102 99 99
% Distribution
45-54 1472 11.5 1974 11.7 2238 12.2 499 2.7 2407 11.2 2697 11.0 3043 10.7
55-64 3415 26.7 4496 26.7 4882 26.5 2135 11.6 6037 28.1 6956 28.5 8225 28.9
65-74 4880 38.1 6480 38.5 7051 38.3 5031 27.3 8307 38.6 9534 39.0 10720 37.6
75-84 2041 16.0 2511 14.9 2722 14.8 7103 38.6 3391 15.8 3802 15.6 4805 16.9
>=85 206 1.6 264 1.6 316 1.7 2889 15.7 344 1.6 388 1.6 509 1.8
Missing NA - 4 0.0 NA - 283 1.5 21 0.1 0 0.0 2 0.0 Gender
Male 6308 49.3 8397 49.9 9034 49.1 8820 47.9 10295 47.9 11829 48.4 13631 47.8
Female 6490 50.7 8418 50.1 9358 50.9 9606 52.1 11168 52.0 12609 51.6 14871 52.2 Missing 0 0 0 0 0 0 0 0 33 0.2 0 0 4 0.0
6
THE 4
thREPORT OF THE NATIONAL EYE DATABASE 2010
CHAPTER 1 :
CATARACT SURGERY REGISTRY 2010
Figure 1.2.1: Age Distribution, CSR 2002-2010
1.2.2 Medical history
1.2.2.1 Systemic co-morbidity
The common systemic co-morbidity encountered in patients who came for cataract surgery were hypertension, diabetes mellitus, ischemic heart disease and renal failure The overall percentage of such patients showed an increasing trend over the years. The percentages of patients with hypertension and diabetes mellitus were increasing.
Table 1.2.2.1: Distribution of Systemic Co-Morbidity, CSR 2002-2010
Year 2002 2003 2004 2007 2008 2009 2010
No of patients (N) 12798 16815 18392 18426 21496 24438 28506
Percentage of
patients with any systemic
co-morbidity
56.8 59.1 59.9 67.5 68.7 71.0 70.6
Percentage of patients with speciic systemic co-morbidity
n % n % n % n % n % n % n %
1. Hypertension 4529 35.4 6408 38.1 7425 40.4 8630 46.8 10932 50.9 13050 53.4 15630 54.8
2. Diabetes Mellitus 3694 28.9 5136 30.5 5800 31.5 6869 37.3 8188 38.1 9556 39.1 11598 40.7
3. Ischaemic
Heart Disease
1148 9.0 1538 9.1 1782 9.7 1668 9.1 2037 9.5 2294 9.4 2441 8.6
4. Renal Failure 211 1.6 303 1.8 351 1.9 461 2.5 624 2.9 679 2.8 804 2.8
5. Cerebrovascular
accident
106 0.8 165 1.0 174 0.9 0 0.0 29 0.1 305 1.2 302 1.1
6. COAD/Asthma 669 5.2 907 5.4 955 5.2 798 4.3 955 4.4 1039 4.3 1024 3.6
7. Others 935 7.3 2409 7.2 861 4.7 1399 7.6 1974 9.2 2460 10.1 2891 10.1
CATARACT SURGERY REGISTRY 2010
: CHAPTER 1
Figure 1.2.2.1: Percentage of Patients with Specific Ocular Co-morbidity, CSR 2002-2010
1.2.2.2 Causes of cataract
Majority of the patients presented with primary cataract. In eyes with primary cataract, senile or age-related cataract was the commonest. In eyes with secondary cataract, trauma was the commonest. This pattern remained unchanged over the years.
Table 1.2.2.2: Causes of Cataract, CSR 2002-2010
Year 2002 2003 2004 2007 2008 2009 2010
No of patients (N) 12798 16815 18392 18426 21496 24438 28506
n % n % n % n % n % n % n %
Primary cataract 12294 96.1 16161 96.1 17697 96.2 17410 94.4 20329 94.6 23117 94.6 26981 94.7
Secondary
12294 16161 17697 17410 20329 23117 26981
n % n % n % n % n % n % n %
Senile/age related 11960 97.3 15623 96.7 17290 97.7 17075 98.1 19995 98.4 22782 98.6 26671 98.9
Congenital 130 1.1 175 1.1 173 1.0 129 0.7 124 0.6 124 0.5 44 0.2
Development 155 1.3 317 2.0 209 1.2 169 1.0 156 0.8 166 0.7 236 0.9
Others 49 0.4 46 0.3 25 0.1 37 0.2 54 0.3 45 0.2 30 0.1
Secondary Cataract (N)
499 654 695 557 530 587 660
n % n % n % n % n % n % n %
Trauma 325 65.1 399 61 440 63.3 355 63.7 330 62.3 330 56.2 346 52.4
Drug induced 53 10.6 81 12.4 84 12.1 55 9.9 76 14.3 79 13.5 64 9.7
Surgery induced 23 4.6 67 10.2 56 8.1 82 14.7 39 7.4 107 18.2 93 14.1
8
THE 4
thREPORT OF THE NATIONAL EYE DATABASE 2010
CHAPTER 1 :
CATARACT SURGERY REGISTRY 2010
1.2.2.3 First or Fellow Eye Surgery
Two third of patients were operated for the first time. Only one third of the patients returned for second surgery (for the fellow eye). This pattern remained unchanged since 2002. This was despite the declining percentage of eyes with intra-operative complications during surgery in the previous eye surgery (from 24.4% in 2002 to 3.4% in 2010).
Overall data showed that, the percentage of patients who had fellow eye surgery in the same year showed an initial increasing trend (from 4.5% in 2002 to 11.1% in 2009). But the percentage reduced to 7.5% in 2010. The mean duration between the first and fellow eye showed an increasing trend, from 16 months in 2002 to 36 months in 2010.
Table 1.2.2.3: First or Fellow Eye Surgery, CSR 2002-2010
Year 2002 2003 2004 2007 2008 2009 2010
No of patients (N) 12798 16815 18392 18426 21496 24438 28506
n % n % n % n % n % n % n %
First eye surgery 8958 70.0 11851 70.5 12911 70.2 12810 69.5 14610 68.0 16446 67.3 18919 66.4 Fellow eye surgery 3840 30.0 4964 29.5 5481 29.8 5559 30.2 6849 31.9 7938 32.5 9441 33.1
Missing NA - NA - NA - 57 0.3 37 0.2 54 0.2 146 0.5
Patients who had
second surgery in the same year
573 4.5 713 4.2 825 4.5 759 4.1 1135 5.3 2702 11.1 2129 7.5
Period of time between irst and fellow eye surgery (Months)
N 2716 3322 3673 4860 5953 7353 9378
Mean 16.7 16.3 16.9 23.4 22.0 24.4 36.1
SD 18.0 17.1 18.8 24.3 22.8 31.5 43.6
Median 10.3 10.1 10.5 13.3 13.1 12.1 15.1
Patients who
had cataract surgery before
3840 4964 5481 5559 6849 7938 9441
n % n % n % n % n % n % n %
1.2.2.4 Past Ocular Surgery of the Operated Eye
CATARACT SURGERY REGISTRY 2010
: CHAPTER 1
Table 1.2.2.4: Past Ocular Surgery of the Operated Eye, CSR 2002-2010
Year 2002 2003 2004 2007 2008 2009 2010
No. of patients 12798 16815 18392 18426 21496 24438 28506
No. of eyes with
past ocular surgery record (N)
12798 16782 18372 17379 20674 23109 26711
n % n % n % n % n % n % n %
Patients with no
past ocular surgery
12414 97.0 16178 96.4 17711 96.4 16545 95.2 20010 96.8 22387 96.9 25870 96.9
Vitreoretinal surgery 8959 0.7 1510 0.9 1653 0.9 261 1.4 161 0.8 267 1.2 352 1.3
Pterygium excision 77 0.6 1177 0.7 92 0.5 869 0.5 140 0.7 164 0.7 21 0.1
Filtering surgery 77 0.6 1007 0.6 1102 0.6 1043 0.4 57 0.3 69 0.3 65 0.2
Penetrating
keratoplasty
13 0.1 168 0.1 184 0.1 1738 0.1 14 0.1 18 0.1 212 0.8
Others 1408 1.1 235 1.4 276 1.5 417 2.4 304 1.5 216 0.9 203 0.8
Number or percentage may be more than total or 100% as patients might have more than one past ocular surgery
Figure 1.2.2.4 Percent Distribution of Past Ocular Surgery of the Operated Eye, CSR 2002-2010
1.2.2.5 Preexisting Ocular Co-morbidity
10
Table 1.2.2.5: Distribution of Pre-existing Ocular Co-Morbidity, CSR 2002-2010
Year 2002 2003 2004 2007 2008 2009 2010 No of patients (N) 12798 16815 18392 18426 21496 24438 28506
N % n % n % n % n % n % n %
Patients with any ocular co-morbidity 3691 28.8 6068 36.1 6993 38.0 5973 32.4 7269 33.8 9442 38.6 11977 42.0
Patients with speciic ocular co-morbidity
Anterior segment
1. Glaucoma 795 6.2 1096 6.5 1238 6.7 1126 6.1 1408 6.6 1655 6.8 1799 6.3
2. Pterygium involving the cornea 342 2.7 393 2.3 349 1.9 288 1.6 319 1.5 345 1.4 387 1.4
3. Pseudoexfoliation 184 1.4 254 1.5 209 1.1 221 1.2 253 1.2 318 1.3 289 1.0
4. Corneal opacity 184 1.4 200 1.2 183 1.0 176 1.0 194 0.9 231 0.9 251 0.9
5. Chronic uveitis 54 0.4 48 0.3 80 0.4 81 0.4 63 0.3 80 0.3 89 0.3
Len related complication
1. Phacomorphic 106 0.8 152 0.9 118 0.6 89 0.5 85 0.4 83 0.3 120 0.4
2. Phacolytic 61 0.5 63 0.4 79 0.4 44 0.2 45 0.2 47 0.2 59 0.2
3. Subluxated/Disclosed 87 0.7 110 0.7 86 0.5 101 0.5 89 0.4 83 0.3 95 0.3
Posterior segment
1. Diabetic Retinopathy: Non Proliferative 642 5.0 965 5.7 956 5.2 1125 6.1 1273 5.9 916 3.7 996 3.5 2. Diabetic Retinopathy: Proliferative 218 1.7 366 2.2 510 2.8 465 2.5 614 2.9 1307 5.3 1973 6.9
3. Diabetic Retinopathy: CSME* 96 0.8 177 1.1 163 0.9 198 1.1 221 1.0 278 1.1 346 1.2
4. Diabetic Retinopathy: Vitreous haemorrhage 66 0.5 106 0.6 138 0.8 176 1.0 165 0.8 230 0.9 250 0.9
5. ARMD 145 1.1 215 1.3 308 1.7 231 1.3 259 1.2 387 1.6 462 1.6
6. Other macular disease (includes hole or scar) 77 0.6 106 0.6 140 0.8 118 0.6 148 0.7 188 0.8 277 1.0
7. Optic nerve disease, any type 43 0.3 76 0.5 78 0.4 71 0.4 69 0.3 118 0.5 149 0.5
8. Retinal detachment 70 0.5 177 1.1 247 1.3 218 1.2 204 0.9 294 1.2 308 1.1
9. Cannot be assessed 884 6.9 1962 11.7 2290 12.5 1357 7.4 2092 9.7 3139 12.8 4457 15.6
Miscellaneous
1. Amblyopia 64 0.5 61 0.4 78 0.4 71 0.4 65 0.3 62 0.3 75 0.3
2. Significant previous eye trauma 52 0.4 80 0.5 96 0.5 41 0.2 39 0.2 39 0.2 51 0.2
3. Pre-existing non glaucoma field defect 2 0.0 3 0.0 4 0.0 4 0.0 2 0.0 6 0.0 3 0.0
4. Others 380 3.0 827 4.9 1153 6.3 668 3.6 755 3.5 1053 4.3 1321 4.6
*CSME=Clinically Signiicant Macular Oedema
CATARACT SURGERY REGISTRY 2010
: CHAPTER 1
Figure 1.2.2.5: Percent Distribution of Eyes with Diabetic Retinopathy, Glaucoma or Lens-induced Glaucoma, CSR 2002-2010
1.2.2.6 Pre-operative Vision
The proportion of eyes with unaided vision in the blindness category (2/60-NPL) appeared to be decreasing. Conversely, the proportion of these eyes in the low vision category (6/18-3/60) was in an upward trend. However, the proportion of eyes with refracted vision in each category of vision remained unchanged.
In each year, more than 70% of all patients did not have refraction pre-operatively. The bimodal pattern of pre-operative vision remained the same over the years. The first peak was at 6/18 and the second peak was at CF/HM. There was a low proportion of patients between 5/60 to1/60.
Table 1.2.2.6: Distribution of Pre-Operative Vision, CSR 2002-2010
Year 2002 2003 2004 2007 2008 2009 2010
No. of patients (N)
12798 16815 18392 18426 21496 24438 28506
n % n % n % n % n % N % n %
Patients with
unaided VA 12691 99.2 16723 99.4 18222 99.1 18356 99.6 21212 98.7 23796 97.4 27977 98.1 Patients with
refracted VA 700 5.5 2104 12.6 2319 12.7 5071 27.8 5683 26.4 5150 21.1 7895 27.7
Patients with
no refraction
12098 94.5 14711 87.5 16073 87.4 13355 72.5 15813 73.6 19288 78.9 20611 72.3
6/5-
6/12 UnaidedRefracted 155281 22.12.2 327396 15.52.4 523396 17.12.9 678602 13.33.3 935646 16.43.0 944788 18.3 1474 18.73.3 1016 3.6 6/18-
3/60 Unaided 4465 35.2 6440 38.5 7235 39.7 7734 42.4 9375 44.2 10849 45.6 13073 46.7Refracted 374 53.4 1198 56.9 1315 56.7 2375 46.9 2892 50.9 2796 54.3 4324 54.8 2/60-
12
THE 4
thREPORT OF THE NATIONAL EYE DATABASE 2010
CHAPTER 1 :
CATARACT SURGERY REGISTRY 2010
Figure 1.2.2.6(a): Distribution of Pre-Operative Vision (Unaided/presenting and refracted), CSR 2002-2010
2002 2003
2004 2007
2008 2009
CATARACT SURGERY REGISTRY 2010
: CHAPTER 1
Figure 1.2.2.6(b): Distribution of Pre-Operative Vision (Unaided/presenting), CSR 2002-2010
14
THE 4
thREPORT OF THE NATIONAL EYE DATABASE 2010
CHAPTER 1 :
CATARACT SURGERY REGISTRY 2010
1.2.2.7 Target Refractive Power
The mean target refractive power in 2010 was -0.4D (SD 0.4), with minimum at -9.1D and maximum at +6.0D. The percentage of eyes aimed to have target refraction within (-0.5 to 0 D) increased slightly to 62.1% in 2010. Overall data demonstrated that most surgeons participated in CSR aimed to give patient either emmetropic or slightly myopic refraction post- operatively.
Table 1.2.2.7(a): Distribution of Target Refractive Power, CSR 2007-2010
Year 2007 2008 2009 2010
Operated eye ( N) 11876 15083 20279 24524
Mean -0.5 -0.1 -0.4 -0.4
SD 0.4 0.4 0.4 0.4
Median -0.5 -0.5 -0.5 -0.4
Minimum -9 -9.9 -9.9 -9.1
Maximum +5 +9.5 +5.9 +6.0
Table 1.2.2.7(b): Distribution of Target Refractive Power, CSR 2007-2010
Year 2007 2008 2009 2010
-1-<(-0.5) 4299 36.2 6151 40.8 7972 39.3 7590 31.0
-0.5-<0 6077 51.2 7480 49.6 10604 52.3 15218 62.1
CATARACT SURGERY REGISTRY 2010
: CHAPTER 1
Values outside the +10D and -10D were excluded from analysis as they would skew the mean.
1.3
CATARACT SURGICAL PRACTICES
1.3.1 Number of Cataract Surgery by SDP
Majority of SDPs performed between 100-1000 cataract surgeries per year.
Table 1.3.1: Range of Cataract Surgery Registered by SDP per year, Census versus CSR 2002-2010
Year 2002 2003 2004 2007 2008 2009 2010
Census CSR Census CSR Census CSR Census CSR Census CSR Census CSR Census CSR
No. of SDP
29 25 31 32 32 33 33 32 36 36 36 36 36 36
Census CSR Census CSR Census CSR Census CSR Census CSR Census CSR Census CSR
<100 4 1 1 5 2 4 1 3 1 1 1 1 1 1
100-500 13 15 11 10 14 15 15 14 15 15 12 15 10 13
501-1000 7 5 15 14 8 9 8 8 11 11 14 12 14 12
>1000 5 4 4 3 8 5 9 7 9 9 9 8 11 10
1.3.2 Number of Cataract Surgery by Month
The number was lower than average in February and September.
Table 1.3.2: Number of Cataract Surgery by Month, CSR 2002-2010
Year 2002 2003 2004 2007 2008 2009 2010
No. of patients (N)
12798 16815 18392 18426 21496 24438 28506
Month n % n % n % n % n % n % n %
January 1064 8.3 1399 8.3 1265 6.9 1579 8.6 1862 8.7 1668 6.8 2347 8.2
February 838 6.5 1197 7.1 1424 7.7 1290 7.0 1653 7.7 1884 7.7 1985 7.0 March 1166 9.1 1389 8.3 1782 9.7 1782 9.7 1812 8.4 2122 8.7 2850 10.0
April 986 7.7 1495 8.9 1868 10.2 1625 8.8 2321 10.8 2295 9.4 2714 9.5
May 1018 8.0 1364 8.1 1426 7.8 1618 8.8 1871 8.7 2036 8.3 2559 9.0
June 1127 8.8 1400 8.3 1778 9.7 1476 8.0 1950 9.1 2086 8.5 2591 9.1
July 1207 9.4 1862 11.1 1854 10.1 1808 9.8 2049 9.5 2322 9.5 2670 9.4
August 1210 9.5 1538 9.1 1447 7.9 1814 9.8 1791 8.3 1975 8.1 2401 8.4
September 1184 9.3 1530 9.1 1626 8.8 1486 8.1 1462 6.8 1572 6.4 1659 5.8
October 1346 10.5 1666 9.9 1513 8.2 1376 7.5 1552 7.2 2266 9.3 2447 8.6
November 1003 7.8 917 5.5 1077 5.9 1443 7.8 1646 7.7 2006 8.2 2102 7.4