THE COMPARISON ANALYSIS BETWEEN SHIPPING FEES AND
WITHOUT SHIPPING FEES OF ONLINE SHOP CUSTOMER
RETENTION IN MANADO
ANALISIS PERBANDINGAN ANTARA BIAYA PENGIRIMAN DAN NON BIAYA
PENGIRIMAN DARI TOKO ONLINE TERHADAP
RETENSI PELANGGAN DI KOTA MANADO
Ridzkiyah Ayu Prasty Paputungan
International Business Administration Program, Economics and Business Faculty, Sam Ratulangi University, Manado 95115, Indonesia
Email: [email protected]
ABSTRACT
The online shop is a place where people can buy goods and services over the internet. Contrast to offline shop, online shop enthusiasts can shop through different cities and countries. With the cheaper price than offline shop, the online shop reaches the top of the world trade in a short time. This study aim to examine the significant difference between Shipping Fees and Without Shipping Fees of Online Shop Customer Retention in Manado. 100 customers of the online shop were surveyed rondomly as samples. Based on the Data Analysis and Discussion, There is a significant difference in Customer Retention between With Shipping Fees and Without Shipping Fees. Customer Retention of Without Shipping Fees is better than With Shipping Fees.
Keywords: Online Shop, With Shipping Fees, Without Shipping Fees, Customer Retention .
ABSTRAK
Toko online adalah tempat di mana orang-orang dapat membeli barang-barang dan jasa melalui internet, berbeda dengan toko offline, pelanggan toko online dapat berbelanja dimana saja seperti antara kota bahkan di mancanegara. Dengan harga produk yang sering lebih murah jika dibanding toko offline, toko online menjangkau perdagangan dunia dalam waktu singkat. Tujuan Studi ini untuk menguji perbedaan antara pembelian produk dengan biaya pengiriman dan non biaya pengiriman terhadap retensi pelanggan di Kota Manado. 100 pelanggan toko online telah disurvei secara acak sebagai sampel penelitian. Berdasarkan analisa data dan diskusi penelitian, terdapat perbedaan penting pada retensi pelanggan terhadap pembelian produk dengan biaya pengiriman dan tanpa biaya pengiriman. Retensi pelanggan menjadi lebih baik saat membeli produk dengan tanpa biaya pengiriman jika dibandingkan dengan produk dengan biaya pengiriman.
1.
INTRODUCTION
Research Background
The online shop is a place where people can buy goods and services over the internet. Contrast to offline shop, online shop enthusiasts can shop through different cities and countries. With the cheaper price than offline shop, the online shop reaches the top of the world trade in a short time. As we know, shopping online on the internet has become the lifestyle of people in big town. In addition through the website, online shop offender is facilitated by their smartphone with a way to talk to each other directly using smart messenger application. What interesting here, people do not need to buy a ticket if there are items they want to purchase outside the city, outside the island or even in aboard. When people want to buy some stuff from online shop, they do not need to meet face to face. They just tell what they want to buy using e-mail, comment on the website or chat via smartphone messenger. After agree with the price customer have to pay for the shipping fee. Some people still interested to buy but there are also some people discouraged to buy because the shipping fee makes the price of products more expensive. Many customers are complaint about the shipping fee. Survey evidence indicates that shipping fees are the main complaint of more than 50 percent of online shoppers and more than 60 percent of shoppers have abandoned an order when shipping fees are added (Jupiter, 2000; Ernst and Young, 1999).
Shipping fees are, therefore, relevant to the larger issue of how marketing tactics impact customer acquisition (Thomas, 2001) and repeat buying (Hsieh et. al., 2005; Srinivasan et. al., 2002). Discussions of customer acquisition and retention have tended to focus on the differences in the cost to acquire a customer versus the cost to retain a customer. While the conventional wisdom is that it costs considerably more to acquire than to retain a customer (Peppers and Rogers, 1993) it is often a difficult empirical task to separate acquisition and retention efforts (Thomas, 2001). There are a lot of online shops in Indonesia. Most of the online shop is using the website to promote the products also using their smartphone messenger application or other useful applications and charged the shipping fee to send the products to their customers. Most of them in several cities like Jakarta, Bandung, Surabaya and Batam become a secondhand for import products and firsthand for domestic.
In Manado, there are a lot of online shops which is also as the third hand. They are sell a bags, shoes, beauty cares, cosmetics, toys, dress and food. Some of the online shops still charged a shipping fee for their products but some of them are not using a shipping fee anymore. Sometimes many online shops as a third hand will order the products to their supplier as a secondhand when their customers are order first with put the shipping cost beyond price of the products, but a few online shop are not charged the shipping cost because they do not need to wait their customers to order first. They already stock the products in a large amount. This is a strategy of some online shop to not to put the shipping cost outside the price of the products. Because in general if most of customers are in the same city, the customers can take the orders by them self so do not need to charge the shipping cost to each home.
Research Objectives
Literature Review
Marketing
In Kotler et. al., (2009) marketing deals with identifying and meeting human and social, in social definition marketing is: “A societal process by which individuals and groups obtain what they need and what through creating, offering, and freely exchanging products and services of value with others”. According to Chow and Holden (1997) in Graf and Perrien (2005) marketing has been defined as:“In spite of certain difficulties measuring trust and a divergence of opinions, a consensus has emerged in the literature defining trust an expectation on the part of individuals that the written or, verbal words, promises or statements, of another individual are reliable.”
Market
According to Kotler, et. al (2004) :“A market is the set of actual and potential buyers of a product. These buyer share particular needs or wants that can be satisfied through exchange relationship”. A market is a place for seller and buyer for exchanging the product and value. In market the consumer can find what the products’ they are searching for, and also can fulfilled their needs and wants. Different with, Kotler, et. al. (2009) defines market as: “Traditionally, a market was a physical place where buyer and seller gathered to buy and sell goods”. Today market as defines as the place for buyer and seller to exchanges. Nowadays, we can’t judges market only as a “physically” place. Because of, market now has growing widely, which is we also can find market not only as “physically” but also as “digitally”.
Consumer Motivation in Shopping
According to Tauber (1972) in Jamal, et al. (2006) assessed there are five personal motives in shopping; The role-playing motive is refers to the activity which it’s become a routine activity for several people, such as housewife; Diversion highlights shopping’s ability to present opportunities to the shopper to escape from the routines of daily life; Self-gratification underlines the shopping’s potential to alleviate depression as shoppers can spend money and buy something nice when they are in a down mood; Physical activity focuses on consumers’ need for engaging in physical exercise by walking in spacious and appealing retail centers, particularly when they are living in urban and congested environments; and Sensory stimulation emphasizes the ability of the retail institutions to provide many sensory benefits to consumers as they can enjoy the physical sensation of handling merchandise, the pleasant background music and the scents.
purpose of this activity is to find a bargain; and, Anticipated utility - the aim of the shopping is to obtain the product. Shoppers expect to gain the utility offered by the product purchased.
Delivery
In delivery, Ming and Hsiao, (2008) has pointed out: “After paying for the product, consumers can generally receive it immediately if they purchase it at a physical store, except for some special items such as furniture, which needs home delivery service. By online shopping, however, consumers will have to wait for the product delivery”.
Previous Research
Michael Lewis (2006), research title: The effect of shipping fees on customer acquisition, customer retention, and purchase quantities. By used variables of Shipping Fees; E-commerce; Customer acquisition; Customer retention, found that The growth of Internet-based commerce has increased the attention paid to shipping fees and other fulfillment issues. Researchers have examined how fulfillment affects customer satisfaction (Trocchia and Janda 2003), return behavior (Hess and Mayhew 1997; Hess et al. 1996; Wood 2001), and firm profits (Sawhney 1999, Pyke et al. 2001). Laboratory research has also focused on how consumers evaluate partitioned prices such as shipping fees (Morwitz et al. 1998). Our findings add to the literature by highlighting the relationship between shipping fee structure and order incidence, customer acquisition, and order size. In addition, future analysis could consider firm profitability of different schemes.
Yinghui Yang, Skander Essegaier and David R. Bella (2005), research title: Free Shipping and Repeat Buying on the Internet: Theory and Evidence. By used variables of Free Shipping; Internet; Retailing; Shopping Behavior, found that While we show how thresholds and prices affect consumer behavior through the optimal shopping policy we do not address the optimal choice of thresholds or prices by firms. Whether the firm prefers customers to visit frequently and place small orders or less frequently and place large order depends upon the cost of shipping and other factors not considered here.
Conceptual Framework
Figure 1. Conceptual Framework
Source: Literature reviews, 2016
2.
RESEARCH METHODS
Type of Research
This research using quantitative approach and a comparative research to compare the respondent statement about the Shipping Fees.
Source of Data
All of the data sources on this research are gathered from primary data and secondary data. Sources of evidence to obtain data necessary to answer the research questions are questioner (as primary data) and documents (as secondary data).
Primary and Secondary Data
Primary data is data originated by the researcher for the specific purpose of addressing the research problem. Obtaining primary data can be expensive and time-consuming because it involves all size step of the marketing research process”. (Malholtra, 2009). The primary data are collected from questionnaire and face-to-face interview. Questionnaire is a pre-formulated written set of questions to which respondents record their answers, usually within rather closely defined alternatives. Questionnaire is an efficient data collection mechanism by which measure the variables of interest” (Sekaran, 2009). Secondary data include information made available by business and government source, commercial marketing research firms, and computerized data based. Secondary data are an economical and quick source of background information. Secondary data can provide valuable insight into the problem situation and lead to the identification of innovative course of action” (Malhotra, 2009).
Population and Sample
According to Malhotra (2009), population is the aggregate of all elements, sharing some common set of characteristics that comprise the universe for the purpose of the marketing research problem. The population of this research is shopper either shopping in physical store or shopping in online store. According to Malhotra (2009), sample is a subgroup of the element of the population selected for participation in the study. The sample of this research is shopper in Manado as many as 100 respondents that already shopping in physical store shopping and online shopping. The sampling design is convenience sampling that is considered as the best way of getting some basic information quickly and efficient.
Online Shop with Shipping Fees
Online Shop without Shipping Fees
Operational Definition and Measurement of Research Variable
This research will determine the Consumer Retention by several measurements regarding the shipping fee. Those indicators are: The information of shipping fee is ease; Price of shipping fee related to delivering quality; Shipping fee is affordable; Price low with shipping fee; Price high without shipping fee; Shipping fee makes faster delivering a product; Customers are agreeing with shipping fee as long as the product accepted without disabilities or dis-fuctionalities; Shipping fee help customer receiving a product right in home or any point pointed by them; Shipping fee may increase customer trust; and Shipping fee makes customer cancel to purchase or buy morbidly.
A scale is a tool or mechanism by which individuals are distinguished as to how they differ from one to another on the variables of interest to our study. Likert Scale as “An Interval scale that specifically uses the five response categories ranging from ‘strongly disagree’ to ‘strongly agree’ which requires the respondents to indicate a degree of agreement or disagreement with a series of statements related to the stimulus”. By using the Likert Scale, respondents will not have problems in understanding and filling out the questionnaire, and it is easy for the researcher to measure, interpreting and analyze the data.
Data Analysis Method
This given section will be explained about the overall analysis methods that are used in this current research.
Reliability and Validity Test
The questionnaire design is conducted to perform validity and reliability test and to prove the truth of hypothesis and to know the relation rate between variable Y and variable X. From the result of research’s analysis conducted that questionnaire design with Pearson correlation coefficient more than 0.3 indicates valid and alpha coefficient more than 0.6000, so questionnaire design indicates reliable.
Reliability Test
The usefulness of this reliability test is to ensure that the questionnaire is consistent. To make sure that all question in the questionnaire is reliable, the measurement of internal consistency must be made, which will define the correlation between questions items that is evaluated the same factor. This can be seen by the Alpha Cronbach Parameter, with ideal score above 0.6.
Validity Test
Independent Sample T-Test
Independent t-test involves examination of the significant differences on one factor or dimension (dependent variable) between means of two independent groups (e.g., male vs. female, with disability vs. without disability) or two experimental groups (control group vs. treatment group). For example, you might want to know whether there is a significant difference on the level of social activity between individuals with disabilities and individuals without disabilities.
3.
RESULTS AND DISCUSSION
Validity Test
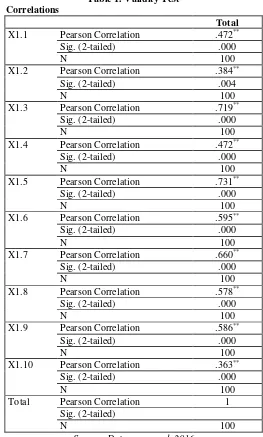
Table 1. Validity Test Correlations
Total
X1.1 Pearson Correlation .472**
Sig. (2-tailed) .000
N 100
X1.2 Pearson Correlation .384**
Sig. (2-tailed) .004
N 100
X1.3 Pearson Correlation .719**
Sig. (2-tailed) .000
N 100
X1.4 Pearson Correlation .472**
Sig. (2-tailed) .000
N 100
X1.5 Pearson Correlation .731**
Sig. (2-tailed) .000
N 100
X1.6 Pearson Correlation .595**
Sig. (2-tailed) .000
N 100
X1.7 Pearson Correlation .660**
Sig. (2-tailed) .000
N 100
X1.8 Pearson Correlation .578**
Sig. (2-tailed) .000
N 100
X1.9 Pearson Correlation .586**
Sig. (2-tailed) .000
N 100
X1.10 Pearson Correlation .363**
Sig. (2-tailed) .000
N 100
Total Pearson Correlation 1
Sig. (2-tailed)
N 100
Table above shows all indicator of Independent Variable of Customer Retention (X1.1 – X1.10) are stated valid because the correlation value is above 0.3.
Reliability Test
Table 2. Reliability Test
Cronbach's Alpha N of Items
.747 10
Source: Data processed, 2016
From the SPSS output above shows the Cronbach’s Alpha Value of Customer Retention = 0.747 bigger than 0.60 means that this research instrument is stated reliable.
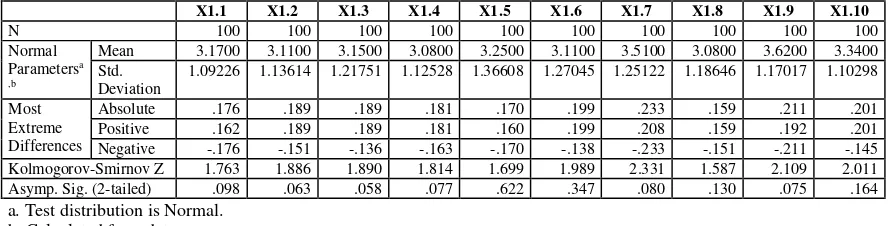
Normality Assumption
1.09226 1.13614 1.21751 1.12528 1.36608 1.27045 1.25122 1.18646 1.17017 1.10298
Most close to, the distribution of data with normal distribution pattern (data distribution is not skewed to the left or right).
Analysis:
Ho : The population is normally distributed, Ha : The population is not normally distributed.
The criteria of decision making is based on the probability If the probability value > 0.05 so Ho received,
If the probability value ≤ 0.05 then Ho is rejected.
Based on the table above further decision are resulted as follows:
4. It appears that a significant column (Asymp. Sig (2-tailed)) for X1.4 is 0.077 or more than 0.05 then the probability of Ho received a population mean of X1.4 normally distributed.
5. It appears that a significant column (Asymp. Sig (2-tailed)) for X1.5 is 0.622 or more than 0.05 then the probability of Ho received a population mean of X1.5 normally distributed.
6. It appears that a significant column (Asymp. Sig (2-tailed)) for X1.6 is 0.347 or more than 0.05 then the probability of Ho received a population mean of X1.6 normally distributed.
7. It appears that a significant column (Asymp. Sig (2-tailed)) for X1.7 is 0.080 or more than 0.05 then the probability of Ho received a population mean of X1.7 normally distributed.
8. It appears that a significant column (Asymp. Sig (2-tailed)) for X1.8 is 0.130 or more than 0.05 then the probability of Ho received a population mean of X1.8 normally distributed.
9. It appears that a significant column (Asymp. Sig (2-tailed)) for X1.9 is 0.075 or more than 0.05 then the probability of Ho received a population mean of X1.9 normally distributed.
10.It appears that a significant column (Asymp. Sig (2-tailed)) for X1.10 is 0.164 or more than 0.05 then the probability of Ho received a population mean of X1.10 normally distributed.
Compare Means based on Customer Retention divided as With Shipping Fees and Without Shipping Fees
Table 4. Group Statistics
Fee N Mean Std. Deviation Std. Error Mean
Total With Shipping Fees 50 38.1000 3.18318 .45017 Without Shipping Fees 50 26.7400 3.45708 .48891
Source: Data processed, 2016
From the table above we can see the differences between the independent samples based on group of gender 1 and 2 which is defined as With Shipping Fees and Without Shipping Fees. Mean of this table calculates from total respondent’s answers of Customer Retention (X1– X10). Samples are distributed to 100 respondents of Customer Retention Divided by With Shipping Fees and Without Shipping Fees. With Shipping Fees is 38.1 and without Shipping Fees is 26.74 This means, based on the mean parametric the Customer Retention of With Shipping Fees generally better than Without Shipping Fees.
Independent Sample t-test for Customer Retention
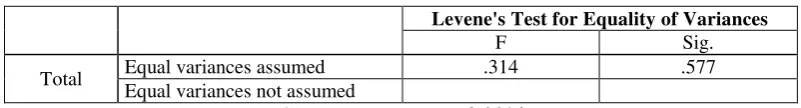
Table 4. Homogeneity Test of Customer Retention
Levene's Test for Equality of Variances
F Sig.
Total Equal variances assumed .314 .577
Equal variances not assumed
Source: Data processed, 2016
homogeneous. Because the data is homogeneous this research use the interpretation of Equal variances assumed for the table below.
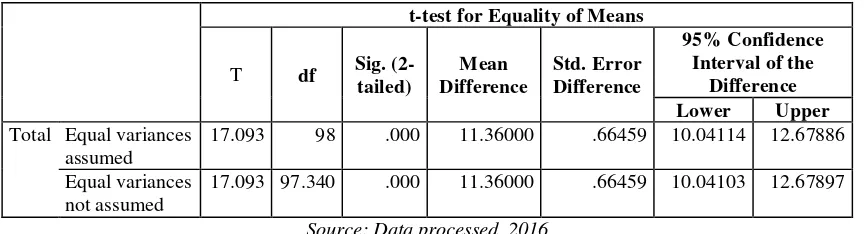
Table 5. Independent Samples T-Test
t-test for Equality of Means
T df Sig. (2-tailed)
Mean Difference
Std. Error Difference
95% Confidence Interval of the
Difference Lower Upper
Total Equal variances assumed
17.093 98 .000 11.36000 .66459 10.04114 12.67886
Equal variances not assumed
17.093 97.340 .000 11.36000 .66459 10.04103 12.67897
Source: Data processed, 2016
The table above is information about the difference among With Shipping Fees and Without Shipping Fees of Customer Retention by total of ten indicators which are X1.1 until X1.10. Normality test result shows that both groups of subjects in the study had a normal distribution. Homogeneity test results of 0.577 bigger than 0.05 shows that the variance between the study samples was homogeneous. Based on Table above the Mean of Attitude of Customer Retention, it shows that there are differences in the average perception of a significant, means more positive perception of Customer Retention of With Shipping Fees than Without Shipping Fees. In the table above can be seen that the value t = 17.093 with a significance of p = 0.000 (p > 0.05) indicates that the HA, is acceptable. Which means there are significant differences between With Shipping Fees and Without Shipping Fees of Customer Retention.
Discussion
4.
CONCLUSIONS
Based on the Data Analysis and Discussion, There is a significant difference in Customer Retention between With Shipping Fees and Without Shipping Fees. Customer Retention of Without Shipping Fees is better than With Shipping Fees. The conclusions of this research concluded as follows:
1. The result of the research on the parametric the Customer Retention With Shipping Fees is 38.1 and Without Shipping Fees is 26.74 This means, With Shipping Fees generally better than Without Shipping Fees.
2. The result of the Mean of Attitude of Customer Retention, it shows that the value t = 17.093 with a significance of p = 0.000 (p > 0.05) indicates that the HA, means more positive perception of Customer Retention of With Shipping Fees than Without Shipping Fees.
REFERENCES
Papers in Journals
[1] Andrews, Rick., and Currim, Imran. (2004). “Behavioral Differences Between Consumers Attracted to Shopping Online vs. Traditional Supermarkets: Implications for Enterprise Design and Marketing Strategy,” International Journal of Marketing & Advertising, 1, 1, 38–61.
[2] Arnold, M. J., and Reynolds, Kristy. E. (2003). Hedonic Shopping Motivations. Journal of Retailing, 79 (2), 77-95.
[3] Bakos, Yannis (1997). “Reducing Buyer Search Costs: Implications for Electronic Marketplaces,” Management Science, 43, 12, 1676–92.
[4] Brynjolfsson, Erik., and Smith, Michael D. (2000). “Frictionless Commerce? A Comparison of Internet and Conventional Retailers,” Management Science, 46, 4, 563–85.
[5] Budisantoso, T., and Mizerski, K. (2010). The Influence of Shopping Motivation, Optimum Stimulation Level, Perception of Store Atmosphere, and Satisfaction on Repatronage Intention.
[6] Cardoso, P. R., and Pinto, S.C. (2010). Hedonic and utilitarian shopping motivations among Portuguese young adult consumers. International Journal of Retail & Distribution Management. 38(7): 538-558.
[7] Chow, S., and Holden. R. (1997). Toward an Understanding of Loyalty: The Moderating Role of Trust, Journal of Managerial Issues, Vol. 9, No 3, pp. 275-298.
[8] Chu, Junhong Chu., Arce-Urriza, Marta., Cebollada-Calvo, José-Javier., and Chintagunta, Pradeep K. (2010). An Empirical Analysis of Shopping Behavior Across Online and Offline Channels for Grocery Products: The Moderating Effects of Household and Product Characteristics.
[9] Danaher, Peter J., Wilson, Isaac W., and Davis, Robert A. (2003). “A comparison of Online and Offline Consumer Brand Loyalty,” Marketing Science, 22, 4, 461–76.
[10] Degeratu, Alexandru M., Rangaswamy, Arvind., and Wu, Jianan. (2000). “Consumer Choice Behavior in Online and Traditional Supermarkets: The Effects of Brand Name, Price, and Other Search Attributes, ” International Journal of Research in Marketing, 17, 1, 55–78.
[11] Ernst and Young. (1999). Third Annual Online Retailing Report.
[13] Jamal, A. et al. (2006). Profiling Consumers: A study of Qatari consumers shopping motivations. Journal of Retailing and Consumer Services, 13, 67-80. http://dx.doi.org/10.1016/j.jretconser.2005.08.002.
[14] Lal, Rajiv and Sarvary, Miklos. (1999). “When and How Is the Internet Likely to Decrease Price Competition?” Marketing Science, 18, 4, 485–503.
[15] Lewis, Michael. (2006). The effect of shipping fees on customer acquisition, customer retention, and purchase quantities. Journal of Retailing 82 (1, 2006) 13–23.
[16] Lynch, John G. and Ariely, Dan.(2000). “Wine Online: Search Costs Affect Competition on Price, Quality and Distribution,” Marketing Science, 19, 1, 83–103.
[17] Soegoto, Agus Supandi (2013) Persepsi Nilai Dan Kepercayaan Terhadap Kepuasan Dan Dampaknya Terhadap Loyalitas Konsumen. Jurnal EMBA Vol.1 No.3 September 2013, Hal. 1271-1283
[18] Srinivasan, Srini., Anderson, Rolph., and Ponnavolu, Kishore. (2002). "Customer Loyalty in E-Commerce: An Exploration of Its Antecedents and Consequences," Journal of Retailing, 78 (1), 41–50.
[19] Tauber, E. M. (1972). Why do people shop? Journal of Marketing, 36, 46-59. http://dx.doi.org/10.2307/1250426.
[20] Thomas, J. (2001). "A Methodology for Linking Customer Acquisition to Customer Retention," Journal of Marketing Research, 38 (May), 262–268.
Proceeding
[21] Graf, R. and Perrien, J. (2005). “The Role of Trust and Satisfaction in a Relationship: the Case of High Tech Firms and Banks”, Proceedings of the European Marketing Association Conference, Milan, Italy.
Books
[22] Assauri, Sofjan, 2011. Manajemen Pemasaran. Cetakan ke-11. Penerbit PT RajaGrafindo Persada. Jakarta.
[23] Churchill, Jr. Gilbert A., and Iacobucci, Dawn. (2005). Marketing Research Methodological Foundations 9e, Thomson South-Western.
[24] Jupiter Communications (2000). “Creating Loyalty: Building Profitable Relationships,” Jupiter Vision Report: Digital Commerce, Vol. 2.
[25] Kotler, P. (2004), Principles of Marketing: European Edition, Prentice Hall.
[26] Kotler, P., Wong, V., Saunders, J., and Armstrong, G. (2009) Principles of Marketing. 8th euro ed. FT/Prentice Hall.
[27] Malhotra, Naresh K. (2009). Riset Pemasaran Pendekatan Terapan Jilid 1. Jakarta:PT Index. 67, 124.
[28] Ming and Hsiao. (2008). Shopping mode choice: Physical store shopping versus e-shopping.
[29] Peppers, D. and Rogers, M. (1993). The One to One Future. New York, NY: Doubleday. [30] Pyke, D., M.E. Johnson and P. Desmond (2001). "E-Fulfillment, It’s Harder Than It
Looks," Supply Chain Management Review, (January/February), 26–32.
[31] Sekaran, U. (2009). Research Methods For Business Metodologi Penelitian Untuk Bisinis Buku I Edisi 4, Penerbit Salemba Empat, Jakarta.
[32] Yang, Yinghui., Essegaier, Skander., and Bell, David. R. (2005). Free Shipping and Repeat Buying on the Internet: Theory and Evidence.
[33] Yin. (1994). Research for Designers: A Guide to Methods and Practice. 78-80.