Achievement
The Potential Tradeoff between Teacher
Quality and Class Size
Christopher Jepsen
Steven Rivkin
a b s t r a c t
This paper investigates the effects of California’s billion-dollar class-size-reduction program on student achievement. It uses year-to-year differences in class size generated by variation in enrollment and the state’s class-size-reduction program to identify both the direct effects of smaller classes and related changes in teacher quality. Although the results show that smaller classes raised mathematics and reading achievement, they also show that the increase in the share of teachers with neither prior experience nor full certification dampened the benefits of smaller classes, particularly in schools with high shares of economically disadvantaged, minority students.
I. Introduction
In the summer of 1996, California enacted the most expensive state-level education reform in U.S. history. The state’s class-size-reduction (CSR) pro-gram reduced K-3 class sizes throughout the state by roughly ten students per class,
Christopher Jepsen is an assistant professor of economics at the University of Kentucky. Steven Rivkin is a professor of economics at Amherst college, National Bureau of Economic Research, and University of Texas at Dallas respectively. The authors thank three anonymous referees, Mark Baldassare, Julian Betts, David Figlio, Gary Hart, Caroline Minter Hoxby, Robert McMillan, Kim Rueben, Jon Sonstelie, Geoffrey Woglom, and seminar participants at the Public Policy Institute of California, Stanford University, NBER, the Fall 2001 APPAM conference, and the 2003 SOLE meetings for their many helpful comments. They also thank Anne Danenberg for invaluable data support and Pedro Cerdan, Jackie Chou, and Shelley de Alth for excellent research assistance. Financial support for Rivkin was provided by Smith Richardson Foundation, Spencer Foundation, Mellon Foundation and Hewlett Foundation. The data used in this article can be obtained beginning July 2009 through June 2012 from Christopher Jepsen, Department of Economics, 335BA Gatton B&E Building, Lexington, KY 40506-0034 jepsen@uky.edu.
½Submitted June 2006; accepted October 2007
ISSN 022-166X E-ISSN 1548-8004Ó2009 by the Board of Regents of the University of Wisconsin System
from 30 to 20, at an annual cost that exceeds one billion dollars. CSR required schools to decrease class size in first and second grade prior to reducing the size of kindergarten (KG) and third grade classes. School participation in first and second grades exceeded 90 percent statewide by 1998, but participation in KG and third grade did not exceed 90 percent until 2000.
Given the sheer scale of the reform, CSR had major implications for the California teacher labor market. The reform created 25,000 new teaching positions in its first two years. Many of these positions were filled by teachers without certification or prior teaching experience. Other positions were filled by experienced teachers who switched grades or schools (or both). Ross (1999) describes the influx of inexperi-enced, noncertified teachers into elementary schools in South Central Los Angeles following class size reduction, prompted in part by the departure of many experi-enced teachers to newly created positions in more affluent communities. Therefore, ceteris peribus estimates of class-size effects provide only partial information on the benefits of CSR because they do not capture accompanying changes in teacher qual-ity following its implementation.
Studying the class-size and teacher-quality effects of CSR is complicated by the way in which the program was implemented. Because California did not adminis-ter statewide examinations until the 1997-98 school year, no baseline measure of achievement prior to CSR is available. In addition, the statewide implementation of CSR makes it more difficult to separate its effects from other changes, includ-ing expanded school accountability, the spread of charter schools, and test score inflation.
This paper provides a comprehensive look at the effects of CSR on mathematics and reading achievement. Whereas previous studies go to great lengths to hold teacher quality constant, we investigate the direct effects of smaller classes and the indirect effects of the accompanying changes in the characteristics of teachers. Our fixed effect framework uses differences in class size and specific teacher char-acteristics by school, grade, and year to identify variable effects on achievement. Because teacher experience and certification may capture only a portion of CSR-induced changes in the teacher quality, we also examine whether the quality of in-struction varies inversely with the size of entering teacher cohorts conditional on certification status.
II. Previous Class Size Research
1Recent research utilizes social experiments and innovative statistical methods to identify the causal effect of smaller classesholding teacher quality con-stant. The most prominent of these is the Tennessee STAR experiment, where stu-dents were randomly assigned to small classes or larger classes. A comparison between achievement in large and in small classes provides an estimate of the ben-efits of smaller classes but provides no information on changes in teacher quality. Krueger (1999) and Krueger and Whitmore (2001) find that smaller class sizes in kindergarten and first grade had a significant and lasting impact on academic achieve-ment and educational attainachieve-ment. However, the substantial student mobility and attri-tion that occurred throughout the experiment and consequent need to add students each year raises questions about the estimates, particularly for the higher grades (Hoxby 2000; Hanushek 1999).
Studies by Angrist and Lavy (1999), Hoxby (2000), and Rivkin, Hanushek, and Kain (2005) identify plausibly exogenous variation in class size in order to learn more about the effects of class size on achievement (in Israel, Connecticut, and Texas, re-spectively). Except for Hoxby (2000), the studies find that smaller classes significantly increase achievement in the early grades (Grade 5 and below), and the effects tend to be larger for lower-income students. Because data problems attenuate the estimates in Hoxby (2000), the overall pattern of results suggests that smaller classes raise achieve-ment, other things held constant.2
One important feature of these studies is that they go to great lengths to hold all other factors, particularly teacher quality, constant. However, an extensive class-size-reduction program such as that undertaken by California inevitably alters the composition and quality of the teaching force. Consequently, controlled experiments such as STAR provide only partial information on the likely effect of broad-based class-size reduction by ignoring its impact on teacher quality. Depending upon the elasticity of supply of teacher quality and teacher preferences along a number of dimensions, the existing estimates may overstate the benefits of smaller classes, par-ticularly for schools that have a difficult time attracting teachers.
The initial Class Size Reduction Research Consortium evaluations of CSR and achievement compare schools that implemented CSR in the initial year with those that did not (Bohrnstedt and Stecher 1999; Stecher and Bohrnstedt 2000).3Although funding was available for all schools, some did not participate in the first year. In order to account for differences between schools that did and did not implement CSR in a timely manner, fourth- or fifth-grade test scores are included in the regres-sions as controls. This technique assumes that all differences across schools can be captured by a single variable (test scores in fourth or fifth grade). The state-funded
1. For a detailed review of class size and student achievement, see Ehrenberg et al. (2001).
Class Size Reduction Research Consortium found little effect of CSR on student achievement.
More recent work on CSR investigates both the benefits of smaller classes and un-intended program consequences that might adversely affect school quality. Unlu (2005) finds positive effects of CSR using several difference-in-differences models with National Assessment of Educational Progress (NAEP) data, though contempo-raneous education policy changes in California and the appropriateness of the control states raises concerns about this analysis. Sims (2003) finds that the incentives of CSR to cap class size at 20 leads to increased usage of multigrade classrooms that adversely affects achievement.
Our analysis extends previous work on CSR in two ways. First, we look at both the direct effects of smaller classes and the effects of any related changes in teacher characteristics. Second, we use class size differences by school, grade, and year in a multilevel-school fixed effect framework to identify the effects of smaller classes in addition to difference-in-differences models similar to those used in earlier analyses of CSR effects. Multiple difference-in-difference specifications in combination with the school-by-grade and school-by-year fixed effects models provide a far richer set of estimates less susceptible to contamination by confounding factors.
III. Empirical Model
In this section we describe the model used in the empirical analysis. Because we do not have access to student level data and are unable to follow stu-dents as they age, we develop the model at the school-grade-year level of aggrega-tion. Nevertheless, we place the discussion in the context of a cumulative model of learning such as that described by Todd and Wolpin (2003) in order to highlight the potential confounding factors and the impediments to identification introduced by the structure of the data.
Equation 1 highlights key issues that must be addressed in the absence of random assignment in order to generate consistent estimates of the causal effects of class size and teacher characteristics on achievement. Here average achievementAfor students in gradeGand school s in yearyis modeled as a function of average student, family, and teacher characteristics and average class size:
AGsy¼aGsy+bXGsy+dCSGsy+lTGsy+eGsy
ð1Þ
whereCSis average class size,Tis a vector of teacher characteristics including the shares of teaching lacking full certification and experience,Xis a vector of family back-ground variables,ais average student skill, where student skill evolves over time as a function of prior family and school influences, andeis a stochastic term that captures unmeasured influences of communities and schools as well as random error. IfCSandT
Our basic approach is to use the panel of schools to control for observed and unobserved student, family, school, and community factors that could potentially bias the estimated class-size and teacher-characteristic effects, leaving only exogenous variation to identify the parameter estimates. We begin by expanding the error termefrom Equation 1 into a series of components that highlight both the types of school and neighborhood factors accounted for directly by the fixed effects and those factors that remain unaccounted for:
eGsy¼us+jG+cy+psG+usy+rGy+tsGy+eGsy
ð2Þ
where the first three terms are fixed school, grade, and year effects, the next three terms are second-level interactions among these three components, the seventh term is the third-level interaction, and the final term is a random error.
The school fixed effect captures time invariant differences in neighborhoods and schools. These include school facilities, public services, community type, and work-ing conditions that influence teacher supply.
Because school quality may vary over time and by grade, Equation 2 also includes interactions between school and both grade and year. The school-by-grade compo-nent captures systematic changes across grades in a school common to all years, and the school-by-year term accounts for year-to-year changes common to all grades in a school. Rather than relying on a linear or even polynomial trend for each school, these school-by-year fixed effects remove in a very general way all variation over time in neighborhood and local economic conditions that likely affect mobility pat-terns including such things as the introduction of new school policies or the myriad changes documented to occur in ‘‘transitional neighborhoods.’’ An economic shock that reduces neighborhood employment and income would not bias the estimates, nor would a shock to local school finances or the quality of the local school board, be-cause each of these would affect all grades in a school. The school-by-grade fixed effect also accounts for the possibility that achievement trends vary systematically with changes in class size or teacher quality as children age.
It is also important to account for statewide factors that might be correlated with overall changes in achievement. The grade, year, and year-by-grade fixed effects ac-count for statewide trends by grade and year and other factors including test difficulty. The seventh term,t, is the full three-way interaction between school, grade, and year. Despite the fact that the school-by-year fixed effects capture changes in administration, neighborhood social and economic environment, school resources, and myriad other achievement determinants, it is almost certainly the case that most schools experience grade-specific variation in teacher quality, peer influences, and perhaps other factors from year to year. Grade-specific changes in curriculum also remain unaccounted for by either the school-by-grade or school-by-year fixed effects.
Importantly, this term cannot be included in the regressions, because doing so would eliminate all variation in class size and the other variables; the data are aggregated to the school-grade-year level, and there is no within grade variation. Thereforetpotentially includes confounding factors that cannot be directly accounted for, and a key question is whether any such factors contaminate the estimates of class-size or teacher-characteristic effects.4
The following example for a single school illustrates the variation used to iden-tify the parameter estimates. If we had multiple years of data for a single grade, we could use cohort differences in achievement and class size for that grade to identify the class-size effect. Alternatively, if we had multiple grades of data for a single year, we could use grade differences in achievement and class size in that year to identify the class-size effect. In a more general case with multiple schools, the co-efficients would reflect the average of these within school relationships across the sample.
Each of these estimators is subject to potentially serious biases. In the model that focuses on variation across years within school and grade, unobserved time-varying factors related to class size could contaminate the estimates. In the specification that uses variation across grades within school and year, systematic differences by cohort or by age could introduce bias.
Fortunately, the availability of multiple years and grades of data permits the simul-taneous inclusion of school-by-grade and school-by-year fixed effects. In this case, the class-size effect is identified by deviations from a school’s average class size for each grade and year. Consider a data set with class size and achievement data for grades g and g-1 and years y and y-1. The inclusion of school-by-grade and school-by-year fixed effects is equivalent to the following regression:
ðAsgy2Asg21yÞ2ðAsgy212Asg21y21Þ ¼d½ðCSsgy2CSsg21yÞ
2ðCSsgy212CSsg21y21Þ+ error ð3Þ
Although the school-by-grade and school-by-year fixed effects eliminate primary sources of bias, there remains the possibility that unobserved differences by grade and year including test difficulty and grade-specific policy changes at the state level could contaminate the estimates. Fortunately, the availability of data for a number of schools enables us to control for average grade-by-year effects across all schools with grade, year, and grade by year fixed effects.
The variation in class size and teacher characteristics that remains following the inclusion of the fixed effects and observed characteristics comes from purposeful, grade-specific changes in school policy including implementation of CSR, variation in the size of entering cohorts at a school, the inflow and outflow of students in a given grade and year, and teacher experience gains over time, turnover, and reallo-cation among grades. Not surprisingly the variance in second- and third-grade class size is much larger for schools that begin our sample period with large classes and either adopt CSR during the period or not at all, though the vast majority of schools have small classes throughout the period (see Appendix Table A1).
hand, adoption of CSR appears to have influenced teacher grade preferences, ampli-fying the importance of accounting for teacher experience.
Of course the possibility that teacher assignments are based in part on cohort qual-ity cannot be ruled out, and the inabilqual-ity to link students across grades and years prevents us from accounting for mobility or controlling for student heterogeneity through the use of a value-added framework or student fixed effects.5We can, how-ever, examine the sensitivity of the estimates to student demographic variables that are almost certainly related to academic preparation including the proportion eligi-ble for a subsidized lunch. Moreover, student level panel data in Texas suggests that class size estimates are not sensitive to the inclusion of mobility controls.6
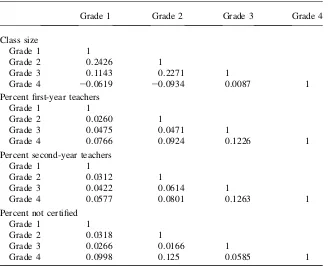
One final concern is the possible persistence of cohort differences in class size and teacher characteristics across grades, causing the coefficients to conflate contempo-raneous and past class-size and teacher-characteristic effects.7For example, cohorts with smaller second-grade classes may have tended to have smaller first-grade and kindergarten classes, meaning that the second-grade class size coefficient may com-bine the effects of class size in second grade and class sizes in earlier grades. The magnitude of this effect depends negatively on the rate at which the additional knowledge produced by smaller classes depreciates over time and positively on the correlation between current and prior class size and teacher characteristics. Note that in cases with either no knowledge persistence or no correlation between current and prior class size, class sizes in earlier grades do not affect estimates of contem-poraneous class-size effects.
Although it is not possible to estimate the rate of knowledge depreciation for the specific sample and test instrument used in this analysis because of the lack of stu-dent level information, estimates of the correlations between current and prior year class size can be generated. Appendix Table A2 reports the within-cohort correla-tions over grade of residual class size and teacher characteristics based on the vari-ation that remains following the removal of all fixed effects. In the case of teacher experience, the fact that most correlations for the experience variables fall below 0.10 indicates that any confounding effects of teacher experience in the prior year are likely to be small even if there were little or no depreciation of knowledge over time. In the case of class size, some of the correlations approach 0.25 which although still low suggest that effects of class size in prior years might introduce a small up-ward bias on some class size estimates.
IV. Data Sources
The data come from the California Department of Education (CDE) and include all public elementary schools serving second through fourth grades in California with the exception of charter schools and alternative schools (such as spe-cial education schools). Student-level data are not released by the CDE, but aggre-gate information on student background and test performance can be combined
5. Hanushek, Rivkin, and Kain (2004) find that mobility reduces test scores of movers and schoolmates. 6. These results are available from the authors upon request.
with information on average class size and teacher characteristics including experi-ence, certification, and education.
We use data from seven years: 1990–91, 1995–96, and 1997–98 through 2001– 2002 (for ease of discussion we subsequently refer to an academic year by the cal-endar year in which it begins). This lengthy panel, which includes pre- and post-CSR years, allows us to look at the relationship between CSR and trends in teacher char-acteristics, as illustrated in the next section.
For 1997 through 2001, each California public school student in second through eleventh grade took the Stanford Achievement Test Series, Ninth Edition, Form T (Stanford 9) multiple-choice test, published by Harcourt, Brace & Co.8Our measure of achievement in each grade is the school average mathematics or reading test score, standardized to a mean of zero and a standard deviation of one.
The information on teacher experience and certification is used to construct mar-ginal and joint distributions of these variables. Because evidence shows that the return to experience is concentrated in the first few years, we calculate the shares of teachers with zero, one, and two plus years of prior experience rather than simply using the average. We also interact certification status with experience to examine whether quality differences by certification status vary with experience.
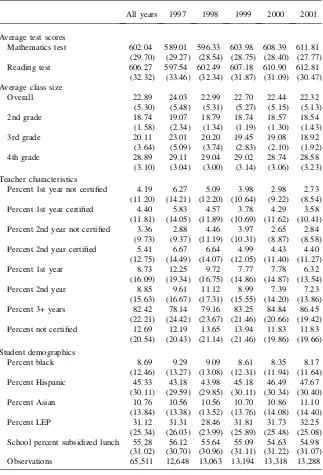
Table 1 reports descriptive statistics by year for the regression sample period (1997 to 2001). The sample includes Grades 2–4 for all school years from 1997 to 2001. An observation is a combination of grade, school, and year, such as third grade in Wash-ington Elementary school for 1999. There are 65,511 observations.
V. California Public Elementary School Teachers:
1990–2001
The magnitude and distribution of any changes in teacher character-istics following the CSR-driven increase in demand clearly depend on many factors. The most prominent are the details of class-size reduction, accompanying changes in salary, and the elasticity of teacher supply for different types of schools. In terms of the first, Jepsen and Rivkin (2002) show that CSR reduced third-grade class size from roughly 30 to 20 for all types of schools. As a result, the number of CSR-induced openings at a given school depended only on the size of the school, not on the char-acteristics of its student body.9With respect to teacher salaries, the average earnings of young, nonteacher female college graduates in California matched if not exceeded the rise in starting teacher salaries during the 1990s.10
Finally, measures of supply conditions for different types of schools are not readily available, although Ballou and Podgursky (1997) and others argue that excess supply characterizes most teacher labor markets, especially those in middle-class communi-ties. Schools in such communities can meet increased demand by drawing from new
8. California switched from the Stanford 9 to the California Achievement Test in 2002.
9. Schools were able to keep class sizes around 20 through the use of combination classes, as illustrated in Sims (2003).
Table 1
Descriptive Statistics
All years 1997 1998 1999 2000 2001
Average test scores
Mathematics test 602.04 589.01 596.33 603.98 608.39 611.81 (29.70) (29.27) (28.54) (28.75) (28.40) (27.77) Reading test 606.27 597.54 602.49 607.18 610.90 612.81
(32.32) (33.46) (32.34) (31.87) (31.09) (30.47) Average class size
Overall 22.89 24.03 22.99 22.70 22.44 22.32
(5.30) (5.48) (5.31) (5.27) (5.15) (5.13)
2nd grade 18.74 19.07 18.79 18.74 18.57 18.54
(1.58) (2.34) (1.34) (1.19) (1.30) (1.43)
3rd grade 20.11 23.01 20.20 19.45 19.08 18.92
(3.64) (5.09) (3.74) (2.83) (2.10) (1.92)
4th grade 28.89 29.11 29.04 29.02 28.74 28.58
(3.10) (3.04) (3.00) (3.14) (3.06) (3.23)
Teacher characteristics
Percent 1st year not certified 4.19 6.27 5.09 3.98 2.98 2.73 (11.20) (14.21) (12.20) (10.64) (9.22) (8.54) Percent 1st year certified 4.40 5.83 4.57 3.78 4.29 3.58
(11.81) (14.05) (11.89) (10.69) (11.62) (10.41) Percent 2nd year not certified 3.36 2.88 4.46 3.97 2.65 2.84
(9.73) (9.37) (11.19) (10.31) (8.87) (8.58) Percent 2nd year certified 5.41 6.67 6.64 4.99 4.43 4.40
(12.75) (14.49) (14.07) (12.05) (11.40) (11.27)
Percent 1st year 8.73 12.25 9.72 7.77 7.78 6.32
(16.09) (19.34) (16.75) (14.86) (14.87) (13.54)
Percent 2nd year 8.85 9.61 11.12 8.99 7.39 7.23
(15.63) (16.67) (17.31) (15.55) (14.20) (13.86)
Percent 3+ years 82.42 78.14 79.16 83.25 84.84 86.45
(22.21) (24.42) (23.67) (21.46) (20.66) (19.42) Percent not certified 12.69 12.19 13.65 13.94 11.83 11.83
(20.54) (20.43) (21.14) (21.46) (19.86) (19.66)
Student demographics
Percent black 8.69 9.29 9.09 8.61 8.35 8.17
(12.46) (13.27) (13.08) (12.31) (11.94) (11.64)
Percent Hispanic 45.33 43.18 43.98 45.18 46.49 47.67
(30.11) (29.59) (29.85) (30.11) (30.34) (30.40)
Percent Asian 10.76 10.56 10.56 10.70 10.86 11.10
(13.84) (13.38) (13.52) (13.76) (14.08) (14.40)
Percent LEP 31.12 31.31 28.46 31.81 31.73 32.25
(25.34) (26.03) (23.99) (25.89) (25.48) (25.08) School percent subsidized lunch 55.28 56.12 55.64 55.09 54.63 54.98
(31.02) (30.70) (30.96) (31.11) (31.22) (31.07) Observations 65,511 12,648 13,063 13,194 13,318 13,288
teachers, those currently out of teaching, and teachers working in less preferred dis-tricts. On the other hand, schools serving academically and economically at-risk stu-dents likely confront a lower supply of certified teachers at market wages. Boyd et al. (2003) find that the combination of distance to desirable housing and characteristics as-sociated with a high-poverty, high-proportion black or Hispanic student body severely inhibits the ability of administrators to attract and retain fully-certified teachers.
Thus, the expanded number of teaching positions at all schools following the im-plementation of CSR both redistributed existing teachers among schools and brought a number of new teachers into the schools. The implications for school average in-structional quality depended upon both the effectiveness of movers and new, often uncertified, teachers in comparison to their new colleagues and those they replaced. On the one hand, it is difficult to speculate on the changes in quality experienced by schools serving high SES students who often filled vacancies with experienced teachers. There is little evidence on the extent to which schools use more desirable working conditions to procure more effective teachers as measured by value added to student achievement, and the structure of the tenure system in California including the granting of tenure after only a few years and difficulty firing poor performers sug-gests that there is likely to be substantial quality variation within most schools. On the other hand, evidence suggests that teachers with little or no prior experience and to a lesser extent those lacking full certification tend to be less effective in the class-room. Consequently those schools that lost many teachers and had to fill vacancies predominantly by hiring new teachers may have experienced a substantial decline in the quality of instruction.
A. Changes in the Distribution of Teacher Experience and Certification
This section describes changes over time in teacher experience and certification by student demographic characteristics. The figures for experience and certification are constructed in the following way. Schools are divided into four categories accord-ing to the percentage of students eligible for a subsidized lunch.11Then, the average of the teacher characteristic, such as the school’s percentage of new teachers, is cal-culated from all the schools in that subsidized lunch category. Low-poverty schools are defined as schools with fewer than 25 percent of their students eligible for a sub-sidized lunch, whereas high-poverty schools are defined as schools with greater than 75 percent eligible for a subsidized lunch. The calculations weight each school by the number of students in the specific racial/ethnic group (such as Asians), thereby cre-ating averages for students in each of the four racial/ethnic groups.12Differences among racial/ethnic groups within each subsidized lunch category provide informa-tion regarding the degree to which the distribuinforma-tions of teacher characteristics differ by race/ethnicity conditional on income.13
11. The measure of poverty is actually the percent of students in the school who are eligible for free or reduced-price lunch. For simplicity, we refer to this percentage as the percent subsidized lunch. 12. The calculations assume that there is no systematic variation within schools by race or ethnicity in the probability of having inexperienced or uncertified teachers.
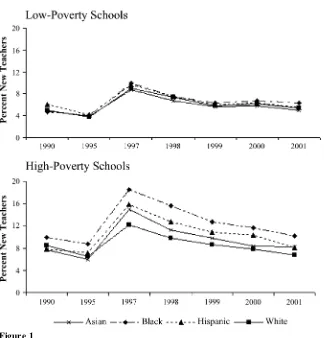
Figure 1 shows trends in the percentages of new teachers – teachers in their first year of teaching in any California public school in Grades 2–4 (the grades we use to analyze the effect of CSR on student achievement later in the paper) for the lowest and highest poverty categories.14The basic time patterns are generally similar for all demographic groups: a small decline in the share of new teachers prior to CSR, a large increase in the share of new teachers following the implementation of CSR and a return to a similar share of new teachers by the end of the time period. There are, however, race/ethnic differences among students in high poverty schools. Specif-ically, the CSR-induced increase in the share of students with new teachers is much smaller for whites than for the other demographic groups.
Figure 1
Percent New Teachers 1990-2001, by Student Demographics
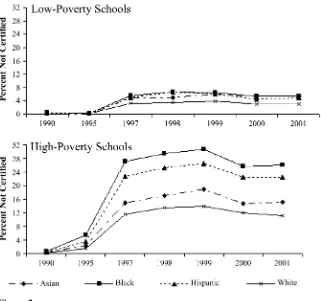
Figure 2 illustrates the dramatic increase over time in the share of teachers who lack full certification.15In contrast to the percentage of teachers with no experience, the percentage without full certification does remain far higher than pre-CSR values in 2001. In high-poverty schools, more than one-quarter of blacks, one-fifth of His-panics, and 10 percent of whites and Asians have teachers who lack full certification more than five years following the implementation of CSR.
The persistence of the increases in the share of teachers lacking full certification despite the decline in the share with no experience indicates that teachers lacking full certification are remaining in the schools for more than one year. Whether this reflects a longer-term decline in teacher quality depends upon the inter-relationship among experience, certification, and quality.
Figure 2
Percent Not Certified 1990-2001, by Student Demographics
An important limitation of these tables and figures as descriptors of the changes in teacher quality experienced by California schools is the fact that experience, certifica-tion, and other easily quantified measures of quality appear to explain little of the actual quality variation in terms of value added to achievement (Rivkin, Hanushek, and Kain 2005). Of particular relevance to the question of a CSR-induced quality change is the extent to which the need to hire so many teachers in a short period of time led to a de-cline in the quality of entire cohorts that would persist throughout their careers given the infrequency of tenure denial and shortages of certified teachers in many schools. We attempt to provide some evidence on this issue by investigating the relationship be-tween entering teacher cohort size and quality in the empirical analysis.
VI. Class Size, Teacher Characteristics, and Student
Achievement
This section reports the results from the analysis of average mathemat-ics and reading achievement. We begin with difference-in-differences models to facil-itate comparisons with previous evaluations of CSR. Next we present a series of fixed effect estimates that differ according to the parameterization of the teacher character-istics and the types of interactions with demographic variables. The final set of results investigates the link between achievement and the size of entering teacher cohorts. All specifications fully interact grade with class size but not the teacher characteristics based on prior research and preliminary work.16Unless otherwise indicated, all regres-sion specifications include separate coefficients by grade for the percentages of black, Hispanic, Asian, and LEP students, as well as full sets of grade-by-year dummies (per-cent subsidized lunch is only available at the school level). Robust standard errors are clustered at the school level to account for correlations among the errors.
A. Difference-in-Differences Results
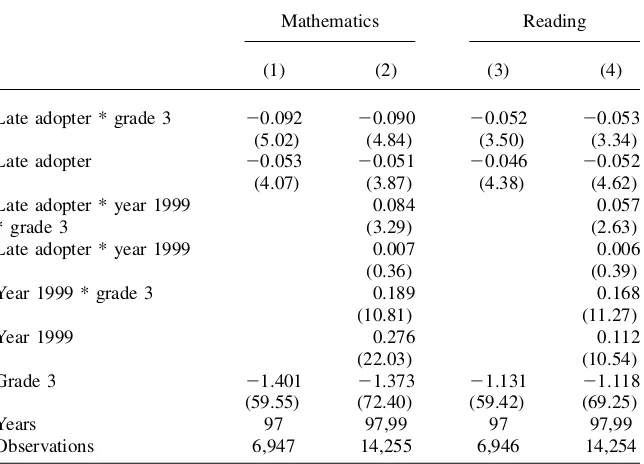
Table 2 reports estimates of the effects of CSR on mathematics and reading achievement that are identified by differences in the timing of CSR adoption. The difference in dif-ferences specification reported in Columns 1 and 3 compares the difference in third-and fifth-grade achievement in 1997 for schools that had implemented CSR as of 1997 (early adopters) and those that reduced class size in 1998 or 1999 (late adopters), so the estimated benefit of CSR is the negative of the third-grade*late-adopter interaction coef-ficient. This model assumes that the difference between third- and fifth-grade achievement in late-adopting schools provides a valid counterfactual for the early adopters.
The difference in difference in differences (DDD) specification reported in Columns 2 and 4 compares the difference in the difference in third- and fifth-grade achievement between 1997 and 1999 for early and late adopters, so the estimated benefit of CSR is the third-grade * late-adopter * 1999 interaction coefficient. This model assumes that the 1997-99 difference in the difference between third- and fifth-grade achievement in early-adopting schools provides a valid counterfactual for the late adopters.
The results are quite similar for the two models, showing that the implementation of CSR increased achievement by roughly 0.09 standard deviations in mathematics and 0.05 standard deviations in reading in both early- and late-adopting schools. The finding that different models yield similar estimates provides support for the notion that CSR raised achievement, but there is reason to be cautious about the interpreta-tion since both specificainterpreta-tions depend on the assumpinterpreta-tion that CSR adopinterpreta-tion did not affect fifth-grade achievement. If movement of teachers out of fifth grade to one of the CSR grades increased the share of fifth-grade teachers without experience or full certification, neither of the estimates would capture the effect of CSR on third-grade achievement. Rather, they would capture the effects of CSR on the difference between third- and fifth-grade achievement, likely overestimating the benefit of smaller classes in third grade.
B. Fixed Effect Results
We now turn to results from our preferred fixed effects model that does not rely on the strong assumptions underlying the difference in differences approaches. Table 3 reports the estimated effects of class size and teacher characteristics on mathematics and reading achievement for five specifications based on Equations 1 and 2 that differ Table 2
Overall Effect of CSR on Student Achievement in Third and Fifth Grades
Mathematics Reading
(1) (2) (3) (4)
Late adopter * grade 3 20.092 20.090 20.052 20.053
(5.02) (4.84) (3.50) (3.34)
Late adopter 20.053 20.051 20.046 20.052
(4.07) (3.87) (4.38) (4.62)
Late adopter * year 1999 0.084 0.057
* grade 3 (3.29) (2.63)
Late adopter * year 1999 0.007 0.006
(0.36) (0.39)
Year 1999 * grade 3 0.189 0.168
(10.81) (11.27)
Year 1999 0.276 0.112
(22.03) (10.54)
Grade 3 21.401 21.373 21.131 21.118
(59.55) (72.40) (59.42) (69.25)
Years 97 97,99 97 97,99
Observations 6,947 14,255 6,946 14,254
Mathematics Reading
(1) (2) (3) (4) (5) (6) (7) (8) (9) (10)
Class size
Grade 2 20.0076 20.0085 20.0065 20.0072 20.0066 20.0074 20.0081 20.0061 20.0063 20.0056
(4.66) (5.02) (3.85) (4.11) (3.72) (6.26) (6.18) (4.83) (4.76) (4.17) Grade 3 20.0127 20.0131 20.0107 20.0096 20.0095 20.0055 20.0050 20.0050 20.0037 20.0035
(18.36) (15.84) (15.00) (11.45) (11.26) (11.31) (8.59) (10.14) (5.93) (5.63) Grade 4 20.0065 20.0040 20.0078 20.0056 20.0054 20.0040 20.0023 20.0051 20.0035 20.0033
(9.02) (5.64) (9.24) (6.54) (6.24) (7.36) (4.02) (8.16) (5.00) (4.60)
Teacher characteristics (percentages)
First year 20.0012 20.0012 20.0011 20.0010 20.0010 20.0009 20.0009 20.0008 20.0007 20.0007
(14.26) (13.37) (11.36) (9.78) (9.80) (15.14) (13.71) (10.54) (8.50) (8.48) Second year 20.0005 20.0003 20.0004 20.0002 20.0002 20.0005 20.0004 20.0005 20.0003 20.0003
(5.74) (3.99) (4.77) (1.86) (1.83) (7.63) (6.07) (6.62) (3.73) (3.47) Not certified 20.0003 20.0003 20.0003 20.0003 20.0003 20.0003 20.0003 20.0002 20.0002 20.0002
(2.77) (2.69) (2.80) (2.71) (2.72) (3.63) (3.89) (2.61) (2.65) (2.77) Observations 65,511 65,511 65,511 65,511 65,511 65,511 65,511 65,511 65,511 65,511
School fixed effects yes no no no no yes no no no no
School-by-grade fixed effects no yes no yes yes no yes no yes yes
School-by-year fixed effects no no yes yes yes no no yes yes yes
Student characteristics yes yes yes yes no yes yes yes yes no
Notes: Absolute values oft-statistics are in parentheses. The dependent variable is the average test score in that subject. Student characteristics include percent black, percent Hispanic, percent Asian, percent LEP, and (Columns 1, 2, 6, and 7) school percent subsidized lunch. All columns include cohort-by-year fixed effects. Regressions are weighted by average school enrollment for 1997-2001. Each column represents a separate regression.
Jepsen
and
Ri
vkin
according to the included covariates and fixed effects. Columns 1 and 6 include school fixed effects; Columns 2 and 7 include school-by-grade fixed effects; Columns 3 and 8 contain school-by-year fixed effects; and Columns 4, 5, 9, and 10 include both school-by-grade and school-by-year fixed effects. All specifications except for Columns 5 and 10 include a full set of student demographic variables.
The estimated effects of class size on mathematics and reading achievement are negative and highly significant across the board, although effect magnitudes vary slightly by specification. Consistent with prior work, the class-size effect appears to be somewhat larger for mathematics than for reading. Neither of the subjects exhibits a monotonic pattern by grade.
In our preferred full fixed effect specification (Columns 4 and 9), a ten-student re-duction in class size is associated with higher scores of 0.056 to 0.096 standard devi-ations in mathematics and 0.035 to 0.063 standard devidevi-ations in reading. Despite the fact that these estimates come from specifications that hold teacher characteristics constant, the magnitude of the third-grade class size coefficient is only slightly larger in mathematics and smaller in reading than the overall CSR effects (the combined effects of smaller classes and changes in teacher characteristics) reported in the difference-in-difference models in Table 2. This is consistent with the belief that CSR-induced teacher movements from non-CSR to CSR grades reduced fifth-grade achievement which inflated the DD and DDD estimates of the benefits of CSR.
Differences in test instruments, aggregation level of data, grades covered, and other factors cloud comparisons of the magnitude of class-size effects with those found in other studies. In general, our estimates are somewhat smaller than those found for Israel, Ten-nessee, and Texas even though our estimates are measured at a more aggregate level (grade) than most previous work (classroom or student).17 The estimates in Angrist and Lavy (1999) suggest that a ten-student reduction in class size would increase achieve-ment by at least 0.17 standard deviations in fifth grade in Israel, while the estimates in Krueger (1999) indicate that the approximately seven fewer students in the smaller clas-ses raised test scores by 0.20 standard deviations in kindergarten in Tennessee (estimates for higher grades capture cumulative effects). Finally, the estimates reported in Rivkin, Hanushek, and Kain (2005) suggest that a ten-student reduction in class size would raise fourth-grade mathematics and reading achievement in Texas by roughly 0.1 standard deviations. One possibility is that difficulties expanding the number of classrooms damp-ened the benefits of CSR, while another is that an increase of the share of students in mul-tigrade classrooms offset some of the benefits of CSR (Sims 2003).
Table 3 also reveals significant effects of teacher experience and certification on achievement. Based on effect magnitudes for the full fixed effect model (Columns 4 and 9), the penalty in terms of mathematics achievement for having a first-year teacher is slightly larger than the benefit from a ten-student reduction in class size in third grade and over 60 percent larger than the benefit in second and fourth grade, whereas the cost of a having a second-year teacher is roughly one-fifth as large.18In reading, the disad-vantage from having a first-year teacher slightly exceeds the benefit from a ten-student
reduction in the second grade and is roughly twice as high in Grades 3 and 4. The costs of a second-year teacher are less than half as large. Although significant, differences by certification status are smaller: The average performance deficit for teachers without full certification is roughly one-third of that of first-year teachers in reading and around 40 percent of that of first-year teachers in mathematics.
A crucial question is whether these estimates actually capture causal effects, a ques-tion for which there is no direct test. However, telling evidence can be brought to bear, and in this case the evidence strongly supports the validity of the empirical approach. First, comparisons of the last two columns for each outcome reveal that that the co-efficients remain virtually unchanged following the exclusion of a set of student demo-graphic variables that are strongly related to achievement (Appendix Table A3 reports the coefficients for these demographic characteristics). Second, evidence from Texas microdata (not reported) shows that the class-size and teacher-characteristic estimates are not sensitive at all to the inclusion of controls for student school switches and av-erage turnover, despite the significant effects of these variables on achievement.19This is important because student turnover provides one source of cohort variation in class size. Of course, there may be other confounding factors, but they would have to vary systematically by school, grade, and year and be weakly correlated with, if not orthog-onal to, both student turnover and a set of highly significant demographic variables.
C. A Closer Look at Certification Effects
The extent to which the certification differential results from inferior preservice train-ing, less experience, or a weaker academic background influences the long-run impact of hiring a substantial number of teachers lacking full certification. Although class-room experience and additional coursework can dissipate the adverse effects of inex-perience and limited preservice training, a weaker academic background and skill level is not so easily remedied.
Longitudinal data on teachers would permit the decomposition of the gap into fixed differences between certified and not fully certified teachers and differences that dimin-ish with experience. Unfortunately, such data are not available for this study. Instead, we use the repeated cross-sections to investigate whether the certification differential declines with experience. A key deficiency of this approach is that higher returns to ex-perience for teachers lacking full certification, higher attrition among lower-quality teachers lacking full certification, the acquisition of full certification for some teachers initially lacking full certification, and combinations of the above would all produce a certification differential that diminishes with experience.20Nonetheless, the new teacher certification gap and changes in the gap with experience do provide some evi-dence on the dynamics of the certification differential.
Table 4 reports the estimated effects of having a new and a second-year teacher with full certification and a new and a second-year teacher without full certification. The estimates show that the gap between certified and not fully certified teachers declines between the first and second years, despite the fact that many teachers
19. These results are available from the authors upon request.
Table 4
Effects of Class Size and Teacher Characteristics on Student Achievement from Alternate Specification of Teacher Characteristics: Interaction between Teacher Experience and Certification
Mathematics Reading
(1) (2) (3) (4) (5) (6) (7) (8) (9) (10)
Class size
Grade 2 20.0076 20.0084 20.0065 20.0072 20.0066 20.0073 20.0079 20.0062 20.0063 20.0056
(4.62) (4.96) (3.87) (4.11) (3.72) (6.18) (6.07) (4.85) (4.77) (4.17) Grade 3 20.0127 20.0130 20.0108 20.0096 20.0095 20.0055 20.0049 20.0050 20.0037 20.0035
(18.34) (15.77) (15.03) (11.43) (11.25) (11.27) (8.47) (10.17) (5.93) (5.63) Grade 4 20.0065 20.0040 20.0078 20.0056 20.0054 20.0040 20.0023 20.0051 20.0035 20.0033
(9.02) (5.64) (9.23) (6.55) (6.25) (7.37) (4.01) (8.15) (5.00) (4.60) Teacher characteristics
(percentages)
1st year not certified 20.0015 20.0015 20.0013 20.0013 20.0013 20.0013 20.0013 20.0009 20.0008 20.0008
(12.94) (12.54) (10.07) (9.32) (9.26) (15.14) (14.45) (8.78) (7.59) (7.48) 1st year certified 20.0011 20.0010 20.0010 20.0009 20.0009 20.0008 20.0007 20.0008 20.0006 20.0007
(10.82) (9.69) (9.14) (7.47) (7.62) (10.56) (8.98) (8.89) (6.96) (7.09) 2nd year not certified 20.0007 20.0006 20.0006 20.0003 20.0003 20.0008 20.0008 20.0006 20.0004 20.0004
(5.72) (4.38) (4.16) (1.82) (1.78) (8.57) (7.99) (5.31) (3.53) (3.43) 2nd year certified 20.0004 20.0003 20.0005 20.0002 20.0002 20.0004 20.0003 20.0005 20.0003 20.0003
(4.47) (2.89) (4.48) (2.03) (1.96) (5.50) (3.83) (5.85) (3.24) (2.98) Observations 65,511 65,511 65,511 65,511 65,511 65,511 65,511 65,511 65,511 65,511
School fixed effects yes no no no no yes no no no no
School-by-grade fixed effects no yes no yes yes no yes no yes yes
School-by-year fixed effects no no yes yes yes no no yes yes yes
Student characteristics yes yes yes yes no yes yes yes yes no
Notes: Absolute values oft-statistics are in parentheses. The dependent variable is the average test score in that subject. Student characteristics include percent black, percent Hispanic, percent Asian, percent LEP, and (Columns 1, 2, 6, and 7) school percent subsidized lunch. All columns include cohort-by-year fixed effects. Regressions are weighted by average school enrollment for 1997-2001. Each column represents a separate regression.
The
Journal
of
Human
become certified between their first and second years (authors’ calculations based on CDE data).21The finding of a larger certification gap in the first year is consistent with the notion that teachers lacking certification are less well prepared, but it is also consistent with the belief that those lacking full certification initially have inferior backgrounds and skills that are not fixed easily by experience and that differences in the rate of attrition out of teaching and in the probability of becoming certified cause the gap to decline with experience. Additional information is needed to differ-entiate among these various explanations.
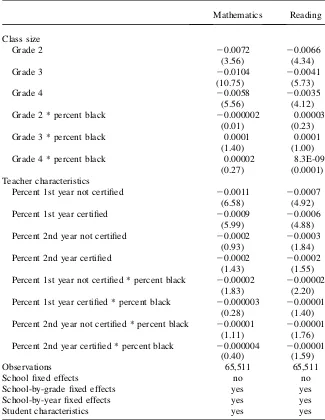
D. Differential Effects by Student Demographic Characteristics
Krueger (1999) notes that a number of studies, including the Tennessee STAR exper-iment, find that class-size and teacher-experience effects are larger for nonwhite and low-income students, and we investigate this possibility by interacting class size and the teacher characteristics with the black enrollment share.22Models with interactions between percent Asian or percent Hispanic and class size and teacher characteristics yielded generally insignificant interaction effects, and the results are not reported.
Table 5 presents coefficients for full fixed effect specifications that separate first-and second-year teachers by certification level first-and add interaction terms between percent black and both class size and teacher characteristics. In contrast to other work, we find little systematic evidence of black-white differences in class-size effects and only small differences in teacher-characteristic effects. All coefficients on the class size interaction terms are insignificant, while the coefficient on the in-teraction between percent black and percent first-year uncertified teachers is negative and significant (at the 10 percent level) for both mathematics and reading.
E. Cohort Size and Teacher Quality
As noted earlier there is strong evidence that observed characteristics including experi-ence and certification explain little of the variation in teacher effectiveness. Consequently these measures may fail to capture fully the quality decline that accompanied the im-plementation of CSR. Given the evidence that salaries fell relative to the earnings of young female college graduates, if the supply of teacher quality is not perfectly elastic one would expect the sharp increase in the number of newly hired teachers to have reduced the average quality of new hires relative to previous cohorts. A certification indicator will not capture this change as long as there is quality variation among non-certified teachers or schools do not always prefer a fully non-certified applicant to an ap-plicant lacking full certification. Moreover, this quality gap might not be eliminated over time given the apparently low tenure threshold.
This section uses differences in the size of entering teacher cohorts to estimate the elasticity of the quality of instruction with respect to the number of teachers hired. In
21. In most specifications, we can reject the hypothesis that the first-year certified and uncertified coeffi-cients are equal, whereas we can never reject the hypothesis that the second-year certified and uncertified coefficients are equal.
Table 5
Effects of Class Size and Teacher Characteristics on Student Achievement from Alternate Specification Containing Interactions between Teacher Experience and Certification, Allowing These Effects to Vary by Black Enrollment Share
Mathematics Reading
Class size
Grade 2 20.0072 20.0066
(3.56) (4.34)
Grade 3 20.0104 20.0041
(10.75) (5.73)
Grade 4 20.0058 20.0035
(5.56) (4.12)
Grade 2 * percent black 20.000002 0.00003
(0.01) (0.23)
Grade 3 * percent black 0.0001 0.0001
(1.40) (1.00)
Grade 4 * percent black 0.00002 8.3E-09
(0.27) (0.0001)
Teacher characteristics
Percent 1st year not certified 20.0011 20.0007
(6.58) (4.92)
Percent 1st year certified 20.0009 20.0006
(5.99) (4.88)
Percent 2nd year not certified 20.0002 20.0003
(0.93) (1.84)
Percent 2nd year certified 20.0002 20.0002
(1.43) (1.55)
Percent 1st year not certified * percent black 20.00002 20.00002
(1.83) (2.20)
Percent 1st year certified * percent black 20.000003 20.00001
(0.28) (1.40)
Percent 2nd year not certified * percent black 20.00001 20.00001
(1.11) (1.76)
Percent 2nd year certified * percent black 20.000004 20.00001
(0.40) (1.59)
Observations 65,511 65,511
School fixed effects no no
School-by-grade fixed effects yes yes
School-by-year fixed effects yes yes
Student characteristics yes yes
most labor market analyses, it is quite difficult to separate changes in cohort quality from changes in labor supply, because both lead to changes in average wages. How-ever, in this case we can use achievement data to estimate changes in cohort quality directly. Specifically, we test whether the effects of teacher experience and certifica-tion on achievement varied across years, as schools often filled their CSR-induced teaching positions with inexperienced and uncertified teachers. Although the largest CSR-induced changes in the work force predate this analysis, we can use any ob-served link between cohort size and the quality of new entrants to estimate the effects of the earlier expansion.
Table 6 reports coefficients from full fixed effect specifications that fully interact the proportions of certified and uncertified teachers with zero years of prior experi-ence with year dummies. Although experiexperi-ence interactions with entering cohort size (reported in the table) rather than the year dummies would produce a more parsimo-nious specification, the imposition of a linear relationship is a strong assumption that is not imposed in this model.
The results reveal little systematic relationship between cohort size and teacher quality (as measured by effect on student achievement). If anything, both the math-ematics and reading estimates suggest that the quality of not fully certified first-year teachers is worse in 2001 (the smallest teacher cohort) than in 1997 (the largest). And there is no systematic pattern whatsoever for new teachers with full certification. In either case, we cannot reject the hypothesis of no difference in experience effects for either fully certified or not fully certified teachers at conventional levels, an identical result to the simple interaction with entering cohort size (not reported).23
One potential problem with the analysis presented in Table 6 is that schools exert some discretion in hiring regarding certification. Consequently we also estimate models that group both certified and noncertified teachers together and ignore differ-ences in certification. The results from these models (not reported) also show no strong relationship between cohort size and teacher quality, especially for first-year teachers. As in Table 6, we cannot reject the hypotheses that the interaction terms for first-year teachers are jointly zero or that the interaction terms for second-year teach-ers are jointly zero.
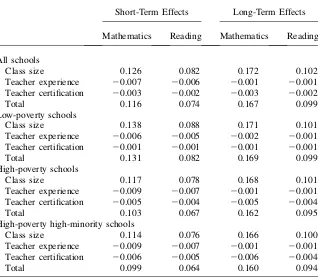
F. Simulated Class-Size and Teacher-Characteristics Effects
The findings in Tables 2 through 6 indicate that some of the benefits of CSR were offset by increases in the shares of inexperienced or not-fully-certified teachers. Because of systematic variation by demographic group in the magnitudes of such increases, the benefits of CSR were not distributed evenly throughout the state. In this section we simulate the short- and longer-term benefits of CSR for various demographic groups by combining the estimated coefficients from the mathematics and reading full fixed effect specifications reported in Table 3 with the actual changes in class size, teacher experience, and teacher certification observed in California over the time period of the study.
Table 7 presents the results of this simulation exercise. The first two columns re-port the short-term effects of CSR on achievement based on the changes between
1995 and 1997 in class size, teacher experience, and teacher certification, and the last two columns report the long-term effects based on the changes between 1995 and 2001. The top panel shows the effects for the all schools combined, the second panel for low-poverty schools (less than 25 percent receiving subsidized lunch), the third panel for high-poverty schools (more than 75 percent receiving subsidized lunch), and the fourth panel for high-poverty, high-minority-enrollment schools (more than 75 percent receiving subsidized lunch and more than 75 percent black and/or His-panic). The differences in simulated achievement for each group come solely from differences in class size and teacher characteristics as effect sizes are restricted to Table 6
Effects of Teacher Quality on Student Achievement, Measuring Teacher Quality by Cohort Size of New Certified and Uncertified Teachers
Mathematics Reading Number of Teachers
Not certified 20.0012 20.0010
(4.71) (4.53)
Not certified, 1998 20.00004 0.0004 2,763
(0.10) (1.34)
Not certified, 1999 20.0002 0.0004 2,232
(0.53) (1.18)
Not certified, 2000 0.0001 0.0001 1,772
(0.11) (0.38)
Not certified, 2001 20.0003 20.0002 1,634
(0.67) (0.41)
Certified 20.0005 20.0004
(2.25) (2.15)
Certified, 1998 20.0006 20.0004 2,453
(1.77) (1.56)
Certified, 1999 20.0004 20.0005 2,104
(1.10) (1.83)
Certified, 2000 20.0005 20.0002 2,445
(1.47) (0.63)
Certified, 2001 20.0005 20.0003 2,079
(1.42) (1.16)
Observations 65,511 65,511
School-by-grade fixed effects yes yes
School-by-year fixed effects yes yes
Student characteristics yes yes
be constant across demographic groups based on the findings reported in Table 5. Us-ing the notation from Equation 1,
ˆ
DA¼dDˆ CS+ˆlDT: ð4Þ
Note that CS contains class size in second, third, and fourth grade andTcontains the percentage of teachers in their first year of teaching, the percentage of teachers in their second year of teaching, and the percentage of teachers without full certification.
Overall, the simulated CSR effect on achievement is noticeably larger in the long run than in the short run, as many schools had not fully implemented CSR by 1997. Regardless, the class-size effect swamps the offsetting effects caused by changes in the teacher characteristics. For the state as a whole, the average short-run benefit is 0.116 standard deviations in mathematics and 0.074 standard deviations in reading, compared to long-run effects of 0.167 standard deviations in mathematics and 0.099 standard deviations in reading.
Table 7
Simulated Effects of Class Size and Teacher Characteristics on Achievement, by Demographic Group
Short-Term Effects Long-Term Effects
Mathematics Reading Mathematics Reading
All schools
Class size 0.126 0.082 0.172 0.102
Teacher experience 20.007 20.006 20.001 20.001
Teacher certification 20.003 20.002 20.003 20.002
Total 0.116 0.074 0.167 0.099
Low-poverty schools
Class size 0.138 0.088 0.171 0.101
Teacher experience 20.006 20.005 20.002 20.001
Teacher certification 20.001 20.001 20.001 20.001
Total 0.131 0.082 0.169 0.099
High-poverty schools
Class size 0.117 0.078 0.168 0.101
Teacher experience 20.009 20.007 20.001 20.001
Teacher certification 20.005 20.004 20.005 20.004
Total 0.103 0.067 0.162 0.095
High-poverty high-minority schools
Class size 0.114 0.076 0.166 0.100
Teacher experience 20.009 20.007 20.001 20.001
Teacher certification 20.006 20.005 20.006 20.004
Total 0.099 0.064 0.160 0.094
Not surprisingly given the observed changes in teacher characteristics and slower program takeup in higher poverty schools, the benefits are larger in low-poverty than in high-poverty schools. Importantly, however, such gaps shrink over time: The difference is roughly 20 percent in the short run but only around 4 percent in the longer run as high-poverty school implementation rates rise and the share of new teachers declines from its high level immediately following the passage of CSR. Even the 20-24 percent differential between high-poverty, high-minority schools, and low-poverty schools in the estimated benefit of CSR for the period im-mediately following statewide implementation declines to roughly 5 percent in only four more years. Thus although the typical higher poverty, high minority en-rollment school was slower to adopt the program and appears to have suffered more adverse changes to the teaching force, there is little evidence that major differences in the benefits of CSR by demographic characteristics persisted beyond the initial implementation years.
VII. Summary and Policy Implications
In this study we investigated the direct and indirect effects of Califor-nia’s Class Size Reduction program. CSR reduced class size across the state and led to a short-term increase in the share of teachers lacking experience and a persistent increase in the share of teachers lacking full certification, both of which were larger in higher poverty, higher minority enrollment schools. This raised the possibility that Table A1
Variance Decomposition by Grade and CSR Status
Grade 2 Grade 3
Overall Variance by Grade and CSR Status
In CSR 1.47 1.29
[n¼21,081] [n¼18,488]
Not in CSR 11.42 14.71
[n¼821] [n¼3,665]
All schools 2.49 12.41
[n¼21,902] [n¼22,153]
Within-school Variance by Grade and CSR Status
Always participated in CSR 0.94 0.87
[n¼18,536] [n¼11,055]
Sometimes participated in CSR 5.74 14.72
[n¼3,344] [n¼10,643]
Never participated in CSR 2.99 4.12
[n¼22] [n¼455]
All schools 1.68 7.59
the program benefits would be tilted toward higher income communities, but the results suggest that any meaningful differences in the effects of CSR by income were limited to the years immediately following implementation when there was a spike in the share of teachers with no prior experience. There is little or no evidence of dif-ferential class-size effects by student demographic characteristics and although sig-nificant, only a small teacher quality differential by certification status. Moreover, there is little or no support for the hypotheses that the need to hire large numbers of teachers following the adoption of CSR led to a lasting reduction in the quality of instruction.
Overall, the findings suggest that CSR increased achievement in the early grades for all demographic groups, and an important question is whether the benefits justify the substantial cost. Clearly this type of targeted state spending limits the flexibility of schools and districts in allocating resources and responding to changes in operat-ing budgets, though the cost of this constraint in terms of lower quality depends on the degree of inefficiency in unconstrained district choices and voter willingness to finance schools with fewer limits on the use of resources. From a purely distribu-tional point of view, the benefits of CSR were allocated in a quite regressive manner Table A2
Within-cohort Correlation in Class Size and Teacher Characteristics Controlling for School-by-year and School-by-grade Fixed Effects
Grade 1 Grade 2 Grade 3 Grade 4
Class size
Grade 1 1
Grade 2 0.2426 1
Grade 3 0.1143 0.2271 1
Grade 4 20.0619 20.0934 0.0087 1
Percent first-year teachers
Grade 1 1
Grade 2 0.0260 1
Grade 3 0.0475 0.0471 1
Grade 4 0.0766 0.0924 0.1226 1
Percent second-year teachers
Grade 1 1
Grade 2 0.0312 1
Grade 3 0.0422 0.0614 1
Grade 4 0.0577 0.0801 0.1263 1
Percent not certified
Grade 1 1
Grade 2 0.0318 1
Grade 3 0.0266 0.0166 1
Table A3
Student Demographic Coefficients from Table 3: Effects of Class Size, Teacher Experience, and Teacher Certification on Student Achievement
Mathematics Reading
(1) (2) (3) (4) (6) (7) (8) (9)
Percent black
Grade 2 20.0074 20.0071 20.0066 20.0061 20.0075 20.0082 20.0041 20.0056
(12.59) (7.46) (11.53) (6.30) (15.63) (10.48) (8.82) (7.31) Grade 3 20.0084 20.0090 20.0082 20.0087 20.0095 20.0102 20.0075 20.0069
(15.33) (11.86) (15.22) (10.73) (21.21) (17.05) (17.28) (10.67) Grade 4 20.0093 20.0080 20.0093 20.0077 20.0111 20.0094 20.0088 20.0068
(17.23) (11.78) (17.18) (9.05) (24.57) (17.14) (19.91) (10.31)
Percent Hispanic
Grade 2 20.0045 20.0037 20.0047 20.0037 20.0056 20.0050 20.0050 20.0043
(11.64) (7.12) (11.83) (6.43) (17.38) (11.87) (15.26) (9.58) Grade 3 20.0046 20.0048 20.0052 20.0055 20.0072 20.0071 20.0075 20.0068
(12.12) (9.45) (13.50) (10.03) (23.10) (18.11) (23.90) (15.60) Grade 4 20.0046 20.0044 20.0053 20.0055 20.0069 20.0063 20.0070 20.0065
(12.41) (9.79) (13.78) (9.92) (22.37) (16.79) (22.17) (14.62)
Percent Asian
Grade 2 0.0020 0.0025 0.0028 0.0036 0.0005 20.0008 0.0023 0.0011
(3.65) (3.41) (4.91) (4.11) (1.18) (1.42) (5.10) (1.70) Grade 3 0.0026 0.0031 0.0035 0.0045 20.0033 20.0023 20.0014 0.0004
(5.06) (4.09) (6.49) (5.69) (8.07) (3.94) (3.39) (0.54) Grade 4 0.0027 0.0021 0.0036 0.0029 20.0022 20.0019 20.0004 20.0004
(5.10) (3.64) (6.60) (4.01) (5.31) (4.19) (0.91) (0.72)
Percent LEP
Grade 2 20.0023 20.0025 20.0018 20.0023 20.0035 20.0038 20.0023 20.0034
(8.11) (6.34) (5.92) (5.56) (15.88) (11.44) (9.96) (9.97)
The
Journal
of
Human
(10.70) (10.47) (9.40) (7.94) (18.69) (19.37) (12.65) (10.84) Percent free lunch
Grade 2 20.0001 20.0005 0.0003 20.0005
(0.41) (1.35) (1.16) (1.60)
Grade 3 20.0009 20.0008 20.0015 20.0009
(3.16) (2.37) (6.92) (3.30)
Grade 4 20.0011 20.0008 20.0009 20.0007
(3.83) (2.54) (3.90) (2.73)
Observations 65,511 65,511 65,511 65,511 65,511 65,511 65,511 65,511
School fixed effects yes no no no yes no no no
School-by-grade fixed effects no yes no yes no yes no yes
School-by-year fixed effects no no yes yes no no yes yes
Student characteristics yes yes yes yes yes yes yes yes
Notes: Absolute values oft-statistics are in parentheses. Because Columns 5 and 10 of Table 3 exclude student characteristics, there are no Columns 5 and 10 in this table.
Jepsen
and
Ri
vkin
in the short term but in a close to neutral manner as of six years following the imple-mentation of the policy.
References
Angrist, Joshua, and Victor Lavy. 1999. ‘‘Using Maimonides’ Rule to Estimate the Effect of Class Size on Scholastic Achievement.’’Quarterly Journal of Economics114(2): 533–76. Ballou, Dale, and Michael Podrusky. 1997.Teacher Pay and Teacher Quality.Kalamazoo,
MI: The Upjohn Institute.
Bohrnstedt, George, and Brian Stecher, eds. 1999.Class Size Reduction in California: Early Evaluation Findings, 1996-1998.Palo Alto: American Institutes for Research.
Boyd, Don, Hamilton Lankford, Susanna Loeb, and James Wyckoff. 2003. ‘‘Analyzing the Determinants of the Matching of Public School Teachers to Jobs.’’ National Bureau of Economic Research Working Paper Number 9878.
Ehrenberg, Ronald, Dominic Brewer, Adam Gamoran, and J. Douglas Willms. 2001. ‘‘Class Size and Student Achievement.’’Psychological Science in the Public Interest2(1):1–30. Hanushek, Eric. 1999. ‘‘Some Findings from an Independent Investigation of the Tennessee
STAR Experiment and from Other Investigations of Class Size Effects.’’Educational Evaluation and Policy Analysis21(2):143–64.
Hanushek, Eric, John Kain, and Seven Rivkin. 2004. ‘‘Disruption versus Tiebout
Improvement: The Costs and Benefits of Switching Schools.’’Journal of Public Economics
88(9-10): 1721–46.
Hoxby, Caroline Minter. 2000. ‘‘The Effects of Class Size on Student Achievement: New Evidence from Population Variation.’’Quarterly Journal of Economics115(4):1239–86. Jepsen, Christopher, and Steven Rivkin. 2002.Class Size Reduction, Teacher Quality, and Academic Achievement in California Elementary Public Schools.San Francisco: Public Policy Institute of California.
Krueger, Alan. 1999. ‘‘Experimental Estimates of Education Production Functions.’’
Quarterly Journal of Economics114(2):497–532.
Krueger, Alan, and Diane Whitmore. 2001. ‘‘The Effect of Attending a Small Class in the Early Grades on College Test-Taking and Middle School Test Results: Evidence from Project STAR.’’The Economic Journal111(1):1–28.
Rivkin, Steven. 2006. ‘‘Cumulative Nature of Learning and Specification Bias in Education Research.’’ Unpublished.
Rivkin, Steven G., Eric A. Hanushek, and John F. Kain. 2005. ‘‘Teachers, Schools, and Academic Achievement.’’Econometrica73(2):417–58.
Ross, Randy. 1999. ‘‘How Class-Size Reduction Harms Kids in Poor Neighborhoods.’’
Education Week, May 26.
Sims, David. 2003. ‘‘How Flexible is Educational Production? Combination Classes and Class Size Reduction in California.’’ Unpublished.
Stecher, Brian, and George Bohrnstedt, eds. 2000.Class Size Reduction in California: The 1998-1999 Evaluation Findings.Sacramento: California Department of Education. __________. 2002.What Have We Learned about Class Size Reduction in California?
Sacramento: California Department of Education.
Todd, Petra, and Kenneth I. Wolpin. 2003. ‘‘On the Specification and Estimation of the Production Function for Cognitive Achievement.’’Economic Journal113(485): F3–F33. Unlu, Fatih. 2005. ‘‘California Class Size Reduction Reform: New Findings from the NAEP.’’