Full Terms & Conditions of access and use can be found at
http://www.tandfonline.com/action/journalInformation?journalCode=cbie20
Download by: [Universitas Maritim Raja Ali Haji] Date: 17 January 2016, At: 23:43
Bulletin of Indonesian Economic Studies
ISSN: 0007-4918 (Print) 1472-7234 (Online) Journal homepage: http://www.tandfonline.com/loi/cbie20
Survey of recent developments
Vikram Nehru
To cite this article: Vikram Nehru (2013) Survey of recent developments, Bulletin of Indonesian Economic Studies, 49:2, 139-166, DOI: 10.1080/00074918.2013.809840
To link to this article: http://dx.doi.org/10.1080/00074918.2013.809840
Published online: 26 Jul 2013.
Submit your article to this journal
Article views: 382
View related articles
ISSN 0007-4918 print/ISSN 1472-7234 online/13/020139-28 © 2013 Indonesia Project ANU http://dx.doi.org/10.1080/00074918.2013.809840
SURVEY OF RECENT DEVELOPMENTS
Vikram Nehru*
Carnegie Endowment for International Peace, Washington DC
SUMMARY
The process for Indonesia’s 2014 parliamentary and presidential elections is underway. A few discernible patterns have emerged, yet the political situation at this early stage remains luid and both races are open. Recent events have shown, however, that Indonesian democ -racy itself is still relatively young and evolving, the balance of power between key institu-tions is still unsettled, and constitutional checks and balances are still being tested.
Macroeconomic developments over the last few months have been mixed. Economic growth stayed above 6%, despite a dificult external environment, and inlation, which climbed in the irst quarter, began to ease in April and May. At the same time, slower invest -ment growth, deicits in the current and capital accounts of the balance of pay-ments, down -ward pressure on the rupiah, and the risk of further increases in interest and exchange rates cast a shadow over near-term growth prospects. The recent rise in global interest rates trig-gered a capital outlow that contributed to a stock-market correction and placed the rupiah under new pressure. Bank Indonesia responded by raising the overnight rate, which helped to calm markets. But given relatively large non-resident holdings of Indonesian stocks and bonds and continued upward pressure on global interest rates, Indonesia’s balance of pay-ments and capital market will likely remain under strain for the foreseeable future.
Policy developments were also mixed. The appointment of a technocrat as inance min -ister sent a reassuring signal to markets and investors. And parliament inally approved a revised budget based on more realistic assumptions and included a much delayed across-the-board increase in fuel prices, together with compensatory programs for the poor. This achievement should help boost investor conidence and generate public resources for urgent infrastructure and social-assistance programs. At the same time, however, recent measures to restrict imports of horticultural products attracted the ire of trading partners and domestic consumers, leading to their partial reversal. These measures, together with draft trade and industry laws awaiting parliamentary approval, represent a new economic nationalism that seeks to protect domestic producers against what is seen as unfair inter-national competition.
The fuel-price increase, rising income inequality and an ambitious target of reducing the poverty rate to 8%–10% in 2014 – the last year of President Yudhoyono’s inal term – brings into focus the eficacy of Indonesia’s social-assistance programs. It also adds fresh urgency to government efforts to improve the coverage, inancing, targeting, and institu -tional arrangements underpinning these programs. The challenge has always been, and remains, that without central monitoring and oversight, local political pressures tend to dilute program beneits for the intended beneiciaries.
* The author thanks Magda Adriani, Vivi Alatas, Haryo Aswicahyono, Ben Bingham, Tim Buehrer, Nadia Bulkin, James Castle, Ndiame Diop, Edimon Ginting, Anton Gunawan, Nina Herawati, Mohamad Ikhsan, Peter McCawley, Antonio Ollero, Ririn Purnamasari, Sjamsu Rahardja, Douglas Ramage, Alex Sienaert, Bhimanto Suwastoyo, Meidyatama Suryodiningrat, Ashley Taylor, Thee Kian Wie, Matthew Wai-Poi, William Wallace, and numerous faculty members of the ANU College of Asia and the Paciic. They bear no responsibility for any errors.
POLITICAL DEVELOPMENTS
Indonesia’s 2014 election process reached a milestone on 22 April 2013, as the 12 political parties deemed eligible by the General Election Commission (Komisi Pemilihan Umum, KPU) submitted their provisional lists of candidates for the national parliament (Dewan Perwakilan Rakyat, DPR), the provincial assemblies (Dewan Perwakilan Rakyat Daerah, DPRD) and the district assemblies (rural
kabupaten and urban kota).1 In addition to electing a president, the electorate will
vote on representatives for all three levels of Indonesia’s decentralised political structure – 560 seats in the DPR, 2,137 seats in 34 DPRDs and 17,560 seats in 510
kabupaten or kota. For the irst time, the KPU will use data collected from electronic
identity cards (e-ID or e-KTP), which are expected to reduce electoral irregulari-ties but may not yet cover all potential voters. One estimate indicates that poten-tial voters in Indonesia and abroad total 190,463,184 (Antara, 16/4/2013).
Despite the low probability of being re-elected (one in three) and the low regard in which the public holds parliament (Hamid 2012: 343), more than 90% of the DPR’s 560 incumbents have been nominated for re-election. These include some who are being investigated for corruption (Jakarta Post, 29/4/2013). Another fea-ture of the DPR candidate list is its gender composition: according to article 55 in Law 8/2012 on General Elections, at least one in every three candidates on a polit-ical party’s list should be a woman.2 The threshold appears to have been reached
in the aggregate – of 6,576 provisional candidates in total, 2,434 are women – but each party is also expected to meet this threshold in each electoral district. The KPU rejected the lists of candidates of eight parties for certain kabupaten and kota
because they failed to comply with this requirement (Jakarta Post, 14/6/2013).3
Three important features are evident at this early stage of the electoral process. The irst is that, with nine months until the DPR elections and almost a full year until the presidential elections, the political situation remains luid and the out-come looks hard to predict. For example, the latest polls show the dominant ive parties to be Golkar, PDI–P, Gerindra, PAN and the Democratic Party, but their rankings change with each poll, and other parties occasionally appear in the top ive.
Similarly, although the inal list of presidential candidates will not be known for at least nine months, opinion polls and surveys on who is likely to be the next president are becoming increasingly frequent, and some potential candi-dates have already begun unoficial presidential campaigns. The most prominent
1 The 12 parties are the Crescent and Star Party (Partai Bulan Bintang, PBB); the Demo-cratic Party (Partai Demokrat, PD); Gerindra; Golkar; Hanura; the Indonesian DemoDemo-cratic Party of Struggle (Partai Demokrasi Indonesia – Perjuangan, PDI–P); the Indonesian Jus-tice and Unity Party (Partai Keadilan dan Persatuan Indonesia, PKPI); the National Awak-ening Party (Partai Kebangkitan Bangsa, PKB); the National Democratic Party (Nasdem); the National Mandate Party (Partai Amanat Nasional, PAN); the Prosperous Justice Party (Partai Keadilan Sejahtera, PKS); and the United Development Party (Partai Persatuan Pembangunan, PPP).
2 Women held 18.2% of seats in the DPR following the 2009 election, compared with 11% after the 2004 elections. The average female parliamentary representation worldwide is 20.4%.
3 The eight parties were Gerindra, Hanura, PAN, PBB, PKB, PKPI, PKS and PPP.
name continues to be the immensely popular governor of Jakarta, Joko Widodo (known as Jokowi), who just last year defeated the incumbent governor, Fauzi Bowo, despite being considered an outsider. Jokowi has not declared himself a candidate for the presidency, but he has been consistently ranked irst by a wide margin in the few published polls in which his name has appeared.4 Since
coali-tions among parties tend to be driven more by opportunistic than by strategic factors, the permutations and combinations of possible party alliances and their corresponding presidential (and vice-presidential) nominees at this point appear virtually limitless (Hamid 2012).
The second notable feature is the parlous state of the Democratic Party – the party of incumbent president Susilo Bambang Yudhoyono. In a bid to revive its fading fortunes in the polls, and after its previous chairman, Anas Urbaningrum, was named by the Corruption Eradication Commission (Komisi Pemberan-tasan Korupsi, KPK) as a suspect in a corruption scandal, the Democratic Party elected President Yudhoyono as its new chairman on 30 March 2013 (Jakarta Post, 22/4/2013). In an unusual move, the Democratic Party stated that it will hold a ‘primary’, modelled loosely on the American system, to choose its presidential nominee, and intends to announce the result after the DPR elections (Jakarta Globe, 10/4/2013).5 This innovative approach has brought to the surface several
poten-tial presidenpoten-tial nominees – including Trade Minister Gita Wirjawan, Regional Representative Council chairman Irman Gusman, and Constitutional Court Chief Justice Mohammad Mahfud MD – who could bring fresh energy to both the party and the presidential race (Jakarta Post, 24/4/2013).
The third feature is the continued poor showing of Indonesia’s Islamic parties in the polls.6 If Indonesia’s political landscape shows any ideological pattern, it is
the cleavage between the pluralist parties (Gerindra, Golkar, Hanura, PDI–P and the Democratic Party) and the Islamic parties (PKS, PPP, PKB and PAN) (Mietzner 2013). Whether individually or together, Islamic parties have been unable to obtain the same traction in the electorate as pluralist parties. Partly as a result, the party platforms of the Islamic parties no longer feature the establishment of
syariah law, and have instead turned to more mainstream, pluralistic agendas in a bid to reverse their declining electoral performance.7
4 Widodo is a member of PDI–P, and his nomination as a presidential candidate will depend on whether the party – and particularly its chairperson, Megawati Sukarnoputri – nominate him.
5 The actual process for selecting and then electing a Democratic Party presidential can-didate has not been clariied, but it is doubtful that the party will hold American-style ‘primary elections’. It is more likely to use national polls.
6 The KPK is investigating the actions of senior PKS oficials who are alleged to have pres -sured Ministry of Agriculture staff into issuing licences to businessmen with close connec-tions to the party.
7 PPP captured 11% of the legislative seats in 1999 but only 8% in 2004 and 5% in 2009. PKB won 13% in 1999 but only 11% in 2004, and won less than 5% in 2009. PAN secured 7% in 1999, 6.4% in 2004 and 6% in 2009. PKS, under its current name, won 7.3% in 2004 and 7.8% in 2009; in 1999, its predecessor party, Partai Keadilan, won only 1.4% of the vote (below the 2% threshold) and therefore had to reinvent itself as a new party, with a new name, in order to contest the 2004 elections. It has also been the party most damaged by recent corruption allegations.
As some have noted (Hamid 2012), the eficiency, transparency and repeated success of Indonesia’s elections contrast with the quality of its democracy; three recent developments underscore that Indonesian democracy is still young and that political reforms remain a work in progress.
The irst suggests that the military and the police still consider themselves to be above the rule of law, and that other state institutions appear too weak to hold them accountable. On 21 March 2013, 11 members of Indonesia’s special armed forces, Kopassus, stormed Cebongan prison, outside Yogyakarta, in a commando-style attack, with an extraordinary amount of military precision and hardware, and killed four prisoners who had earlier been jailed on suspicion of killing a Kopassus member (Jakarta Post, 24/4/2013). Only after several days did the mili-tary acknowledge that some of its members were behind the attack. It launched an investigation, yet it continued to praise the attackers for their esprit de corps. The case has been submitted to a military tribunal, an action that has drawn criti-cism from human-rights groups, which have called for it to be brought in front of a civilian court (Jakarta Globe, 4/6/2013). Whether the state will be able to dis-pense appropriate justice to the guilty will be an important test of whether Indo-nesia subjects its military to the same rule of law as it does its civilians.
In a separate case, a former senior police oficer, retired commissioner general Susno Duadji – once head of the national crime investigation agency – convicted on corruption charges by the Supreme Court, refused to be arrested by state prosecutors from the Attorney General’s Ofice (Jakarta Post, 26/4/2013). Susno was protected initially by dozens of police oficers, irst at his home and then at the West Java police headquarters, and he remained at large for a full week, despite orders for his arrest from President Yudhoyono. The weakness of the state apparatus in the face of such deiance became all the more apparent when Susno uploaded a YouTube video of himself challenging his conviction. Although his name was eventually removed from the list of PBB candidates for the legislative elections, he was replaced by his daughter, Diliana Ermaningtias (Jakarta Globe, 22/5/2013). Susno is now awaiting trial.
The second development highlighting Indonesia’s transition to democracy is the debate surrounding unsettled aspects of the election process. For example, the DPR is still discussing a plan to amend Law 42/2008 on Presidential Elections, and it is possible that the debate could extend to August 2013. Smaller political parties want to amend the law’s requirement that a political party or a coalition of parties must secure at least 20% of DPR seats or 25% of the popular vote in the leg-islative election in order to nominate a presidential candidate. Unsurprisingly, the three main political parties – Golkar, PDI–P and the Democratic Party – oppose any such amendment (Jakarta Post, 11/4/2013).
The election of district heads and mayors is also under debate. The current system requires that they be elected directly, but violence in a few districts dur-ing recent elections prompted calls for district heads and mayors to be elected indirectly, through district assemblies. The bill proposing such a change, together with a proposal to reform the inancing of local campaigns, is being discussed by the DPR but is unlikely to be settled this year (Jakarta Globe, 10/4/2013).
The third development concerns the balance of power between the executive and the legislature, the centre and the provinces, and the government and civil society. The current checks and balances within Indonesia’s political system were
introduced following Soeharto’s departure, to ensure that power could no longer be concentrated in the executive or the capital. There has been impressive pro-gress in digesting these democratisation and decentralisation reforms, but much remains to be done. For example, the executive and legislature are still coming to terms with having their laws and regulations scrutinised by a Constitutional Court that has lexed its muscles in recent pronouncements (Cornwell and Anas 2013). And in response to a recent effort by the DPR to pass a law giving it the authority to freeze or disband mass organisations, civil society eventually con-vinced parliamentarians to drop the bill (Asia News Network, 12/4/2013).
In sum, nine months remain before the elections commence, and the races for the DPR and the presidency remain open. At this stage, the three or four largest political parties look set to dominate the DPR results in April 2014, although the ranking among them is still uncertain. While the outcome of the DPR elections and the ensuing political manoeuvring will determine the candidate slate for the presidential elections in July 2014, the candidate backed by the largest party coali-tion will not necessarily be guaranteed victory. As last year’s race for the Jakarta governorship demonstrated, when it comes to executive positions party afilia-tions matter less than broad electoral appeal. Current polls suggest that if Jokowi succeeds in getting his name on the presidential ballot, he could well become Indonesia’s next president.
MACROECONOMIC DEVELOPMENTS
The Indonesian economy entered 2013 in reasonably sound economic condition, although its external and internal vulnerabilities have come into focus in recent weeks. GDP growth has remained strong, inlation appears to be retreating from recent highs, consumer conidence remains solid, and parliament approved a revised budget that limited the subsidy bill by increasing fuel prices. But other developments in the domestic and international economy are casting a shadow over near-term prospects. Aggregate investment growth, for example, slowed recently, as did foreign direct investment; a rising trade deicit has accompanied a capital-account deicit for the irst time in years, and the recent rise in global interest rates has triggered capital outlows and elevated risk levels for banks and non-inancial corporations.
Given the economic challenges ahead, the markets welcomed the appointment of Chatib Basri, a well-respected macroeconomist, as inance minister, on 20 May 2013. Basri immediately identiied his priorities as cutting the fuel subsidy and building infrastructure (Bloomberg, 22/5/2013). He replaced Agus Martowardojo, who assumed his new position as governor of Bank Indonesia (BI) on 24 May 2013.
Economic growth
The irst quarter of 2013 showed a gradual deceleration in year-on-year GDP growth to 6.0%, continuing a trend through most of 2012, when the second, third and fourth quarters registered respective growth rates of 6.4%, 6.2% and 6.1%. This gradual decline notwithstanding, growth has proved resilient to contin-ued weak performance in Indonesia’s main export markets – especially those in Europe – and a steady slowdown in China, whose GDP growth fell from 9.3% in
2011 to 7.7% in the irst quarter of 2013 and looks likely to fall further in the second quarter, following a substantial credit crunch (OECD 2013; United Nations 2013).
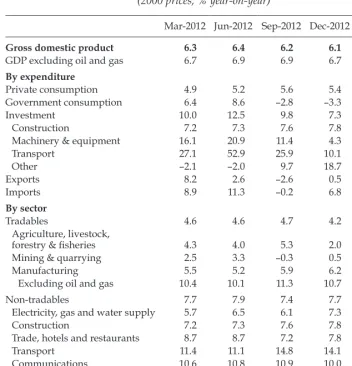
On the expenditure side of Indonesia’s national accounts, investment growth decelerated, surprisingly, in the irst quarter, to around 6% (table 1), down sharply from its average of 9.8% in 2012. Investment has driven growth in Indonesia for more than a decade, so the current slowdown is concerning. It was accompanied by a 16.2% (year-on-year) decline in capital-goods imports in the irst quarter, which may be a harbinger of further falls in investment growth in subsequent quarters. Net exports, in contrast, contributed positively to the quarter’s growth – in a signiicant change from the previous year, when it exerted a drag. Linked to this rise in exports was a substantial decline in imports, which comprised drops in both capital-goods imports (–16.2% year-on-year), as mentioned, and consumer-goods imports (–15.8%), the fall in the latter owing in part to the introduction
TABLE 1 Components of GDP Growth (2000 prices; % year-on-year)
Mar-2012 Jun-2012 Sep-2012 Dec-2012 Mar-2013
Gross domestic product 6.3 6.4 6.2 6.1 6.0
GDP excluding oil and gas 6.7 6.9 6.9 6.7 6.7
By expenditure
Private consumption 4.9 5.2 5.6 5.4 5.2
Government consumption 6.4 8.6 –2.8 –3.3 0.4
Investment 10.0 12.5 9.8 7.3 5.9
Construction 7.2 7.3 7.6 7.8 7.2
Machinery & equipment 16.1 20.9 11.4 4.3 0.0
Transport 27.1 52.9 25.9 10.1 4.4
Other –2.1 –2.0 9.7 18.7 22.3
Exports 8.2 2.6 –2.6 0.5 3.4
Imports 8.9 11.3 –0.2 6.8 –0.4
By sector
Tradables 4.6 4.6 4.7 4.2 4.2
Agriculture, livestock,
forestry & isheries 4.3 4.0 5.3 2.0 3.7
Mining & quarrying 2.5 3.3 –0.3 0.5 –0.4
Manufacturing 5.5 5.2 5.9 6.2 5.8
Excluding oil and gas 10.4 10.1 11.3 10.7 9.8
Non-tradables 7.7 7.9 7.4 7.7 7.6
Electricity, gas and water supply 5.7 6.5 6.1 7.3 6.5
Construction 7.2 7.3 7.6 7.8 7.2
Trade, hotels and restaurants 8.7 8.7 7.2 7.8 6.5
Transport 11.4 11.1 14.8 14.1 12.8
Communications 10.6 10.8 10.9 10.0 11.4
Financial, rental & business
services 6.4 7.1 7.5 7.7 8.4
Other services 5.5 5.8 4.5 5.3 6.5
Source: CEIC Asia Database.
of recent non-tariff restrictions on beef and horticultural products (BPS 2013b). Household consumption remained resilient and continued to grow at more than 5% year-on-year.
Indonesia’s GDP results for the irst quarter of 2013, by sector of origin, show a pattern typical of recent quarters: the tradable sectors (agriculture, mining and industry) grew more slowly than average, while the non-tradable sectors (utili-ties, construction, retail and wholesale trade, transport, and inance) grew faster than average. The slowdown in manufacturing growth – quarter-on-quarter and year-on-year – came as a surprise, especially because large- and medium-scale industries reportedly expanded by 8.9% year-on-year in the quarter (BPS 2013c).8
Mining continues to suffer from low international prices (relative to earlier highs), and output stayed virtually lat.
The performance of the non-tradable sectors has been unambiguously positive, as supported by the micro-data: bank earnings have been strong (Bloomberg, 1/5/2013); tourist arrivals rose by 6% year-on-year in the irst
quar-ter (TravelDailyNews, 8/5/2013); and the irst-quarter earnings results of a few
service-related state enterprises – such as Telkomsel and Pelindo II – showed big jumps in proits (Jakarta Post, 24/4/2013, 1/5/2013).
Balance of payments
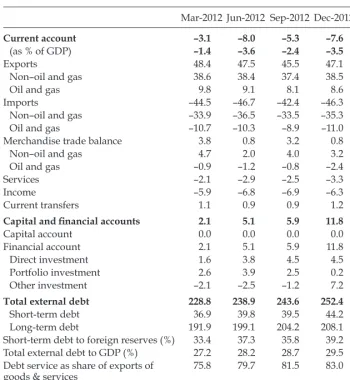
Indonesia’s external accounts weakened in the irst quarter of 2013. The bal-ance of payments registered a deicit in both the current account and the capital account for the irst time since the fourth quarter of 2008. The non-oil trade deicit improved slightly, in part because imports declined faster than exports (by –4.4% and –4.1%, respectively). The oil-trade balance, in contrast, widened signiicantly, as oil and gas exports declined by 13.5% year-on-year, in nominal terms, while the combination of economic growth and subsidised fuel prices kept imports grow-ing at a healthy 7.4% (BI 2013a).
Trade data for April showed that the trade balance fell back into deicit (ig-ure 1), after registering a small surplus in March (when exports declined faster than imports) (BPS 2013b). The decline in export earnings was due largely to a decline in mineral exports, as a consequence of slower demand growth in Europe, Japan and China.9 China accounts for nearly 14% of Indonesia’s non–oil and gas
exports, and is by far its largest market (BPS 2013a); Indonesia’s export perfor-mance is therefore closely associated with changes in China’s import volumes (igure 2a). The bulk of these imports are raw materials, so slower demand growth in China explains in large part the decline in Indonesia’s earnings from raw-material exports (igure 2b).
In the capital account of the balance of payments, gross foreign direct invest-ment (FDI) inlows fell by 20% year-on-year, in nominal terms, in the irst quarter
8 The BPS survey of manufacturing captures output value and not value added, and it excludes small and medium enterprises (SMEs). Even so, the striking contrast between the national account results and the survey results for the irst quarter of 2013 is noteworthy. 9 Indonesian exports to Europe fell by 9.6% (January–April 2013, year-on-year), to Japan by 5.0% and to China by 2.8%.
FIGURE 2a Growth in Indonesian Exports and Chinese Imports (% year-on-year)
Source: OECD.
Note: Based on six-month moving averages.
FIGURE 1 Exports, Imports and the Trade Balance ($ billion)
Source: CEIC Asia Database; BPS.
of 2013 (BI 2013c; BKPM 2013).10 This partly explains some of the concurrent
decline in capital-goods imports. Manufacturing accounted for 34.3% of total FDI in the quarter, the largest share of which went to the chemicals and pharmaceu-ticals, metal, machinery, electronic, and vehicle industries. Mining accounted for 11.8% of total FDI (BI 2013b; BKPM 2013).
Three other noteworthy developments affected the capital account of the bal-ance
of payments. The irst was a sharp turnaround in portfolio capital lows. In the irst three months of the year, net portfolio inlows were strong; they showed considerable foreign appetite for Indonesian public and private securities and relected the surge in global liquidity. Foreigners bought more Indonesian stocks in the irst quarter of 2013 than in the four quarters of 2012 combined, which saw the Indonesia Stock Exchange (IDX) index break the symbolic 5,000 barrier, on 19 April, and reach record highs (Indonesia-Investments, 26/4/2013; Jakarta Post, 19/4/2013).
Events since the last week of May, however, have reversed some of these gains and given a glimpse of the volatility that can be expected in Indonesia’s capital and foreign-exchange markets as foreign-held portfolio positions unwind. The events were triggered by a statement from the chairman of the US Federal Reserve, Ben Bernanke, warning that the quantitative-easing program could be scaled back if the US economy continues to improve. US interest rates promptly climbed on the news and activated capital outlows from many emerging-market
10 The estimate excludes FDI outlows, which remained relatively small, and contrasts with BKPM’s announcement, on 22 April, that FDI in the irst quarter climbed by 27.2%. Although BKPM’s estimates exclude investments in oil and gas, banking, non-bank inan -cial institutions, insurance, leasing, and investments associated with licences issued by technical and sector agencies, the difference between the two estimates is striking.
FIGURE 2b Indonesian Exports to China ($ billion)
" ! !%$
"#
&$ !!" "'
Source: UN Comtrade database.
economies, including Indonesia. During 1–13 June, foreign holdings in Indonesia worth $2.3 billion were liquidated.11 On 11 June alone, the IDX index saw its
larg-est single-day loss (3.5%) since 2008; a fall in the rupiah against the dollar; and a sharp increase in bond yields, particularly for short tenors. Indonesia could draw comfort from not being hit as badly as some other Southeast Asian economies (especially Thailand and the Philippines, which saw their stock-exchange indices plunge by 5.0% and 4.6%, respectively, on 11 June). BI promptly raised its over-night deposit facility (Fasilitas Simpanan BI, FASBI) rate by 25 basis points, to 4.25%, and, after another drop in the IDX index, of 1.9% on 13 June, it elevated the
11 Of these, Treasury bills accounted for $894 million and equity for $1,403 million. Data drawn from BI and Ministry of Finance websites.
TABLE 2 Balance of Payments ($ billion)
Mar-2012 Jun-2012 Sep-2012 Dec-2012 Mar-2013
Current account –3.1 –8.0 –5.3 –7.6 –5.3
(as % of GDP) –1.4 –3.6 –2.4 –3.5 –2.4
Exports 48.4 47.5 45.5 47.1 45.5
Non–oil and gas 38.6 38.4 37.4 38.5 37.0
Oil and gas 9.8 9.1 8.1 8.6 8.5
Imports –44.5 –46.7 –42.4 –46.3 –43.8
Non–oil and gas –33.9 –36.5 –33.5 –35.3 –32.4
Oil and gas –10.7 –10.3 –8.9 –11.0 –11.5
Merchandise trade balance 3.8 0.8 3.2 0.8 1.6
Non–oil and gas 4.7 2.0 4.0 3.2 4.6
Oil and gas –0.9 –1.2 –0.8 –2.4 –3.0
Services –2.1 –2.9 –2.5 –3.3 –2.3
Income –5.9 –6.8 –6.9 –6.3 –5.7
Current transfers 1.1 0.9 0.9 1.2 1.1
Capital and inancial accounts 2.1 5.1 5.9 11.8 –1.4
Capital account 0.0 0.0 0.0 0.0 0.0
Financial account 2.1 5.1 5.9 11.8 –1.4
Direct investment 1.6 3.8 4.5 4.5 3.4
Portfolio investment 2.6 3.9 2.5 0.2 2.9
Other investment –2.1 –2.5 –1.2 7.2 –7.7
Total external debt 228.8 238.9 243.6 252.4 253.2
Short-term debt 36.9 39.8 39.5 44.2 45.2
Long-term debt 191.9 199.1 204.2 208.1 207.9
Short-term debt to foreign reserves (%) 33.4 37.3 35.8 39.2 43.2
Total external debt to GDP (%) 27.2 28.2 28.7 29.5 29.2
Debt service as share of exports of goods & services
75.8 79.7 81.5 83.0 73.9
Errors & omissions 0.0 0.1 0.3 –1.0 0.0
Overall balance (change in reserves) –1.0 –2.8 0.8 3.2 –6.6 Foreign reserves 110.5 106.5 110.2 112.8 104.8
Source: BI.
policy rate by 25 basis points, to 6.0%.12 This helped temporarily to settle the stock
and foreign-exchange markets and to claw back some of the losses; but Indonesia has the largest non-resident holdings of short-term liabilities in developing Asia, and
net capital outlows could occur periodically, as the economies of advanced countries recover and their governments gradually reverse their stance on mone-tary policy. Furthermore, China’s recent move to curtail its domestic credit growth will add further upward pressure to global interest rates and increase incentives for investors to withdraw their funds from Indonesia.
A second, related development is the sharp increase in the external debt-service ratio, which more than doubled from 35.3% at the end of 2010 to 83.0% at the end of 2012 (igure 3), although at the end of the irst quarter of 2013 it had eased to 73.9% (table 2). Almost all of the increase was accounted for by the private sec-tor (BI 2013d),13 which responded to low global interest rates and a stable rupiah
by increasing foreign borrowing by 68% in 2012 (with non-banks accounting for two-thirds of this increase).14 Now that global interest rates are trending upwards
again, highly leveraged Indonesian non-bank corporations face higher
debt-12 BI uses the benchmark rate as a signalling device to inluence inlation expectations. It uses the ‘spread’ between the FASBI and the benchmark rate to signal technical adjust-ments to monetary policy aimed at a inancial-market audience.
13 The debt-service ratio is the ratio of the sum of amortisation and interest payments on the external debt of the government and the private sector (in the numerator) and the ex-ports of goods and services (in the denominator). BI’s debt-service calculation in table I.10 of its external debt statistics shows a much lower ratio (34.7% at the end of March 2013) because (1) BI restricts debt-service payments in the numerator to debts with loan agree-ments only, and (2) it uses all current-account inlows (exports of goods and services as well as income and current transfer inlows) in the denominator.
14 It is possible that some of this increase could be on account of better statistical coverage by BI, but the debt-service ratio is high even by international standards.
FIGURE 3 Ratio of External Debt Service to Exports of Goods and Services (%)
Source: BI.
service risks, which, in due course, could exert pressure on the balance sheets of Indonesian banks.15 Leveraged commodity exporters are likely to be the worst hit
– earnings are likely to remain soft, even as debt-service payments rise.
Third, other risks are emerging in Indonesia’s external accounts which fur-ther
increase its macroeconomic vulnerability. The irst is the rise in the ratio of short-term external debt to reserves (which climbed from 41.4% in March 2012 to 49.7% in April 2013), especially as rolled-over debts will now be subject to higher interest rates.16 The second is the increase to more than $200 billion in Indonesia’s
inancing requirements (calculated as the current-account deicit plus the repay-ments of external debt) in 2012, which will also be subject to higher interest rates. As a consequence of these vulnerabilities, together with the delays in raising fuel prices (see below), global ratings agency Standard & Poor’s downgraded Indo-nesia’s outlook from ‘positive’ to ‘stable’, on the grounds that policy reforms had stalled and external vulnerabilities had increased (Star Online, 2/5/2013).
The combination of weakness in the current account, the increasing vulner-abilities of the capital account and a slowdown in FDI inlows has exerted down-ward pressure on the rupiah. Its nominal depreciation against the dollar, which had been steady during 2012 and in the irst ive months of 2013, accelerated in the irst half of June. The depreciation would have been greater had it not been for BI’s intervention in exchange markets, which reduced foreign-exchange reserves from $107.3 billion at the end of April to $105.2 billion at the end of May.
Fiscal policy
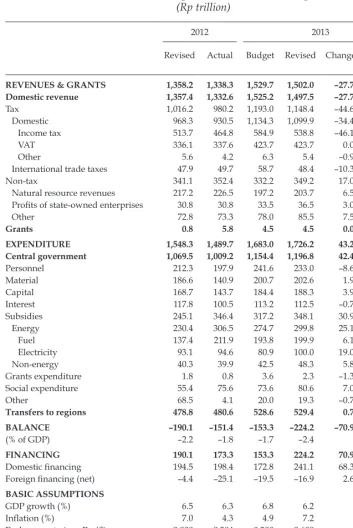
The 2013 budget contributed to some of Indonesia’s recent market uncertainties and increased volatility in its inancial markets. No sooner had the 2013 iscal year begun than it became clear that the macroeconomic assumptions underlying the budget were too optimistic and needed revision (table 3). The original budget assumed, for example, that domestic fuel consumption would be held to 45 mil-lion kilolitres per year, which implicitly meant a hike in the domestic fuel price, although the extent of the increase was not speciied.
The 2013 budget law gives the president the authority to raise the fuel price unilaterally, but President Yudhoyono seemed hesitant to use it. Ultimately, after weeks of internal government discussions about another, less politically sensi-tive way to reduce the fuel subsidy, Yudhoyono decided to increase fuel prices as part of the mid-term budget revision. One earlier proposal that gained traction involved raising the fuel price for cars – by Rp 1,500 per litre – but keeping the price unchanged for motorcycles and public transport.17 Such an approach would
have obviated the need to revise the budget allocation and avoided a contentious
15 Some of the increased borrowing could have been intra-irm, which may ameliorate rollover risk but not interest-rate risk.
16 Data for short-term debt by remaining maturity taken from from BI’s external-debt statistics, June 2013. External reserves data taken from BI’s balance-of-payments statistics. 17 This proposed increase in the fuel price, from Rp 4,500 per litre to Rp 6,000 per litre, would have seen car owners still enjoy a subsidy of about Rp 3,000 per litre (given an un-subsidised price of Rp 9,000–9,700 per litre).
TABLE 3 2012 Budget Outcome and 2013 Budget (Rp trillion)
2012 2013
Revised Actual Budget Revised Change Change (%)
REVENUES & GRANTS 1,358.2 1,338.3 1,529.7 1,502.0 –27.7 –1.8 Domestic revenue 1,357.4 1,332.6 1,525.2 1,497.5 –27.7 –1.8
Tax 1,016.2 980.2 1,193.0 1,148.4 –44.6 –3.7
Domestic 968.3 930.5 1,134.3 1,099.9 –34.4 –3.0
Income tax 513.7 464.8 584.9 538.8 –46.1 –7.9
VAT 336.1 337.6 423.7 423.7 0.0 0.0
Other 5.6 4.2 6.3 5.4 –0.9 –14.8
International trade taxes 47.9 49.7 58.7 48.4 –10.3 –17.5
Non-tax 341.1 352.4 332.2 349.2 17.0 5.1
Natural resource revenues 217.2 226.5 197.2 203.7 6.5 3.3 Proits of state-owned enterprises 30.8 30.8 33.5 36.5 3.0 9.0
Other 72.8 73.3 78.0 85.5 7.5 9.6
Grants 0.8 5.8 4.5 4.5 0.0 0.0
EXPENDITURE 1,548.3 1,489.7 1,683.0 1,726.2 43.2 2.6 Central government 1,069.5 1,009.2 1,154.4 1,196.8 42.4 3.7
Personnel 212.3 197.9 241.6 233.0 –8.6 –3.6
Material 186.6 140.9 200.7 202.6 1.9 0.9
Capital 168.7 143.7 184.4 188.3 3.9 2.1
Interest 117.8 100.5 113.2 112.5 –0.7 –0.7
Subsidies 245.1 346.4 317.2 348.1 30.9 9.7
Energy 230.4 306.5 274.7 299.8 25.1 9.1
Fuel 137.4 211.9 193.8 199.9 6.1 3.1
Electricity 93.1 94.6 80.9 100.0 19.0 23.5
Non-energy 40.3 39.9 42.5 48.3 5.8 13.7
Grants expenditure 1.8 0.8 3.6 2.3 –1.3 –35.2
Social expenditure 55.4 75.6 73.6 80.6 7.0 9.5
Other 68.5 4.1 20.0 19.3 –0.7 –3.4
Transfers to regions 478.8 480.6 528.6 529.4 0.7 0.1
BALANCE –190.1 –151.4 –153.3 –224.2 –70.9 46.2
(% of GDP) –2.2 –1.8 –1.7 –2.4
FINANCING 190.1 173.3 153.3 224.2 70.9 46.2
Domestic inancing 194.5 198.4 172.8 241.1 68.3 39.5 Foreign inancing (net) –4.4 –25.1 –19.5 –16.9 2.6 –13.5 BASIC ASSUMPTIONS
GDP growth (%) 6.5 6.3 6.8 6.2
Inlation (%) 7.0 4.3 4.9 7.2 Exchange rate (avg Rp/$) 9,000 9,384 9,300 9,600
SPN rate (avg %) 5.0 3.2 5.0 5.0
Crude oil price (avg $/barrel) 105.0 112.7 100.0 108.0 Oil production (avg ‘000 barrels/day) 930 861 900 840 Domestic fuel consumption (million kL) 40 45 46 48
Source: Ministry of Finance.
Note: Parliament issued its approved and revised budget on 18 June 2013. Figures for the actual 2012 budget are unaudited. VAT = value-added tax. SPN = Surat Perbendaharaan Negara (Treasury bills).
parliamentary debate, since a compensatory cash-transfer scheme for the poor would not have been necessary (Jakarta Post, 30/4/2013).18
A few days before the new policy was to go into effect, however, Yudhoyono changed his mind and opted for an across-the-board price increase, which was subsequently incorporated into the mid-year revised budget and submitted to parliament (Jakarta Post, 30/4/2013). Despite large protests, parliament approved the revised budget on 18 June, but not without a minor change to the draft – a small increase to the projected growth rate underpinning the revenue and expend-iture calculations.19 The vote comfortably favoured the government – 338 to 181
– although PDI–P, PKS, Gerindra and Hanura opposed the revision. This is the second time that PKS, a partner in the ruling coalition, with four of its members in the cabinet, has voted against a government-proposed increase to fuel prices.
The more realistic assumptions in the revised budget have also meant lower projected revenues and higher projected expenditures for the year, thus raising the
target budget deicit as a share of GDP from 1.7% to 2.4%. Most estimates of tax revenue have been lowered on account of a more conservative assumption of GDP growth (6.3%, compared with 6.8% in the original budget) and slower pro-jected growth in trade.
The key reason for expenditure increases in the revised budget is the higher projected level of subsidy payments, which will now account for more than 20% of total budgetary expenditures (up from 18.8% in the original budget). The new budget assumes a rise in the price of petrol from Rp 4,500 to Rp 6,500 a litre (a 44% increase) – still well below the unsubsidised market price of Rp 9,500 a litre – and in the price of diesel from Rp 4,500 to Rp 5,500 a litre (a 22% increase). Yet the pro-jected energy subsidy in the revised budget is still higher than it was in the origi-nal budget, on account of a higher assumed internatioorigi-nal oil price ($108 a barrel, compared with $100 a barrel in the original budget);20 lower assumed domestic
oil production (840,000 barrels a day, compared with 900,000 barrels a day); and a weaker rupiah (Rp 9,600 per dollar, compared with Rp 9,300 per dollar).21 Higher
fuel prices are also projected to raise the electricity subsidy, since there are no plans to accelerate the phased increase in electricity prices incorporated into the original budget. Non-energy subsidies (such as food, lour, seeds, public-service obligations, interest rates and tax subsidies) are also expected to climb.
The proposed budget revisions also included a prerequisite to the govern-ment’s raising fuel prices: an allocation of Rp 9 trillion for disbursement to 15.5 million poor households, over four months (almost Rp 150,000 per household per
18 A dual-pricing system would have saved an estimated Rp 52 trillion, of which Rp 21 trillion would have been assigned for deicit reduction and the remainder for infrastruc -ture and social assistance. The across-the-board price increase is set to save Rp 67.5 trillion, with Rp 30 trillion assigned for deicit reduction and the remainder for infrastructure and social assistance.
19 The change increased the underlying growth rate from 6.2% to 6.3%, which was suf-icient to lower the projected deicit from 2.5% to 2.4%.
20 The international oil price is currently around $100 a barrel (Brent Crude is near $103 a barrel; West Texas Intermediate is around $95 a barrel).
21 An unspeciied increase in the domestic fuel price had already been incorporated into the original budget.
month), to protect them against the impact of the fuel-price rise. Unconditional cash transfers to Indonesia’s poor have been broadly successful on two previous occasions (see below), although recent analysis suggests that transfer programs still have shortcomings that need to be addressed (Sumarto 2013). In addition, the revised budget includes a temporary increase of 15 kilograms per month, for three months, in the allocation of subsidised rice to poor households; an increase in the scholarship program for the poor; and increased allocations for basic com-munity-level infrastructure, such as irrigation and water supply.
Inlation and monetary policy Inlation
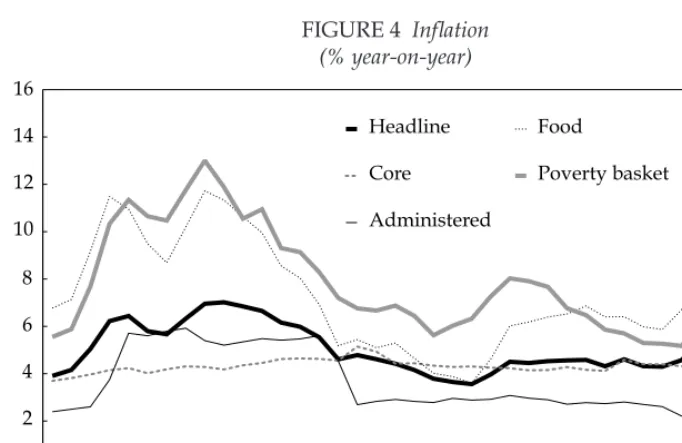
was expected to accelerate in the irst quarter, and it did, followed by
welcome declines in the consumer price index (CPI) in April and May 2013 (igure 4). The inlation rate (the year-on-year growth in the CPI) was 5.9% in March, up from 4.3% in December, but it then slipped to 5.6% in April and to 5.5% in May. The food-price index – particularly the prices of beef and horticultural products – and the loods in January were the key drivers of inlation in the last few months, but their effect was temporary.
April and May 2013 saw the food-price index decline (by 0.8% month-on-month in April and again by 0.8% in May), when the government eased some of its restrictions on horticultural imports. The government also eased restrictions on imports of meat products, which is expected to boost supplies ahead of the Idul Fitri holiday (8 August) and the accompanying rise in demand for food, espe-cially meat (see below). The poor were disproportionately affected by the rise in food prices, as indicated by the trajectory of poverty-basket inlation, but this too subsided in April and May (igure 4).22 There is little evidence, however, that the
large increases in minimum wages earlier in the year contributed signiicantly to higher inlation in the irst quarter, in part because the minimum wage cov-ers only those workcov-ers in the formal sector, where wages earned by low-income workers account for a modest share of total costs (Schmitt 2013; Cornwell and Anas 2013).
The only CPI component that climbed in May was administrative prices, largely on account of a scheduled increase in the electricity tariff (further increases will be implemented in three-month phases throughout the year). The increase in fuel prices will impose further cost-push pressures on inlation. By one estimate, every increase of Rp 500 a litre in the fuel price can add almost one percentage point to the rate of inlation for 2013 (Jakarta Post, 2/5/2013). By this metric, an across-the-board increase in the fuel price of Rp 1,500 per litre could add an upper bound of three percentage points to the rate of inlation, pushing inlation to above 8% year-on-year by the last quarter of 2013 and bringing average inlation for the year close to the budget assumption of 7.2%.
While inlation in consumer prices has remained moderate, some asset prices climbed steeply in the irst quarter of 2013. For example, Indonesia’s index of resi-dential property prices (which covers 14 major cities) climbed by 7.4% in the irst quarter of 2013 – the highest year-on-year price increase since BI began publishing
22 Poverty-basket inlation is the change in the weighted price index of items in the con -sumption basket of poor households. The author is grateful to the World Bank ofice in Jakarta for making this series available for this survey.
FIGURE 4 Inlation (% year-on-year)
Source: CEIC Asia Database; BPS; World Bank.
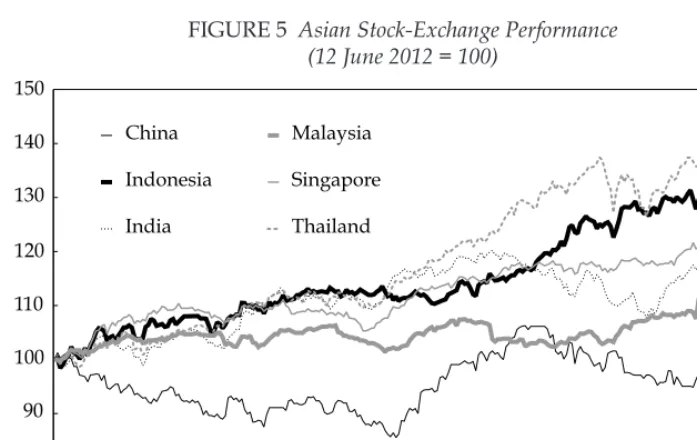
the index, in 2008 (Global Property Guide, 29/5/2013). In the fourth quarter of 2012, residential property sales in Indonesia increased by 26.7% quarter-on-quarter, with sales of small houses growing the fastest (by about 41%). More broadly, Indo-nesia’s stock market has been among Asia’s better performers over the past year (igure 5), with the property and trade sectors doing particularly well. The IDX index reached a new peak of 5,215 on 20 May, two days before US Federal Reserve chairman Bernanke’s statement on tapering the quantitative easing program. It has since declined by more than 11.5%.23 Virtually all sectors experienced a
sell-off, except for agriculture and mining, which had already been in secular decline. The ixed-income securities market was similarly affected. It had beneited from portfolio capital inlows in the irst quarter, which kept yields low and allowed the government to issue signiicant amounts of long-tenor notes at attrac-tive prices. But recent capital outlows have raised and lattened yield curves. For example, in the short period since 22 May, when the turmoil began, one- and two-year local-currency government bond yields have increased by 98 and 105 basis points, respectively, while ten-year bond yields have increased by 53 basis points (ADB 2013).
Higher interest rates will inevitably dampen growth in bank lending, which was already slowing in April. While the current volatility may prove to be tempo-rary and Indonesian interest rates may soon stabilise, the source of the uncertainty – the tapering and eventual reversal of extraordinary credit-expansion measures in the US, the EU and Japan – will affect global capital markets for months, if not years. Historically, heightened uncertainty in global capital markets has tended to have an exaggerated effect on Indonesia’s relatively thin but very open capital market, because capital lows in Indonesia are relatively large in relation to the
23 As of 13 June 2013.
size
of its inancial markets, and this is unlikely to change soon (Balakrishnan et al. 2012: 12). For the foreseeable future, then, Indonesia can expect to experience signiicant turbulence in the capital account of the balance of payments and in its capital market, which will further dampen short-term growth prospects.
RECENT TRADE MEASURES AND PROPOSED LAWS ON TRADE AND INDUSTRY
Contributing to some of the market uncertainty in recent months has been the introduction of several trade restrictions, as well as the submission of a new trade law and a related industry law to parliament for consideration and approval. This section examines the rationale and implications of these measures and describes the content of the two draft laws.
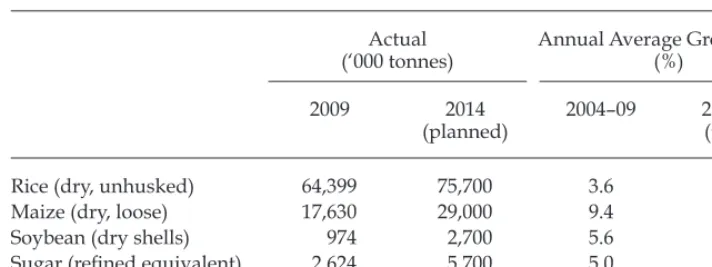
Since 2010, the government has gradually reintroduced import quotas on a range of agricultural products (Burke and Resosudarmo 2012). Several reasons underpin this important policy development. Among these is the Ministry of Agriculture’s strategic ive-year blueprint for 2010–14, in which the government identiied production targets for 39 commodities. For ive of these – rice, sugar, soybeans, beef and corn – the production targets were set with the intention of achieving self-suficiency by 2014, the last year in the current ive-year national development plan (table 4). Apart from those for rice and perhaps maize, the implied growth targets were ambitious in relation to actual growth performance over the previous plan period (2004–09), and to reach them would have implicitly required more than just productivity-enhancing measures.
A second reason, which applies to horticultural products, stemmed from the reduction in import tariffs required by Indonesia’s various multilateral and regional free-trade agreements. Since 2003, Indonesia has been required to lower most-favoured-nation tariff rates for selected horticultural products (for example,
FIGURE 5 Asian Stock-Exchange Performance (12 June 2012 = 100)
Source: Thomson Reuters Datastream.
shallots, oranges, mangoes and carrots) under its multilateral and regional trading agreements. And with the commencement of the Common Effective Preferential Tariff program (in 2010) under the ASEAN Free Trade Area, and the coming into force of the China–ASEAN Free Trade Area (on 1 January 2010), the tariffs on all horticultural products were reduced to zero (Marks 2012).
These tariff reductions, combined with growing consumption by a rapidly expanding middle class, caused imports of horticultural products to soar, which led to farmers demanding import controls and prompting the Ministry of Agricul-ture and the Ministry of Trade to introduce import restrictions in phases (CAEXPO, 30/1/2013). The irst of these, in March 2012, restricted the handling of all horti -cultural imports to Indonesia from seven ports of entry to four, which forced virtu-ally all of Java’s horticultural trade through Surabaya.24 The US objected strongly,
and in June 2012 the Indonesian authorities relented, applying the restriction only to countries without a ‘mutual-recognition agreement’ with Indonesia. This effec-tively meant that the restriction now excluded imports from the US, Canada, Aus-tralia and New Zealand, and effectively targeting those from China.25
To conform with international trade agreements, Indonesian authorities have used licensing as their preferred instrument for curtailing imports. Since 2002, importers of rice, sugar and soybeans have been required to possess a special importer identiication number in addition to the general importer identiica-tion number required of all importers.26 In October 2008, the Ministry of Trade
24 Minister of Agriculture Regulation 89/Permentan/OT.140/12/2011 permitted only Belawan, Tanjung Perak, Makassar and Jakarta’s Soekarno–Hatta Airport as the four ports of entry.
25 Mutual-recognition agreements lay down the conditions under which countries accept each other’s test reports, certiicates and marks of conformity. They include lists of des -ignated laboratories, inspection bodies and conformity-assessment bodies in the partner countries.
26 Enterprises using raw sugar as an input (such as beverage manufacturers or sugar re-iners) also need to be licensed as sugar importers and are not allowed to sell their sugar to a third party.
TABLE 4 Self-Suficiency Targets for Five Key Commodities
Actual (‘000 tonnes)
Annual Average Growth Rate (%)
2009 2014
(planned)
2004–09 2010–14 (target)
Rice (dry, unhusked) 64,399 75,700 3.6 3.3
Maize (dry, loose) 17,630 29,000 9.4 10.5
Soybean (dry shells) 974 2,700 5.6 22.6
Sugar (reined equivalent) 2,624 5,700 5.0 16.8
Beef (carcass weight) 408 550 –1.9 6.2
Source: Author’s calculations based on data from the Ministry of Agriculture and the OECD.
imposed further licensing requirements for importers of 505 products,27
includ-ing meats, chocolate, cocoa and foods prepared from cereal. In September 2011, the government extended these requirements for all types of meat (fresh, chilled and frozen), dairy products and eggs (Minister of Trade Regulation 24/M-DAG/ PER/9/2011). And then, in 2012, the Ministry of Trade regulated that it would issue licences only to importers of horticultural products that had earlier been recommended by the Ministry of Agriculture (Minister of Agriculture Regula-tion 03/Permentan/OT.140/1/2012; Minister of Trade RegulaRegula-tion 30/M-DAG/ PER/5/2012). In an interesting development, the two regional governments of Brebes district and East Java province also issued regulations requiring their per-mission for imports to enter their jurisdictions (which violated the 2007 national regulation that stipulates that import policy is the prerogative of the central gov-ernment alone) (Marks 2012).
The new licensing system and port-entry restrictions had an immediate impact on the import volumes and domestic prices of horticultural imports. Prices soared initially, between January and March 2013 (shallots, for example, climbed from $1.20 a kilogram to $7 in March alone) (Citra Indonesia, 11/2/2013), but they appear to have declined in April and May, as some of these restrictions were eased (see below). While increases in the price of horticultural products nega-tively affected real incomes, especially those of the poor, there is little evidence that they improved the terms of trade for farmers or increased rural real wages.28
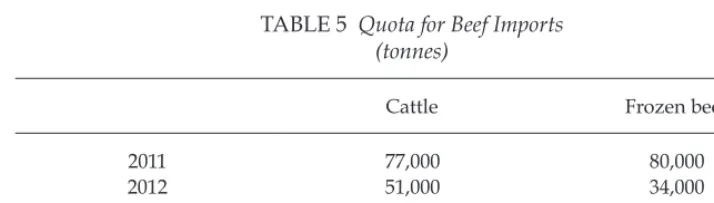
In the case of beef, the government’s lower quota for live cattle and frozen beef between 2011 and 2013 (table 5) caused a severe shortage in the domestic market, triggering
a sharp increase in prices (igure 6).
Indonesia’s import restrictions also attracted the ire of its leading trade partners. In its April 2013 meeting to discuss the sixth trade-policy review of Indonesia, the WTO raised concerns about the lack of transparency and consultation in intro-ducing these recent restrictive trade measures (Jakarta Post, 15/4/2013). One ambassador to the WTO considered the measures to be motivated by ‘economic nationalism and protectionism’ (Punke 2013). In addition, the US instituted a complaint at the WTO, alleging that Indonesia’s application of trade-restrictive
27 At the 10-digit harmonised tariff codes.
28 Between January and May 2013, farmers’ terms of trade declined on average, falling in 19 provinces (including Central, West and East Java) and climbing in 13. The real wage of farmworkers declined over the period. See <http://www.bps.go.id/eng/tab_sub/view. php?kat=2&tabel=1&daftar=1&id_subyek=22¬ab=1>.
TABLE 5 Quota for Beef Imports (tonnes)
Cattle Frozen beef
2011 77,000 80,000
2012 51,000 34,000
2013 48,000 32,000
Source: Ministry of Trade.
measures on horticultural products, live animals and animal products created an import licensing system that, together with quotas, unfairly restricts US exports and protects Indonesia’s agricultural sector. The WTO has established a panel to hear the complaint.29
Such criticisms were unfortunately levelled at the time when Mari Pangestu, Indonesia’s Minister of Tourism and Creative Economy, launched her (eventually unsuccessful) bid to become the Director-General of the WTO. They also came on the eve of Indonesia’s hosting of a series of meetings of regional and global organisations committed to promoting free trade, including the APEC Trade Min-isters’ Meeting (held in Surabaya on 20–21 April); the APEC Summit Conference, scheduled for October; and the WTO Ministerial Conference, in Bali, scheduled for December.
As a result of complaints from trading partners, and partly also because rising prices in domestic markets led to criticisms of the policy in the media, the Indonesian authorities rolled back several of their licensing requirements and raised quotas for the affected products. On 24 April, the Ministry of Trade issued a new regulation (13/M-DAG/PER/4/2013) easing import restrictions and simplifying procedures for 39 of 57 horticultural items on the original list (Ministry of Trade, press release, 24/4/2013). In early June, the government appointed the national food logistics
29 The claim is that the measures are inconsistent with the WTO’s articles X:3(a) and XI:1 of the General Agreement on Tariffs and Trade 1994; art. 4.2 of the Agreement on Agricul-ture; and articles 1.2, 3.2 and 3.3 of the Import Licensing Agreement. On 24 January 2013, Australia, Canada and the EU requested to join the consultations, and Indonesia granted their request. See <http://www.wto.org/english/tratop_e/dispu_e/cases_e/ds455_e. htm>.
FIGURE 6 Inlation in Beef Prices (% year-on-year)
Source: BPS.
Note: CPI = consumer price index.
agency (Bulog) to import additional beef outside of the established quotas, to help stabilise prices ahead of Idul Fitri (Jakarta Post, 4/6/2013).
The government has also drafted two laws, years in the making, on trade and industry. Parliament’s Commission VI, chaired by Airlangga Hartarto, is review-ing
both laws together, to identify potential conlicts or inconsistencies. The Commission is holding public hearings on the two laws to hear the views of, among others, businesses, economists, academics, NGOs, and trade and indus-try associations. The draft trade law is meant to modernise Indonesian trade law by replacing the 1933 Crisis Import Ordinance, which still governs Indonesian trade, together with accompanying regulations that have accumulated since then.30 Similarly, like many other countries, Indonesia has never had an
indus-try law that concentrated into one legal instrument all items of legislation rel-evant to industrial policy; but, according to a member of the drafting team, one is now needed to ensure that innovation and increased productivity growth drive Indonesian industry in the future.31 Once approved, these laws could potentially
increase incentives for both producers and consumers, so they deserve debate and scrutiny. Although the drafts will no doubt be amended as they wend their way through the parliamentary process, their content provides a useful glimpse into the Yudhoyono administration’s thinking on trade and industrial policy.
The founding principles of the draft trade law are laudable – fairness, legal certainty, simplicity, transparency and accountability – and it aims to support growth, employment, competitiveness, creativity and the ‘image’ of Indonesia (art. 2(2)(h)).But compared with trade laws of other countries, it is broad in cover-age and short on details, spanning domestic and international trade; export devel-opment; trade promotion; standards; anti-dumping and countervailing duties; consumer protection; subsidies; safeguards; international trade cooperation; microenterprises and SMEs; and electronic trading (art. 3).32 The law gives the
Minister of Trade the authority to take necessary measures to, among others, ‘pro-mote domestic industry’ and ‘protect the balance of payments’. It also allows the minister to act in ‘instances when an increase in imported products hurt domestic producers or when imported goods are priced lower than their “normal value”, causing losses – or threat of losses – to related domestic industries’.33
30 For more on the 1933 Crisis Import Ordinance and the 1934 Industry Regulation Ordi-nance that followed it, see Van der Eng (2007).
31 This explanation was provided by Dradjad Irianto, an academic from the Manufacturing Research Group at the Bandung Institute of Technology and a member of the industry-law drafting team, at a public hearing at the European Chamber of Commerce on 18 April 2013. 32 Other trade laws that could be used for comparison include India’s Foreign Trade (De-velopment and Regulation) Act 1992; Japan’s Foreign Exchange and Foreign Trade Act 228/1949; Canada’s Export and Import Permits Act 1985 (last amended on 1 April 2013); Singapore’s Regulation of Imports and Exports Act 1995 (revised in 1996); and Jordan’s Industry and Trade Law 18/1998.
33 These measures are described in different parts of the draft law – including articles 6(4), 32(2) and 32(3), and chapter IX, ‘Protection and security of trade’, articles 51(1) and 51(2). Details of the ‘necessary measures’ that the government can take are to be issued in related government regulation. The term ‘normal value’ is not deined further in the law, and there is no indication in the law if this will be elaborated in government regulations. Most im-portant, the law does not indicate that such protective measures should be WTO-compliant.
The draft trade law is silent on two key points. First, it touches on issues that are relevant to, or part of, at least 29 other laws; but none is mentioned in the draft trade
law. It is also not clear how conlicts between them and the new trade law will be resolved, or which agencies will be responsible for implementing its differ-ent aspects (Lasminingsih 2013).34 Indeed, most trade laws in other countries tend
to focus on the legal dimensions of trade transactions, with other issues (such as subsidies, the development of SMEs and so on) invariably addressed by other laws and policy instruments.35 Second, it is silent on how the law’s requirements
will be affected by Indonesia’s many international commitments, including under the WTO as well as the ASEAN Free Trade Area and the ive ASEAN free-trade agreements that cover most of Indonesia’s trade.36 To be sure, the section on
inter-national trade cooperation provides the government with authority to establish trade relations, but it does not indicate how these agreements would circumscribe other parts of the law.
The draft industry law is less wide-ranging in its coverage.37 It espouses
equal-ity, eficiency, sustainabilequal-ity, environmental protection, promotion of the national interest, and business certainty (art. 2). The policy instruments it proposes include fair competition and control of ownership concentration inimical to the public interest (art. 3). The draft law also seeks to promote green industry, industrial standards, industrial development zones, SMEs, the creation of a inancing insti-tution for industrial development, and the need for better data from industrial irms (chapters III–IV).
The law proposes to give the government (central and regional) and the Minis-ter of Industry new and wide-ranging powers. Some are intended to develop the country’s industrial capability by giving Indonesian nationals and Indonesian-owned businesses preference over foreign enterprises (whether based locally or abroad). These include giving domestic irms ‘priority access to natural resources’ (art. 16); reserving ownership of small-scale industries for Indonesian citizens only (art. 71); and ensuring that government resources (both from the budget and from state enterprises, and including both loans and grants) are used to procure products from domestic irms (art. 57). Other proposed measures in the draft industry law give the government greater authority to intervene in private-sector
34 These include laws covering SMEs, the environment, consumer protection and food. 35 For example, subsidies are usually addressed by sectoral laws or in the budget; consumer protection is normally dealt with under separate legislation that covers all prod-ucts (domestic and imported); and the development of SMEs may not require a law at all. 36 The draft trade law does mention ‘international commitments’ but only in support of provisions that provide the government with the authority to prohibit or restrict the trade of goods and services – for example, art. 6(4)(g). Compare this with Canada’s Export and Import Permits Act 1985 (articles 3 to 6), which deines Canada’s obligations towards the WTO, the North American Free Trade Agreement and its other bilateral trade partners with which it has a trade agreement.
37 While many countries have industry policies, very few have separate industry laws, so comparisons to Indonesia’s draft industry law are dificult to make. For example, in most countries, legislation on labour, the environment, anti-monopoly restrictions or competi-tion promocompeti-tion is not usually restricted to industry but applies economy-wide.
decisions, such as the authority to arrange the selection, procurement and use of industrial technology (art. 25), and to control ‘strategic industries’ (art. 56).38
The draft industry law also echoes features that appear in the draft trade law – such as protecting domestic industry from the threat of global competition by using, among other measures, tariffs and quotas – but this time the power to rec-ommend such measures lies with the Minister of Industry (articles 66–8).And, as is the case with the draft trade law, the draft industry law is silent on its consist-ency with other laws that impinge upon industry (such as laws on trade, the envi-ronment and labour, among others); the leading role of the private sector and the importance of a legal and regulatory environment conducive to private invest-ment; and coordination within government.39
Both draft laws are still in the early stages of discussion in parliament and are unlikely to be approved before the 2014 elections. As they stand, the laws are vague and expansive. They could potentially be used to justify government interventions to restrict trade or investment in virtually any situation, at the expense of rapid, inclusive and sustainable long-term growth. Moreover, given that they overlap with other domestic laws and internationally binding trade commitments
, they will be dificult to implement and could cause uncertainty
for investors. As the drafts are revised, the challenge will be to ensure that the inal drafts fully support Indonesia’s international obligations and commitments; facilitate international trade as well as import and domestic competition; avoid investor uncertainty; and indicate how coordination among government agencies and ministries will ensure coherent and consistent implementation of trade and industrial policies.
SOCIAL-ASSISTANCE PROGRAMS: PERFORMANCE AND CHALLENGES
The impending increase in the fuel price and its consequences on the poor make this an opportune time to re-examine Indonesia’s social-assistance programs and how they can best be improved. The impact of growth on poverty reduction has weakened in the last decade, as income and expenditure inequality has increased (Nugraha and Lewis 2013: 104). A signiicant portion of Indonesia’s growth has accrued to the higher deciles in the income distribution, while those at the lower end have seen their share fall.40 For example, some measures suggest that real
wages of farmworkers might have stagnated, or even declined, since July 2009, although the evidence is not conclusive. Similarly, the formal sector in mining,
38 ‘Strategic industries’ are deined as those that meet people’s basic needs, develop stra -tegic natural resources, relate to defence and security, and employ workers who have mas-tered advanced technologies.
39 For example, the medical-devices industry is currently regulated by the Ministry of Health, under the Health Law, and BPOM (Indonesia’s food and drug agency). The draft industry law states, however, that all industries will now be regulated by the Ministry of Industry; but the relevant provisions of the Health Law have not been rescinded, thus po-tentially creating uncertainty for irms in the industry and making it dificult for them to comply with both laws (Chen 2013).
40 Susenas, Indonesia’s household consumption survey, shows that during 2003–07 the bottom 40% of the income distribution saw their consumption grow by 0.6% a year, where-as average household consumption grew by 2.8% a year.
manufacturing and high-end services, which accounts for the bulk of high-paying jobs
in Indonesia’s economy, has not generated suficient jobs to make a dent in surplus labour, and this in turn has slowed the decline in the number of Indone-sia’s poor and near poor (Nehru 2013).
Social-assistance programs in Indonesia are a relatively recent phenomenon. Apart from the obvious political advantage they offer incumbent governments, they usually serve four economic objectives: they help transfer resources to the poor; prevent the impact of economic shocks on the poor and near poor from becoming irreversible;41 provide the poor with access to critical health and
educa-tion services; and add to the arsenal of existing redistributive measures, such as budgetary allocations. Social-assistance programs should also be considered as complementary to other social development policies, including social insurance, labour-market regulations, community empowerment, SME development and the delivery of public services to the poor.42
In Indonesia, social-assistance programs were initially introduced in the imme-diate aftermath of the Asian inancial crisis to protect the poor and near poor from a sudden decline in incomes and employment, and they have since become a ixture in the policy landscape. Today, Indonesia has at least eight major central-government-inanced social-assistance programs:
• Raskin (Beras Untuk Rakyat Miskin) – aims to distribute 15 kilograms of subsidised rice per month to each of 17.5 million poor and near-poor households;43
• Jamkesmas (Jaminan Kesehatan Masyarakat) – waives health-service fees for about 18.2 million poor and near-poor households;
• BSM (Bantuan Siswa Miskin)– transfers cash to 4.6 million students from poor households, to enable them to attend school;
• PKH (Program Keluarga Harapan) – transfers cash to 0.8 million very poor households, on condition that they participate in locally provided health and education programs;
• BLT (Bantuan Langsung Tunai) – transfers cash, unconditionally, to large numbers of poor and near-poor households to combat the threat of economy-wide macroeconomic shocks (used only twice so far); and
• three other very small, specialised programs to protect children at risk, the disabled and the elderly.44
41 When sudden income declines and the absence of a social safety net causes house-holds to withdraw children from school or provide them with inadequate nutrition, any impact on a child’s performance can become permanent.
42 Social-assistance expenditures differ from social-insurance programs, as well as from general health and education programs, because they have the twin features of being non-contributory and designed to beneit the poor.
43 Kilogram limits on subsidised rice per household have varied over the years, from 20 kilograms in 2005 to 10 kilograms in 2007; since 2010, it has been 15 kilograms. In the recent-ly approved revised budget, poor households will receive an additional 15 kilograms each month for three months, as part of the compensation package for the fuel-price increase. 44 These specialised programs are, respectively, PKSA (Program Kesejahteraan Sosial Anak), JSPACA (Jaminan Sosial Penyandang Cacat Berat) and JSLU (Jaminan Sosial Lanjut Usia). Given their relatively small size and highly specialised objectives, they are not considered in this survey.