Full Terms & Conditions of access and use can be found at
http://www.tandfonline.com/action/journalInformation?journalCode=vjeb20
Download by: [Universitas Maritim Raja Ali Haji], [UNIVERSITAS MARITIM RAJA ALI HAJI
TANJUNGPINANG, KEPULAUAN RIAU] Date: 13 January 2016, At: 17:27
Journal of Education for Business
ISSN: 0883-2323 (Print) 1940-3356 (Online) Journal homepage: http://www.tandfonline.com/loi/vjeb20
Aging and Employment: Characteristics of Those
Working and Retired in California
Shari McMahan & Kimari Phillips
To cite this article: Shari McMahan & Kimari Phillips (2000) Aging and Employment:
Characteristics of Those Working and Retired in California, Journal of Education for Business, 76:1, 11-14, DOI: 10.1080/08832320009599043
To link to this article: http://dx.doi.org/10.1080/08832320009599043
Published online: 31 Mar 2010.
Submit your article to this journal
Article views: 103
View related articles
Aging and Employment:
Characteristics of Those Working
and Retired in California
SHAM MCMAHAN
zyxwvutsrqponmlkjihgfedcbaZYXWVUTSRQPONMLKJIHGFEDCBA
California State University, Fullerton
Fullerton, California
KlMARl PHILLIPS
University of California, Irvine
Irvine, California
he United States and other indus-
T
trialized nations are experiencing a demographic shift toward an aging workforce. By the year 2000, it is pre- dicted, the median age of a worker in the U.S. workforce will be 40 years, the age at which a person under the Age Discrimination and Employment Act (ADEA) is considered an older worker.In the next
zyxwvutsrqponmlkjihgfedcbaZYXWVUTSRQPONMLKJIHGFEDCBA
3 decades, at least one quar-ter of the U.S. population will be over 55 years of age. In the year 2000, almost 11% will be over age 55. In contrast, the number of younger adults aged 16-24 will drop by 8% (Mital, 1994). Not only is the workplace aging, but Americans are retiring at earlier ages and living longer (Gendell, 1998). This increasing duration of retirement resulting from earlier exit from the labor force and longer life exacerbates Social-Securi- ty-related dependency burdens and health care-related concerns, and raises issues regarding the acceptability and potentiality of labor force participation among later-life American adults.
Current theory of aging and work rec- ognizes that the relationship between aging and workforce participation is complex (Schooler, 1999). Several key individual and social contextual factors are thought to be responsible for shap- ing workers’ decisions regarding exit from the labor force. These factors include eligibility for pensionshinancia1
ABSTRACT. Little is known about the aging worker’s psychological, social, and physiological characteris-
tics. In this study,
zyxwvutsrqponmlkjihgfedcbaZYXWVUTSRQPONMLKJIHGFEDCBA
447 individuals (working and retired) aged 50 andover completed the California Work and Health survey. Most of the work-
ing respondents
zyxwvutsrqponmlkjihgfedcbaZYXWVUTSRQPONMLKJIHGFEDCBA
(nzyxwvutsrqponmlkjihgfedcbaZYXWVUTSRQPONMLKJIHGFEDCBA
= 150) were employed full-time and worked ineducation, health care, government, and retail trade. Those working report- ed being in greater health, being less depressed, and having more energy and activities than those retired. There was no difference between those working and retired in social and psy- chological characteristics such as number of friendships and ability to control important things in life and overcome difficulties. Educating man- agers and business professionals about these characteristics is essential given anticipated social security system changes in the future.
status, health, social support, health of spouse, attitudes to retirement, and edu- cation (Anderson & Armstead, 1995; Berkman, 1995; Gruber & Madrian, 1995; Quinn, Burkhauser, & Myers, 1990), though which factors are the most salient is unclear.
Research examining samples of employed adults over 50 is relatively scarce, with even less research compar- ing characteristics between those still working and those retired (Schooler, Caplan, & Oates, 1998). A first step in developing interventions that promote
continued labor force participation into later life and protect the well-being of older workers is to better characterize populations of older working and retired adults (Hoyer, 1998). The California Work and Health Survey provides an opportunity to evaluate labor-force and retirement issues in a random sample of working and nonworking adults in Cali- fornia households.
Method
The California Work and Health Sur- vey is a telephone-based longitudinal survey of California adults, designed by faculty and staff of the Work and Health Program at the University of California, San Francisco, with input from researchers and practitioners in the fields of health and economics. It is con- ducted by the Field Institute and funded by the California Wellness Foundation. The original survey was administered between 10 June and 21 July 1998 to 1,771 adults (aged 18 years or older) living in California. Of the 1,771 respondents, 1,500 were obtained through random-digit dialing. Up to six attempts were made to contact an adult member of the household. If more than one adult was available, the interviewer requested the youngest adult male; if there were no men at home, the oldest
female was asked to participate. This
zyxwvutsrqponmlkjihgfedcbaZYXWVUTSRQPONMLKJIHGFEDCBA
strategy is one that has been developed by the major public opinion research firms to balance participation in phone surveys. One-hundred fifty working, and 297 retired, individuals aged 50 and
over responded to the survey.
zyxwvutsrqponmlkjihgfedcbaZYXWVUTSRQPONMLKJIHGFEDCBA
Results
zyxwvutsrqponmlkjihgfedcbaZYXWVUTSRQPONMLKJIHGFEDCBA
Demographics of Workers Aged 50 and Over
The working respondents completing the interview included 150 individuals 50 or more years old (Table 1). Fifty- four percent (80) of these were male. Respondents in this age category were between 50 to 81 years old, with an average age of 57. Most (77%) were employed full time (over 35 hours per week), with the rest reporting part-time work. Almost half of respondents in this age category had a college degree or greater, about a third had some college or vocational school training, and most of the remainder had completed high school only. Slightly over half were cur-
rently married. Eighty-one percent were White, 4.4% Black, 5.4% Asian, and
10% were “other.”
Nineteen percent of the respondents reported a total household income of greater than $80,000, and 35% reported one under $40,000 (17 respondents did not answer this question). Eighty-six percent (130) of the respondents felt that it was not at all difficult or some- what difficult to live off of their house-
hold income currently.
zyxwvutsrqponmlkjihgfedcbaZYXWVUTSRQPONMLKJIHGFEDCBA
In fact, 8% (12)reported it likely that they would expe- rience hardship in the next 2 months.
Most of the respondents (77%) worked for someone else, whereas 22% were self-employed. Age was demon- strated to correlate strongly with self-
employment ( r =
zyxwvutsrqponmlkjihgfedcbaZYXWVUTSRQPONMLKJIHGFEDCBA
.24, pzyxwvutsrqponmlkjihgfedcbaZYXWVUTSRQPONMLKJIHGFEDCBA
c .Ol). Aboutone half of the respondents worked in the fields of education (14%), health care (14%), government (9%), and retail trade (11%). The majority of other respondents worked in various profes- sions such as banking, business services, communications, insurance, transporta- tion, and manufacturing. Their job activ-
TABLE 1. Demographics of Working Respondents Aged 50 Years and
Over
zyxwvutsrqponmlkjihgfedcbaZYXWVUTSRQPONMLKJIHGFEDCBA
( N = 150)Characteristic No. %
Gender Male Female Work status
Full time (> 35 hrs./wk)
zyxwvutsrqponmlkjihgfedcbaZYXWVUTSRQPONMLKJIHGFEDCBA
Part time
Less than a high school degree High school graduate
Some college or vocational school College degree or more
Marital status Married
Separateddivorced Widowed Never married Unmarried Ethnicity
White Black Asian Other
< $40,000 $40,000-80,000
> $80,000
Missing Education
Annual household income
80 70
115 35
6 22 49 73
76 40 11 20 3
122 7 8 13
53 52 28 17
54 46
77 23
4 15 33 48
5 1
26 7 13
3
81.0 4
5
10
35 35 19 11
ities were reflective of the fields they worked in; that is, 16% (24) had man- agerial duties, 16% had administrative support duties, 9% (14) were educators, and 8% (12) were in sales. Most of these individuals had worked an average of
18.5 years in their present occupation, with a few individuals (2%) reporting under 1 year of service and seven indi- viduals (4%) reporting over 40 years. In the past year, 14% (21) of the respon- dents had received a promotion at their job. One hundred sixteen (72%) of the respondents owned a personalhouse- hold computer, which was strongly cor- related with working more hours in the last week ( r = .28, p c .001).
Of the 132 individuals receiving health insurance, over half (79) reported that they received health insurance from their employer. Thirty-eight respon- dents stated that their employer payed for all of their health insurance costs. Another 38 respondents reported partial payment by their employer, and three individuals stated that their employer provided no health insurance. Health care coverage was strongly correlated with household income ( r = .40, p c
.001) and education ( r = .31, p c .001). Individual Health and Lifestyle of Workers Aged 50 and Over
Roughly 70% (107) of the working respondents in this age category stated that their health was excellent or very good. Sixty percent (90) of the respon- dents stated that they had smoked 100 cigarettes in their entire life, but 69% (62) of those individuals did not cur- rently smoke cigarettes. Over half of the respondents (80) had had at least one alcoholic beverage during the past month. Most respondents (78%; 117) reported participating in physical activi- ty such as walking for exercise (34%; 51), or gardening/mowing the lawn (1 1%; 16). Nonparticipation in exercise was correlated with depression ( r = .23,
p c .Ol), feeling helpless ( r = .22, p c
.Ol), and the perception of having more problems than most people ( r = .29, p < .001). Likewise, participation in an exercise program was correlated with perceptions of good to excellent health
( r = .26, p c .001).
Twenty-three percent (31) of the
respondents were diagnosed with hypertension at some point in their life, 26% (39) had back problems, 12% (17) cancer, 8% (11) diabetes, 9% (13) asth- ma, 7% (10) ulcers, and 7% (10) heart trouble. Thirty-nine percent (59) had experienced pain, aching, swelling, and stiffness around the joints in the past 12 months. Nine percent (14) of those indi- viduals with pain, aching, and stiffness stated that they were limited in activities because of joint symptoms. Twenty-four percent (35) of the individuals had been diagnosed with arthritis. Most of the individuals (135) reported that they had not stayed in a hospital overnight in the past year. Over half of the individuals (78) reported that their quality of sleep had been very good or excellent; in fact, only 12% reported taking any sleeping medications during the past month. Indeed, quality of sleep correlated with perceptions of being in excellent or
good health ( r
zyxwvutsrqponmlkjihgfedcbaZYXWVUTSRQPONMLKJIHGFEDCBA
=zyxwvutsrqponmlkjihgfedcbaZYXWVUTSRQPONMLKJIHGFEDCBA
.28, pzyxwvutsrqponmlkjihgfedcbaZYXWVUTSRQPONMLKJIHGFEDCBA
c .OOl).With regard to relationships, respon- dents reported an average of seven close friends that they could talk to at any time. Seventy-five percent (1 13) report- ed being very satisfied with these rela- tionships. Satisfaction with friendships and marital status were correlated with perceptions of being in excellent or good health. Respondents reported an average of four close friends at work, and sixty-five percent (97) reported being very satisfied with their relation- ships at work.
The average score for these individu- als on the short Geriatric Depression Scale was 1.5, with a possible range of 1 to 15. With regard to thoughts and feel- ings, most respondents (67%; 101) stat- ed that they almost never felt they were unable to control things in their life.
Respondents who categorized their own health as excellent, very good, or good were compared on a number of categories with individuals reporting fair or poor health. Individuals in good
health were more likely to exercise
(x2
zyxwvutsrqponmlkjihgfedcbaZYXWVUTSRQPONMLKJIHGFEDCBA
=5 .69; p c
zyxwvutsrqponmlkjihgfedcbaZYXWVUTSRQPONMLKJIHGFEDCBA
.05). They also were morelikely not to be diagnosed with high blood pressure
(x2
= 7.58; p c .Ol), heart problems(x2
= 21.65; p c .001), dia-betes
(x2
= 9.74; p c .005), ulcerszyxwvutsrqponmlkjihgfedcbaZYXWVUTSRQPONMLKJIHGFEDCBA
(xz
=8.03; p < .005), or kidney problems
(x2
= 3.66; p c .05). In addition, individuals
in good or excellent health reported hav-
ing one or more close friends
(x2=
11.74; p c .001).Working Versus Retired Respondents 50 Years Old and Over
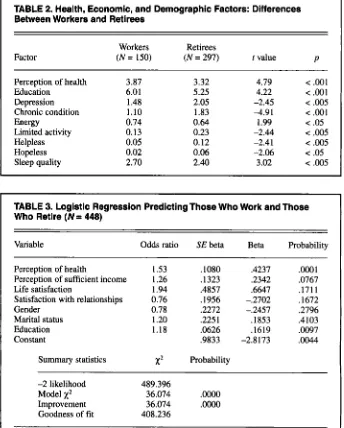
We analyzed several demographic, health, and economic parameters to compare working (n =150) and retired
(n = 297) respondents of 50 years of age and over (see Table 2). Individuals who were classified as working had higher levels of education compared with those who were retired ( t = 4.22; p c .001). Working individuals reported being in better health (t = 4.79; p c .001), being less depressed ( t = -2.45; p c .005), and having more energy ( t = 1.99, p c .05),
fewer chronic conditions (high blood
pressure, heart disease, diabetes, back problems, etc.) ( t = 4 . 9 1 ; p c .001), and fewer limitations in activities ( t = -2.44,
p < .005).
zyxwvutsrqponmlkjihgfedcbaZYXWVUTSRQPONMLKJIHGFEDCBA
Retirees also reported feeling more bored (t = -2.67, p c. Ol), helpless( t = -2.41, p c .005), and hopeless ( t =
-2.06, p c .05). Workers and retirees did
not differ in their number of friendships, ability to control important things in their life, confidence in handling per- sonal problems, ability to overcome dif- ficulties, or use of sleep medication.
We used a logistic regression analysis to determine predictors of those who work and those who are retired (see Table 3). Factors used in the analysis included perceived health, satisfaction with life over the past week, satisfaction
with relationships, and perception of
zyxwvutsrqponmlkjihgfedcbaZYXWVUTSRQPONMLKJIHGFEDCBA
TABLE 2. Health, Economic, and Demographic Factors: Differences
Between Workers and Retirees
zyxwvutsrqponmlkjihgfedcbaZYXWVUTSRQPONMLKJIHGFEDCBA
Factor
Workers Retirees
( N = 150) ( N = 297) t value P Perception of health
Education Depression Chronic condition Energy
Limited activity Helpless Hopeless Sleep quality
3.87 6.01 1.48 1.10 0.74 0.13 0.05 0.02 2.70
3.32 5.25 2.05 1.83 0.64 0.23 0.12 0.06 2.40
4.79 4.22 -2.45 4 . 9 1
1.99 -2.44 -2.41 -2.06 3.02
< .001
< .001
< .005
< .001
< .05
< .005
< .005
< .05
[image:4.612.224.568.290.718.2]< .005
TABLE 3. Logistic Regression Predicting Those Who Work and Those Who Retire ( N
=
448)Variable Odds ratio SE beta Beta Probability
Perception of health
Perception of sufficient income Life satisfaction
Satisfaction with relationships Gender
Marital status Education Constant
1.53 .lo80 1.26 .1323 1.94 .4857 0.76 .1956 0.78 .2272 1.20 .225 1 1.18 .0626 .9833
.4237 .0001 .2342 .0767 .6647 .1711 -.2702 .I672 -.2457 .2796 ,1853 .4103 .1619 ,0097
-2.8173
zyxwvutsrqponmlkjihgfedcbaZYXWVUTSRQPONMLKJIHGFEDCBA
.0044Summary statistics
x2
Probability-2 likelihood 489.396
Model
x2
36.074.moo
Improvement 36.074
.m
Goodness of fit 408.236
Note. Correct dependent variable classification by model is 66.59%.
sufficient income, education, gender, and marital status. Those with good to excellent health were more likely to
work (OR =
zyxwvutsrqponmlkjihgfedcbaZYXWVUTSRQPONMLKJIHGFEDCBA
1.53, pzyxwvutsrqponmlkjihgfedcbaZYXWVUTSRQPONMLKJIHGFEDCBA
.c .0001) and be bet-ter educated
zyxwvutsrqponmlkjihgfedcbaZYXWVUTSRQPONMLKJIHGFEDCBA
(OR = 1.18, p < .01).zyxwvutsrqponmlkjihgfedcbaZYXWVUTSRQPONMLKJIHGFEDCBA
Conclusion
The demographics of older workers in California do not appear to differ sig- nificantly from demographics of their
U.S. counterparts. The majority of
working individuals aged 50 and older are in services and wholesale/resale trade. There are more male individuals employed compared with females, more full-time than part-time workers, and more working typical daytime work schedules. Both this sample and nation- al samples suggest that approximately three quarters of the workers are offered health insurance (Leavitt, 1997; U.S.
Department of Labor, 1999).
In this survey sample, there were twice as many retired as working older adults. In contrast with the workers, retired individuals are less educated, have poorer physical and mental health, and have greater depression. Because this data collection reflects a cross sec- tion of the California population, it is difficult to identify the causal pathways of the worWhealth relationship. Do older people quit work because of their declining health? Or does individual health decrease after retirement? Previ- ous studies do show an association; however, this is an incomplete picture.
As the rates of mortality decline and
longevity increases, will the growing number of older workers be healthier than ever, or are we facing deterioration of health? This issue is of prime impor- tance given the increase in retirement age. If older people are unfit to work, disability claims will certainly increase. However, if health is improving, then the new retirement age should not bring about significant concerns. Future lon- gitudinal studies will need to address this issue.
This survey was limited in types of questions asked about labor force par- ticipation. We could not ascertain
specifically why
zyxwvutsrqponmlkjihgfedcbaZYXWVUTSRQPONMLKJIHGFEDCBA
an individual decidedto remain in or exit from the labor force. However, we do know from previous studies that retirement transitions are complex. Such transitions reflect the physical and cognitive consequences of aging, the person-environment fit of the workplace, and the influence of social and economic institutions with a stake in the process.
Because older workers will constitute an increasing portion of the working population, they should be considered a valuable resource that, if not used effec- tively, might have an adverse effect on our economic competitiveness as a nation. Educating managers and busi- ness professionals about these growing trends is essential to our enhanced well- being as a nation. Exploring labor force transitions is also important given the increasing adult lifespan and anticipat- ed Social Security system changes in the future.
REFERENCES
Anderson, N. B., & Armstead, C. A. (1995). Toward understanding the association of socioeconomic status and health: A new chal- lenge for the biopsychosocial approach. Psy-
chosomatic Medicine, 57, 2 13-225.
B e r h a n , L. F. (1995). The role of social relations in health promotion. Psychosomatic Medicine, Gendell, M. (1998). Trends in retirement age in four countries, 1965-95. Monthly Labor
Review, 121,20-30.
Gruber, J., & Madrian, B. C. (1995). Health-insur- ance availability and the retirement decision.
American Economic Review, 85, 938-948. Hoyer, W. J. (1998). Commentary: The older indi-
vidual in a rapidly changing work context: Developmental and cognitive issues. In K. W.
Schaie & C. Schooler (Eds.), Impact of work
zyxwvutsrqponmlkjihgfedcbaZYXWVUTSRQPONMLKJIHGFEDCBA
onolder adults (pp. 2 8 4 4 ) . New York: Springer Publishing.
Leavitt, T. (1997). Labor force characteristics of older Americans. In W. H. Crown (Ed.), Hand-
book on employment and the elderly (pp. 15-56). Westport, CN: Greenwood Press. Mital, A. (1994). Issues and concerns in accom-
modating the elderly in the workplace. Journal
of Occupational Rehabilitation, 4(4), 253-268. Quinn, J. F., Burkhauser, R. V., & Myers, D.
(1990). Passing the torch: The influence of eco-
nomic incentives on work and retirement. Kala- mazoo, MI: W. E. Upjohn Institute for Employ-
ment Research.
Schooler, C. (1999). The workplace environment: Measurement, psychological effects, and basic issues. In S. L. Friedman & T. D. Wachs (Eds.),
Measuring environment across the life span: Emerging methods and concepts (pp. 229-246). Washington, DC: American Psychological Association.
Schooler, C., Caplan, L., & Oates, G. (1998). Aging and work: An overview. In K. W. Schaie & C. Schooler (Eds.), Impact of work on older
adults (pp. 1-19). New York: Springer Publish- ing.
U. S. Bureau of the Census. (1999). Statistical
abstracts of the United States: 118th ed. Wash- ington, DC: US. Government Printing Office. 57,245-254.