Contents list available at IJRED website
Int. Journal of Renewable Energy Development (IJRED)
Journal homepage: www.ijred.com
Passive Design of Buildings for Extreme Weather Environment
S.N. Al-Zubaidy, S. Tokbolat
*, and R. Tokpatayeva
Nazarbayev University, School of Engineering, 53, Kabanbay Batyr Ave., Astana, 010000, KAZAKHSTAN
Article history:
Received Dec 5, 2012
Received in revised form Dec 18, 2012 Accepted Jan 25, 2013
Available online
ABSTRACT: Buildings account for nearly 40% of the end-use energy consumption and carbon emissions globally. Buildings, once built, are used at least for several decades. The building sector therefore holds a significant responsibility for implementing strategies to increase energy efficiency and reduce carbon emissions and thus contribute to global efforts directed toward mitigating the adverse effects of climate change. The work presented in this paper is a part of continuing efforts to identify, analyze and promote the design of low energy, sustainable buildings with special reference to the Kazakhstan locality. Demonstration of improved environmental conditions and impact on energy savings will be outlined through a case study incorporating a passive design approach and detailed computational fluid dynamics analysis for an existing building complex. The influence of orientation and configuration is discussed with reference to energy efficiency and associated wind comfort and safety. The effect of these aspects on energy consumption and comfortable wind environment has been assessed using CFD analysis and proved to be affective. Single building and multiple building configurations have been analyzed and compared. According to the findings, multiple building configurations have better wind conditions when compared with a single standing building. With respect to orientation the former one should
be modeled with the fully surrounded side of a box opposite to the predominant wind direction
whereas the latter one should be located with the rear side opposite to the wind direction. Thus, results indicated that there is a considerable influence of passive design and orientation on energy efficiency, wind comfort and safety. Careful consideration and application of the findings can potentially lead to considerable decrease of energy consumption and, therefore, allow saving money and the environment at the same time.
Keywords: building orientation, CFD, extreme weather conditions, low energy design, passive design, wind comfort and safety
*Corresponding author: Tel: +7(7172)706146
Email: [email protected]
1. Introduction
The construction sector is one of the major contributors to the processes of climate change (Beatti 2012). Although the built environment represents a
considerable part of a country’s assets, the construction
sector is also one of the main consumers of natural resources with arguably the dominant environmental influence (Holm 2003). It contributes to water and air pollution, produces various types of waste and consumes a vast amount of water and other raw materials (RRCAP 2007). Socio-economic and environmental characteristics of sustainable development are especially important within the
According to Tokbolat 2012, the synergistic integration of inherently low energy building design, intelligent systems and renewable technologies (sustainable) gives rise to a truly energy efficient building. When analyzing or designing low energy buildings, the following aspects are normally examined (Riju 2009):
a. Site layout and orientation: analyzing the site features such as its surrounding land and climate, prevailing winds, solar resource, adjacent buildings and access to infrastructure are all predominant factors which have a direct bearing on the building shape and orientation. In urban environments, adjacent buildings can provide shading from the sun to the advantage or disadvantage of the building. These factors can be utilized, by careful design, for the benefit of the building, in terms of energy consumption (ERI 2004).
b. Building Shape: Optimum shape of a building is one which transmits the least amount of heat from the interior to the outside during the winters and admits the minimum amount of solar radiation during the summers.
c. Building envelope and insulation: the envelope is a highly crucial factor in the design of buildings as it performs several functions of protection from the external environment, noise, pollution and provides comfortable interiors. But most importantly, it determines the rate of flow on energy within the internal and external environment of the building. The efficiency of the envelope has a direct influence on the energy consumption of the building. It could lead to unnecessary over-sizing of the mechanical equipment, if not designed carefully. However, a proper design could help reduce the mechanical load to great extents.
d. Façade: All-glass façade buildings seem to be extremely popular with architects and property developers all over the world. No doubt, its sleek and polished appearance is quite attractive and
greatly enhances the overall aesthetics of the building.
e. Glazing: Designers tend to include large areas of glazed surfaces, in the form of atriums, skylights, all-glass walls and larger windows. Such features can result in intolerable internal conditions, high electricity bills for cooling (Baker & Taleb 2002). In the past, windows were inefficient and hence some restrictions were imposed on the allowable window area. Technological improvements gained in the glazing technology have been wasted on larger window-areas rather than increased efficiency. The three parameters one needs to take care of while choosing window glazing types are the solar heat gain coefficient SHGC, visible transmittance VT and U Value. SHGC is to be kept to a minimum. Other common types of window glazing are reflective-coated, low-e coated, tinted and the double or triple-glazing (Profinanse 2012). f. Daylighting. Shading: shading by means of external or internal devices can be utilized. External shading devices are more effective compared to internal devices such as internal roller blinds, venetian blinds etc. External shading devices may be in the form of overhangs, louvers, vertical blinds and the more complex ones will be operable which is more preferred (Smith et al. 2010).
g. Natural Ventilation: Incorporating natural
ventilation into today’s air conditioned commercial
buildings is not straightforward. In an extreme climate it is normally difficult to integrate natural ventilation. Mixed mode ventilation, if at all, is only possible during the four winter months (Bia 2010).
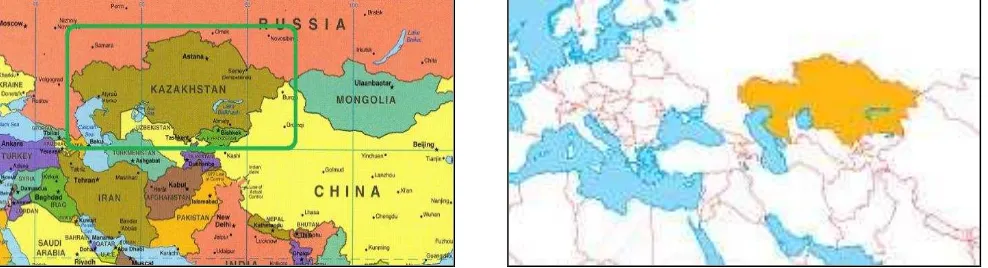
Kazakhstan is a rapidly emerging Central Asian country with a vast territory (the 9th largest in the
world) and rich supply of open mineral and fossil fuel resources (Fig. 1). The increase of GDP of the country during the last decade of more than ten percent per annum has been caused essentially by the increased exportation of oil, gas and other raw materials. This has considerably upgraded the general socio-economic condition of the country’s population UN 2008).
Kazakhstan’s current rapid progress has triggered
flourishing of the construction sector. According to Pmrpublications 2008, the rate of construction productivity in Kazakhstan has increased by approximately eight times during the last ten years. A major proportion of this output is relevant to the housing construction. This is most likely due to the various governmental projects that have been undertaken with the aim of increasing the average provision of accommodation and, consequently, decreasing the considerable housing scarcity. The housing deficit in Kazakhstan is currently 100 million square meters (Today.kz 2012).
According to Yearbook 2007, the rate of investing financial resources into the housing sector in Kazakhstan increased by sixty percent in 2007 alone. Future plans are seen as more ambitious. For instance, the country plans to build nearly 6 million square meters of housing per year, improving the living conditions of nearly 350,000 families. These plans will be supported by annual financial investments with nearly 140 million USD per year (Kazrealty 2012). If all these houses are built according to low energy design principles then energy consumption of thousands of houses would considerably decrease and, therefore, save money and the environment at the same time (Tokbolat 2012).
Taking into consideration the above mentioned facts the aim of this paper is to analyze a typical set of buildings in Astana, the capital of Kazakhstan. This permits calculation of the average energy consumption in a standard building, and by modifying its key features will be able to evaluate to what extent these modifications could reduce overall energy consumption. Observations have shown that the most common type of new building in Astana is a nine-story building made of ceramic bricks (Krn.kz 2012). In order to analyze the energy saving potential of such buildings it has been decided to choose a complex that will include at least a dozen typical nine-story buildings. As a result, three identical residential complexes called micro districts Dostar-1, Dostar-2, Dostar-3 have been chosen (Bi-group.kz 2012).
Modeling and analysis of flow conditions around buildings with different configurations have been carried out by means of a specialized computational fluid dynamics (CFD) analysis tool. This analysis tool is used to calculate the distribution of temperature, velocity, pressure and other properties of fluids, in other words, to provide data on temperature and airflow distribution in and around considered buildings. It should be mentioned here that the scope of the paper does not permit examining the effect of all design variables, therefore, emphasis will be placed on
buildings’ orientation and configurations. The influence
of orientation and building design and proximity will also be assessed with reference to possible energy efficiency and associated environmental conditions
including wind comfort and safety. It is recommended for the further studies to take into consideration the financial aspects of the energy efficiency measures. This is also relevant to the financial equivalents of the saved energy due to incorporation of the mentioned low energy design aspects.
2. Approach
)n order to achieve the project’s objectives which are
to evaluate effects of building orientation and configuration on its energy consumption and comfort of wind environment, a combination of numerical simulations using the advanced simulation software Design Builder 2012 complimented by a separate thermal energy assessment and detailed calculations has been also conducted. These were augmented by the CFD simulations which allowed observing wind flow distribution around buildings. Methodologies applied are described in detail in the following sections.
2.1 Input data
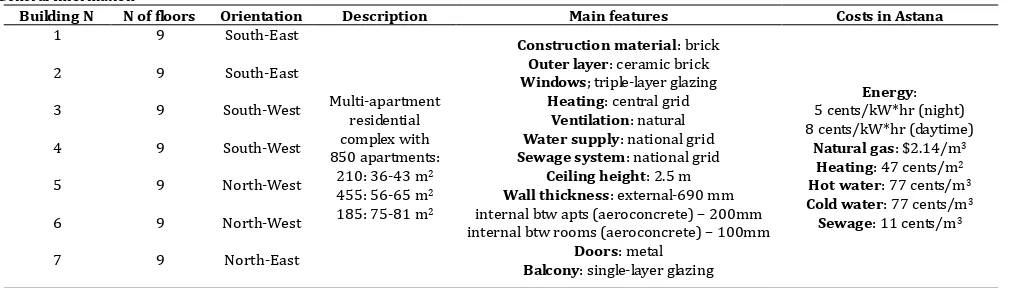
2.1.1 Buildings description and technical characteristics
Tabel 1
General Information
Building N N of floors Orientation Description Main features Costs in Astana
1 9 South-East
Outer layer: ceramic brick
Windows; triple-layer glazing
Heating: central grid
Ventilation: natural
Water supply: national grid
Sewage system: national grid
Ceiling height: 2.5 m
Wall thickness: external-690 mm internal btw apts (aeroconcrete) – 200mm internal btw rooms (aeroconcrete) – 100mm
Doors: metal
2.1.2 Brief description of Climate in Astana
Astana is located on the northern part of Kazakhstan, and situated on the zone of steppe. The climate of Astana is acutely continental and characterized by extreme weather conditions. The compulsory building code in Kazakhstan is given in reference (CNRK 2011). The data on climate conditions of all regions of Kazakhstan are used for the design of all structures and facilities (residential, industrial, etc.). According to this code, the values of climatic parameters of Astana are as following (Table 2).
Table 2
Climatic parameters of Astana for a cold/warm period of a year
Cold period
Air temperature of the coldest 5 days with probability of 0.98, 0C
-36
Air temperature of the coldest day with probability of 0.98,
0C
-41
Absolute minimum air temperature, 0C -52
Average daily amplitude of air temperature during the
Predominant wind direction during the period of December
– February
Air temperature with probability of 0.98, 0C 29.5
Average maximum air temperature during the warmest month, 0C
27
Absolute maximum air temperature, 0C 39
Average daily relative humidity of air during the warmest
Another value taken from CNRK 2002 is based on a parameter Dd called as Degree-days of the heating
period . According to CNK , for Astana Dd is taken
as 6286 0C∙day. )nterpolating the values from CNRK
2002 for D = 62860C∙day and calculating out from ,
one can get maximum value of R0req = 3.6 (m2∙0C)/W. It
implies that for the walling construction the following condition should be satisfied:
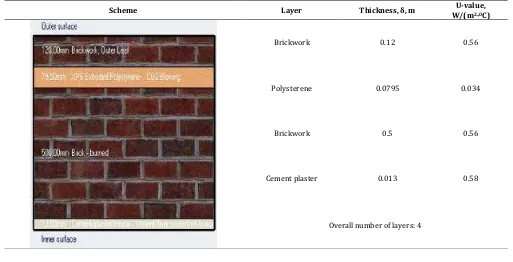
The wall construction consists of 4 layers description of which is given in the Table 3.
The calculated value of R0des = 3.63 (m2∙0C)/W. This
Tabel 3
Description of the Wall construction
Scheme Layer Thickness, δ, m U-value,
W/(m2∙0C)
Brickwork 0.12 0.56
Polysterene 0.0795 0.034
Brickwork 0.5 0.56
Cement plaster 0.013 0.58
Overall number of layers: 4
Tabel 4
Values of TDEQw and SF
Parameter Cardinal directions
N NE E SE S SW W NW
TDEQw, 0C 1.70 2.05 2.40 1.90 1.40 1.75 2.10 1.90
SF 104 138 168 197 191 202 175 138
2.2.2 Evaluation of the Overall Thermal Transfer Value (OTTV)
For the approximate estimation of the energy consumption of a building envelope, the calculation and comparison of the external wall OTTV value depending the orientation of the building was fulfilled on the base of HKBA 1995. The external wall OTTV value is calculated using the following formula:
(4)
where, Aw =303.264 m2; U=0.275 W/(m2∙0C); =0.88;
TDEQw depends on the cardinal direction; Afw: façade –
275.4 m2; back side – 201.6 m2; SC=0.5 for triple
glazing; ESM=1 for no shading; SF depends on the cardinal direction; Aow: opaque walls – 303.264 m2,
façade and back side walls – 1462.374 m2.
Since the main variable in this study is the building orientation all other parameters were held constant. The values of the wall and fenestration areas were determined on the drawing of the plan and axonometrical view of the building. The values of the TDEQw and SF are presented in Table 4. For TDEQw the
density of wall construction was taken into account.
The results of the calculations are presented as graphs plotted on OTTV values vs. cardinal orientations (Fig. 2). Here, denomination of the walls by numbers is shown in Fig. 3. As OTTV is considered as a criterion for the estimation of the building envelope for absorption of the external heat and release (loss) of internal heat, for energy savings its value should be minimum.
0 5 10 15 20 25
N NE E SE S SW W NW
OTTV of Wall #4, W/m^2 Average OTTV, W/m^2 OTTV of Wall #1, W/m^2 OTTV of Wall #2, W/m^2 OTTV of Wall #3, W/m^2
OTTV of Walls, W/m2vs.orientation of the facade
O
T
T
V
, W
/
m
2
Fig. 3 Building configuration
Fig. 4 Building Orientation in Northern Hemisphere (Zafirol & Al-Hafzan, 2010)
In this study, results indicate that the least heat loss corresponds to the façade of the building (Wall #4) which faces South.
According to Allen & Jano …the most desirable
orientation of a rectangular building is to align its calculation results give reasonable and accurate estimation.
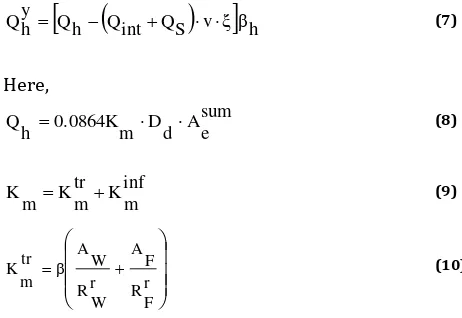
2.2.3 Calculation of specific (design) heating energy demand for cold season
Using the methodology provided in CNK 2006, the value of specific heating energy demand of the building for cold season has been calculated. This parameter is denominated as design, and the required one is also given in that code. From CNK 2006 for residential 8-9-floor building the required value is taken as 80 kJ/(m2∙°C∙day . So, the following condition of heating
energy demand according to CNK 2006 code should be satisfied:
Design value is determined using following formula:
d
energy for heating is calculated as:
Domestic heat gaining is determined as:
Qint=0.0864qint·zht·Al (12)
Fig. 5 Specific heating energy demand value vs. facade orientation of the building
depending on the cardinal direction. According to (7), the more value of Qs the less useful heating energy is needed. The specific heating energy demand values calculated using (6) for different cases with various products of area of fenestration and the solar factor are found and the graph plotted on the base of these results is presented in Fig. 5.
If to consider the tendency of change for specific heating energy demand value and heat gaining through fenestration from solar radiation (Qs), turning the façade
from NE (given orientation) to S gives increase of Qs by
22% and decrease of qhdes by ≈ %. Overall calculation
results show that the condition (5) is satisfied for given building design case.
2.3 Thermal assessment validation by Orientation vs. Energy use simulations
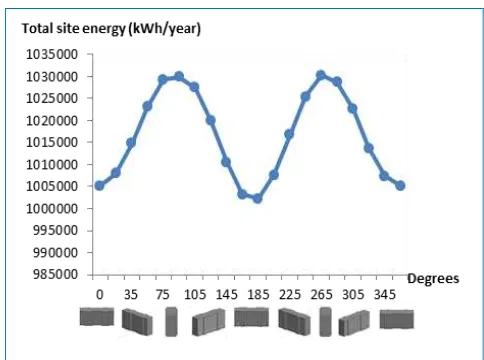
At the initial stage of the study, it has been decided to choose one out of the 18 buildings and to vary its orientation systematically. Initial position (façade) of the chosen building was 35 degrees towards North-East direction. As it can be seen from the Fig. 6, turning the building in a clockwise direction leads to increase of total site energy – amount of heat and electricity consumed by a building. Turning the building in opposite direction (anti-clockwise) has shown that the building tends to gradually reduce its energy consumption. This process takes place only up to the point where elongated axis is aligned along the East-West direction. Turning the building more leads to increase of energy consumption (Fig. 7). Therefore, these results show that for the considered building the North facing direction is optimal.
The North facing direction, however, is not the only optimal direction. Drawing correlation between the
building’s orientation and its energy consumption in a
larger scale shows that the South facing direction is also suitable (Fig. 8). In order to investigate further which direction is optimum in terms of energy saving 180
degree facing was enlarged. This allowed to observe that 185 degree direction can save 0.25% more than the North facing direction (zero degrees), Fig. 9. Therefore, this comparison has shown that the South facing direction (185 degrees) is the most optimal orientation.
Fig. 6 Total site energy vs. Orientation
Fig. 7 Total site energy vs. Orientation
Fig. 9 Total site energy vs. Orientation
2.4 CFD analysis
2.4.1 The boundary conditions
The boundary condition has been set as initial velocity values correspondingly u, , ω direction and ambient outdoor temperature which are constant through the domain; and final conditions are automatically built-in as pressure equals to atmospheric pressure. So, overall boundary conditions can be expressed as following:
atm p p
e temperatur outdoor
ambient T
s m const u
0 0
/ 9 , 5
where u is the predominant wind velocity in this region, and T is indicated for winter period.
Calculation option data, include: discretisation, among built-in three discretisation schemes, Upwind scheme has been used for the calculation; turbulence model, turbulence was modelled using k-e model; and
iterative convergence of residual display parameters, the maximum number of outer iterations has been set equal to 5000. Residual display parameters are mass and velocity.
2.4.2 Results overview
The application of CFD for pedestrian – level wind studies was initiated by the early, more general research efforts in which CFD was applied to study the wind-flow pattern around isolated (single standing) buildings (Baskaran & Kashef, 1996). In order to develop further, this paper attempted to establish correlations between orientation and configuration of a building(s) and its wind system pattern and behavior. In order to find out how the above mentioned aspects affect the wind flow distribution, it has been decided to run simulations separately for both configurations: i.e. for a single standing building and a complex (several blocks).
The Single Standing Building Model
This model was simulated for 12 orientations of the
target building: ˚, ˚, ˚, ˚, ˚, ˚, ˚,
˚ directions with increment of degrees and
starting with the initial orientation ˚ and the main
directions ˚, ˚, ˚, ˚ the latter ones were taken
intentionally in order to compare with the previous model results and only they are presented in the table).
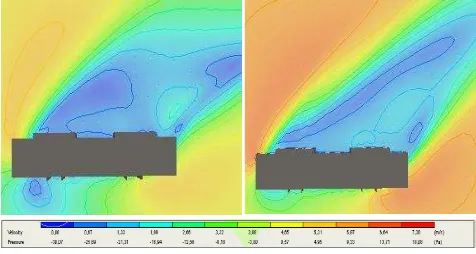
This type of arrangement is also one of the often encountered arrangements in Astana. Usually people living in such isolated buildings complain on lowering of indoor temperature due to winds continually blowing on the external walls and windows. The outdoor conditions are also reported to be uncomfortable mainly due to open space around a building. In fact, neighboring buildings do not provide protection from intensive winds typical to Astana if they are not surrounding the considered building (Time.kz 2012). This model is also characterized by a relatively high level of nuisance as ventilation systems joining with outdoor wind flows can create drafts in the apartments and lift shafts (E-vesti.kz 2011).
Simulations have shown that the initial orientation of the considered building is the best fit (Fig. 10). In contrast to other directions current orientation is found to be providing more comfortable environment. The yard side of the building has the lowest level of wind speed and pressure. Whilst almost all other orientations
Fig. 10 Wind and pressure distribution around the single standing building at 1.35 m and 20 m height levels. Direction - ˚ initial
position)
create smaller comfort zones as, for example, in case of
˚ Fig. , the initial direction allows creating larger
propitious wind environment including the rear side of the building.
Multiple building configurations
Wrong placement of buildings with respect to each other, inappropriate distance between two adjacent buildings as well as their orientation with respect to the dominant wind direction can sometimes cause severe adverse effects. Durgin & Chock 1982 proved that uncomfortable wind conditions have been destructive to success of new buildings. For instance, Wise 1970 reports about supermarkets built-in in one of the blocks were left without visitors due to windy environment. Lawson & Penwarden 1975 reported that dangerous wind condition has led to death of a couple of elderly people after they were blown over by sudden wind drafts near a high-rise building. It is an often encountered situation in Astana when people are drawn back by wind and are not able to go through passing spaces (arches) between adjacent buildings (OldKurier 2012).
CFD simulations for this model were completed for
five main orientations: ˚, ˚, ˚, ˚, ˚; with
original direction of the target building (the one in the center of the complex) and the whole complex - ˚ towards the North-East.
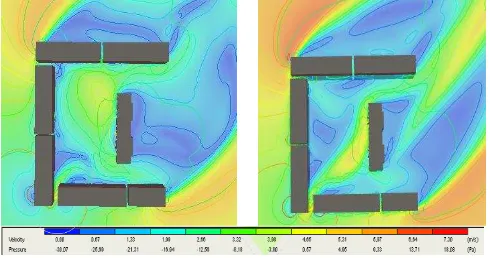
Fig. 12 Wind and pressure distribution around the complex at 1, 35 m and 20 m height levels. Direction - ˚ initial position
Fig. 13 Wind and pressure distribution around the complex at 1, 35 m and 20 m height levels. Direction - ˚
As the complex currently exists, it was aimed to compare actual orientation with other potential alternatives. As it can be seen from the CFD images in the Figure 12, the wind flow pattern between the buildings when they are located in a box-shaped form is quite satisfactory. The yard site, where the most of time of tenants is spent, has low level of wind velocity and pressure. Images present the plan view of the computed velocity and pressure fields around the buildings at 1.35 m (pedestrian level) and 20m (middle of the domain height) from the ground level for normal wind conditions. Values of wind velocity and pressure are distinguished by color and are indicated on the scale.
However, changing the orientation of the complex has shown that there are setups that provide more favorable wind conditions. For instance, turning the object to
˚direction has allowed reducing the wind speed and pressure inside the box . (igh wind speed and pressure
values noticeable in the initial position (Fig. 12) dropped down as the surrounding buildings started to hamper the effect of winds from predominant winds direction (Fig. 13).
Thus, simulation results also show that complex with the same configuration model can create different wind environments given different orientations. Comparing snapshots for different orientations (degrees) the study concluded that all simulated directions have different effects on the local flow development.
2.4.3 Comparative assessment
Comparison of two cases shows that multiple buildings configuration as expected, provide moderate and controlled conditions in terms of wind velocity and pressure levels than the stand alone single building model. Although there are areas where turbulence takes place but they do not seem to be excessive in nature (within the stated conditions). Figure 11 shows that the single standing building, in turn, is characterized by quite high speed wind flows around it and noticeable high pressure levels at the corners of the building. With regard to orientation both models seem to have the best fit degree with respect to North and wind direction. In the case of the building complex, most desirable conditions are created when it is turned to 270 degrees direction. It seems to be obvious as orientation of complex close to
this value creates blocking effect to the predominant
winds. The inner area seems to be protected from winds by surrounding buildings. The yard side can be categorized as sheltered. In case of a single standing building the best fit orientation is considered its initial
orientation ˚ . As the wind direction ˚ and the
building’s façade yard are in the same directions they
are most likely to create the most quiet and safe environment among all.
study employs a specialized code, a proposal of the most optimal features of two different models will be purely based on the analysis of CFD results. According to the above presented comparison, it is suggested to consider the multiple buildings configuration (a box-shaped in this case) rather than a single standing building while designing future housing developments. Other types of multiple building configurations should be studied too.
With respect to buildings’ orientation it is recommended
in case of a complex model to turn the fully surrounded
side of a box opposite to the predominant wind
direction ˚ in this case . In the latter model, a
building should be located with the rear side opposite to
the wind direction ˚ in this case .
3. Conclusion
This analysis presents a snapshot of the evaluation of low-energy building design strategies for the extreme weather conditions in Astana, Kazakhstan. Computational tools have allowed taking into account various climatic features common for the locality. For instance, temperature ranging between -35 to +40 C, direction of strong winds, duration of daylight time, etc. Besides, it was also possible to include a wide range of construction specific data such as used construction materials, type of activities typical to spaces in a building, HVAC system, etc. The lowest values for OTTV have been found out in case of North-South direction of the long facades of the building. Also, even though for consideration of all cardinal directions the design value of the specific heating energy demand is less than the required one, estimation of the results show that the south orientation of the main façade (with larger fenestration factor) is the most favorable case. Therefore, the optimum balance comes up when façade of the building directed to the South.
The influence of orientation and configuration is discussed with reference to energy efficiency and associated wind comfort and safety. The effect of these aspects on energy consumption and comfortable wind environment has been assessed using CFD analysis and proved to have positive correlation. This means that these two parameters actually affect the energy and wind comfort aspects. Single building and multiple building configurations have been analyzed and compared. According to the findings, multiple buildings configuration has more plane wind conditions rather than a single standing building. With respect to orientation the former one should be modeled with the
fully surrounded side of a box opposite to the
predominant wind direction whereas the latter one should be located with the rear side opposite to the wind direction. Thus, there is a potential direction in which construction industry can move. The Kazakh traditional way of building orientation is dictated not by the energy efficiency or the wind comfort and safety, but more by
atheistic aspects. According to several interviews standard planning seems to locate a new building parallel to existing roads or perpendicular to a neighboring building. In order to meet the challenges of climate change the Government has to consider all possibilities of building design optimization including suggested
orientation and configuration aspect as well as
incorporation of available sustainability practices and technologies.
Nomenclature
AF area of fenestration, m2
AFi area of fenestration of i-th side of the building
Afw area of fenestration in wall, m2
Ah sum of heated floor area, m2
Al for residential buildings: total area of living rooms and kitchens, m2
Aow = Aw +Afw, gross area of external walls, m2
Aw area of opaque wall, m2
Aesum Total area of internal walling construction
ESM external shading multiplier
Ii average amount of solar radiation onto vertical surface at real
cloudiness during heating season with respect of the orientation of the building facades, MJ/m2
Km total coefficient of heat transfer of the building which is the
sum of transmission coefficient and infiltration coefficient of the building, W/(m2·°C)
Paht Density of air during heating period, kg/m3
Qint domestic heat gaining during heating period
Qh total heat loss through external walling, MJ
Qs heat gaining through fenestration from solar radiation during
the heating period, MJ
Qhy useful energy for heating during heating season, MJ
RWr design thermal resistance of the wall construction
RFr design thermal resistance of fenestration
SC shading coefficient of fenestration in wall SF solar factor for the vertical surface, W/m2
TDEQw equivalent temperature difference for wall, 0C
U – U value of opaque wall, W/(m2∙0C);
Vh Heated volume of the building
c specific heat capacity of air, kJ/kgoC
k coefficient of the impact of counter heat flow
kF coefficient of relative penetration of the solar radiation
through the fenestration system
n coefficient taking into account the location of the walling construction with respect to outdoor air
na Average air ventilation, hr-1
text air temperature of the coldest 5 days with probability of 0.98, 0C
tht average external temperature during heating period, oC
tin indoor air temperature, 0C
Δt normative value of indoor and outdoor temperature drop 0C
qint amount of domestic heat release per 1 m2 of useful area, W/m2
zht duration of the heating period, days
absorptivity of opaque wall
in coefficient of heat release (loss) of the inner surface of the wall
constructions, W/(m2∙C)
Coefficient accounting for auxilary heat loss due to orientation
h coefficient accounting for additional heat consumption v coefficient of air volume decrease due to walls
coefficient of automatic regulation of heating supply
τF shading coefficient
Acknowledgment
The authors would like to thank Nazarbayev
University for the research funding, B) GROUP
construction company for making available data on building complexes and Associate Professor of Mechanical Engineering Desmond Adair for his invaluable advice and guidance throughout this study in the area of CFD simulations.
References
Allen, B. & Jano, C. (2001) Fundamentals of Building Construction; Materials and Methods, p.230. John Wiley & Sons, Inc. Baskaran, A. & Kashef, A. (1996) Investigation of Air Flow Around
Buildings Using Computational Fluid Dynamics Techniques.
Engineering Structures, 18(11), 861-875.
Baker, N. & Taleb, J. (2002) The Application of the Inclined Window Method for Passive Cooling in Buildings, Architectural Science Review, 45.
BBC (2010) Kazakhstan-Country Profile, http://news.bbc.co.uk/ (accessed date 15th April, 2012).
Beatti, C. (2012) Measuring Carbon for Urban Development Planning,
The International Journal of Climate Change: Impacts and Responses, 2-5.
Bia, S., Luh, P.B., Qing-Shan J., Ziyan J., Wang F. & Song C. (2010) An Integrated Control of Shading Blinds, Natural Ventilation and HVAC Systems for Energy Saving and Human Comfort, IEEE International Conference on Automation Science and Engineering.
Bi-group.kz (2012) Development and Civil Construction, http://bi-group.kz/ (accessed date 3rd April, 2012).
CNRK (2011) Construction Climatology. Construction Norms and Regulations of Kazakhstan, 2.04-01-2010, Almaty.
CNRK (2002) Construction Heat Engineering, 2.04-03-2002, Astana. CNK (1995) Construction Norms of Kazakhstan. Energy Consumption
and Thermal Protection of Residential (Civil) Buildings, 2.04-21-2004, Astana.
DCLG (2007) Building a Greener Future: Policy Statement. Department for Communities and Local Government. The Stationery Office, London
DesignBuilder (2012) http://www.designbuilder.co.uk (accessed date 9th March, 2012)
Durgin, F.H. & Chock, A.W. (1982) Pedestrian Level Winds: A Brief Review. Journal of the Structural Division, Proceedings of the Amer. Soc. Of Civil Engr., 108.
E-vesti.kz (2011) Security Measures in The Operation of Elevators, http://www.e-vesti.kz (accessed date 10th April, 2012).
Fletcher, C., Mayer, I.F. & Eghlimi A. (2001) CFD as a Building Services Engineering Tool. International Journal on Architectural Science, 2(3), 67-82.
HKBA (1995) Hong Kong Building Authority Code for OTTV in Buildings, Hong Kong.
Holm F. (2003) Towards sustainable built environment prepared for climate change? Presentation to Global Policy Summit on the Role of Performance-Based Building Regulations in Addressing Societal Expectations, International Policies and Local Needs, National Academy of Sciences, Washington, DC. Kazrealty (2012) Market, http://www.kazrealty.kz/ru/market/
(accessed date 13th May, 2012).
Krn.kz (2012) Real estate, http://www.krn.kz/index.php (accessed date 29th April, 2012).
Lawson, T.V. & Penwarden, A.D. (1975) The Effects of Wind on People in The Vicinity of Buildings. 4th Int.Conf. Wind Effects on
Buildings and Structures, Heathrow.
Maps (2012) http://www.google.com, (accessed date 13th April,
2012)
McAlpine J. D. & Ruby M. (2004) Using CFD to Study Air Quality in Urban Microenvironments. Chapter 1 of Environmental Sciences and Environmental Computing. Vol. II (P. Zannetti, Editor). Published by The EnviroComp Institute.
OldKurier (2012) Astana Established to Amaze,
http://old.kurier.lt/?r=25&a=5602, (accessed date 20th May,
2012).
Pmrpubcications (2008) Global Liquidity Crisis Hits The Kazakh Construction Industry, http://www.pmrpublications.com/, (accessed date 10th May, 2012).
Riju, C. (2009) Low Energy Building Design for the UAE. MSc in Energy dissertation, School of Engineering and Physical Sciences, Heriot Watt University (Dubai Campus).
RRCAP (2007) Industrial Pollution, Part 2, p.71,
http://www.rrcap.unep.org/reports/soe/sa_part2_3.pdf, (accessed date 16th April, 2012).
Smith G.B. (2010) Science of Daylighting in Building, Renewable Energy, 15, 325-330.
Time.kz (2012) Rich People also Get Cold,
http://www.time.kz/index.php?module=news&newsid=2578 3, (accessed date 10th April, 2012).
Today.kz (2012) Housing Deficit in Kazakhstan Reaches 100 Million Square Meters, http://www.today.kz/ru/news/finance/2010 -06-25/23580, (accessed date 12th April, 2012)
Tokbolat, S., Tokpatayeva, R. & Al-Zubaidy, S. (2012) Low Energy Building Designs for Extreme Weather Conditions in Central Asia.
Proceedings of the ASME 2012 International Mechanical Engineering Congress & Exposition.
UN (2008) Environmental Performance Reviews. Kazakhstan, Second Review, http://www.unece.org/, (accessed date 4th May,
2012).
Wise, A.F.E. (1970) Wind effects due to groups of buildings. Royal Society Symposium, Architectural Aerodynamics, London. Yearbook (2007) Summary Statistical Yearbook of Kazakhstan,
http://www.yearbook.com, (accessed date 16th April, 2012).