Kinetic Study on Catalytic Cracking of Rubber Seed
(
Hevea brasiliensis
) Oil to Liquid Fuels
Wara Dyah Pita Rengga1*, Prima Astuti Handayani1, Sri Kadarwati2, Agung Feinnudin3
1 Department of Chemical Engineering, Universitas Negeri Semarang, Kampus Sekaran
Gunungpati, Semarang 50229, Indonesia
2 Department of Chemical, Universitas Negeri Semarang, Kampus Sekaran Gunungpati,
Semarang 50229, Indonesia
3 Education and Training Agency, Ministry of Energy and Mineral Resources of Republic
Indonesia, Jl Poncol Raya No. 39 Ciracas, Jakarta 13740, Indonesia
* Corresponding Author
E-mail: [email protected]; [email protected] (W.D.P. Rengga) Tel: +62-24-8508101, Fax: +62-24-8508101
Bulletin of Chemical Reaction Engineering & Catalysis, 10 (1), 2015, 50-60
Received: 3rd December 2013; Revised: 5th December 2014; Accepted: 7th December 2014
Abstract
Reaction kinetics of catalytic cracking of rubber seed oil to liquid fuels has been investigated. The reac-tion was performed with sulfuric acid as catalyst at temperatures of 350-450 oC and the ratio of
oil-catalyst of 0-2 wt.% for 30-90 minutes. Kinetics was studied using the model of 6-lump parameters. The parameters were rubber seed oil, gasoline, kerosene, diesel, gas, and coke. Analysis of experimen-tal data using regression models to obtain reaction rate constants. Activation energies and pre-exponential factors were then calculated based on the Arrhenius equation. The simulation result illus-trated that the six-lump kinetic model can well predict the product yields of rubber seed oil catalytic cracking. The product has high selectivity for gasoline fraction as liquid fuel and the smallest amount of coke. The constant indicates that secondary reactions occurred in diesel products compared to gaso-line and kerosene. The predicted results indicate that catalytic cracking of rubber seed oil had better be conducted at 450 oC for 90 minutes using 0.5 wt.% catalyst. © 2015 BCREC UNDIP. All rights
re-served.
Keywords: Catalytic Cracking; Kinetics; Rubber Seed Oil; Liquid Fuel; six-lump
How to Cite: Rengga, W.D.P., Handayani, P.A., Kadarwati, S., Feinnudin, A. (2015). Kinetic Study on Catalytic Cracking of Rubber Seed (Hevea brasiliensis) Oil to Liquid Fuels. Bulletin of Chemical Reac-tion Engineering & Catalysis, 10 (1): 50-60. (doi:10.9767/bcrec.10.1.5852.50-60)
Permalink/DOI: http://dx.doi.org/10.9767/bcrec.10.1.5852.50-60
Available online at BCREC Website: http://bcrec.undip.ac.id
Research Article
1. Introduction
In the future, demand for bio-fuels will rise due to the rise in the price of fossil fuel, energy security reasons and environmental issues. A growing trend towards employing modern
rubber seed oil (RSO).
The rubber seed production potential in In-donesia is about 120 kg/ha per annum. The pro-ductivity of RSO per hectare per annum is re-ported as 170 kg oil/ha. The estimated avail-ability of rubber seed is about 280 kg seed/ha/year from 3 million hectare of rubber plantation. At present, RSO has found as natu-ral production of seeds remain under utilized and any major application such as biodiesel (methyl ester) [3-4] and alkyl resins [5]. In to order obtained diversifying product from RSO it is necessary to introduced and upgraded the process through catalytic cracking process.
Numerous catalytic cracking reactions have been used to convert palm oil [6-8], jatropha oil [9], cottonseed oil [10] into liquid fuels. The composition of palm oils, vegetable oils and cot-tonseed oils are different with RSO, mainly un-saturated fatty acid. The advantage of rubber-seed is the content of unsaturated fatty acids are higher than these oils around 80-85 %. However, RSO as possible can be done to appli-cation of catalytic cracking process. A primary cracking is characterized by the formation of a fatty acid through the decomposition of trigly-ceride molecules which occurs through break-age of the ester bonds. The secondary cracking is characterized by the degradation of the acids produced in the first stage leading to the for-mation of hydrocarbons with properties similar to those of petroleum products.
Catalytic cracking process using a newly de-veloped catalyst has enabled to produce high quality. The general catalysts which have been use to cracking process is solid catalyst such silica sand [10] and zeolite[6,7,9,11]. However the used of solid heterogeneous catalyst may produce coke which caused fouling in catalyst pores and lead to deactivation of catalyst. The liquid homogenous can covered the obstacle that can performed in the used of solid hetero-geneous catalyst. The phase is similar to the raw material which favorable to the process of interface contact between catalyst and the oils. It is make homogenous catalyst intrinsically more active and selective compared to hetero-geneous catalyst [12].
It is necessary to conduct a research on RSO catalytic cracking using sulfuric acid as ho-mogenous catalyst to find out the potency of RSO producing liquid fuel. After reaction, sul-furic acid removal is necessarily conducted from the product by washing in water. The sul-furic acid is highly soluble in water. Some wa-ter needed until the mixture has a pH of 7. Wa-ter settles to the bottom and then siphon off the liquid fuels (gasoline, kerosene, and diesel).
However the research is only studying kinetic of catalytic cracking reaction of RSO to liquid fuels.
The study of kinetic reaction needs to be done to find out the kinetic parameter such as activation energy and pre-exponential factor. The most importance aspects of catalytic crack-ing process are kinetic study. It should be done to model and simulate the reactor, predicted the distribution of many products, designed the process, and optimized the operational condi-tions for industrial application. The several ki-netic models for catalytic cracking for produc-tion of liquid fuel were used feedstock from naphta [13], palm oil [14] mixture of palm oil and fatty-acid’s palm oil [15] and gas oil [16]. RSO can be converted into liquid fuels through complex reactions those occur during the oil cracking which aims to break large molecules into smaller ones such as gasoline, kerosene, and diesel fraction, gas fraction, and coke.
The objective of the present investigation is to design a suitable kinetic model for RSO cracking using sulfuric acid catalyst for the production of liquid fuels (hydrocarbon). The reaction parameters of the proposed kinetic model are evaluated and experimental data ob-tained are compared with the calculated values obtained from proposed model. Kinetic parame-ters were then estimated based on the regres-sion method. After the estimation of the kinetic parameters, the variations of product yields were predicted using operating conditions. 2. Materials and Methods
2.1. Preparation of Rubber Seed Oils
Rubber seed (Hevea brasiliensis) originated from Perhutani PTP Nusantara IX Semarang, Indonesia, was composed predominantly of li-noleic acid, which was C18:2 unsaturated fatty acid. RSO contains about 80% unsaturated fatty acids. Properties of RSO compared with the other rubber seed were given in Table 1. The raw rubber-seed oil was degummed using phosphoric acid 1% wt. oils. RSO was used for cracking study in the present investigation. 2.2. Catalytic Cracking Method
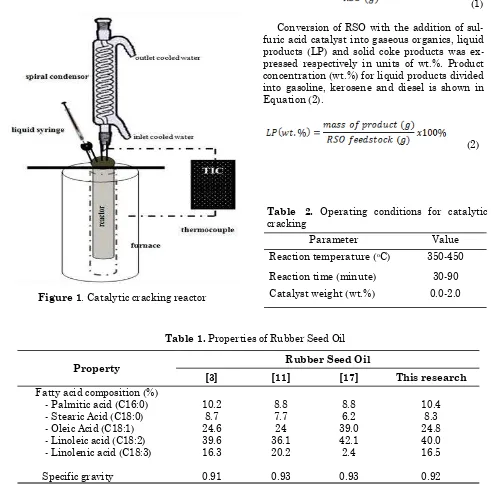
externally at rate of 10 oC/min. Once the
tem-perature was reached subsequently, the cata-lyst was introduced into the reactor by injection through a sample input hole. The catalyst 1.0% wt. was fed by liquid syringe-metering pump to add into RSO. The catalytic cracking process was done at different reaction times. The ranges of operating conditions for catalytic cracking of rubber seed are given in Table 2. The product gases were allowed to pass through a spiral condenser with flow of ice wa-ter. The weight of the gaseous products was es-timated by weight of RSO be subtracted by weight of the residual oil, the liquid product, and the coke formed. The coke formed was separated by decanting the liquid products. The liquid products analyzed using GC-MS were
used for identifying the compounds in the li-quid products. GC-MS with accuracy levels of 1/100 for liquid (gasoline, kerosene, and diesel) identification.
2.3. Product Analysis
The weight of residue which was not con-verted or phase that was not distilled is resi-dual oil. Yield (Xp) in wt.% after the reaction is the weight of RSO subtracted by weight of re-sidual oil (RO). These results compared with the weight of initial RSO are shown in Equa-tion (1). The data of final volume measurement from obtained volume is shown in Table 3.
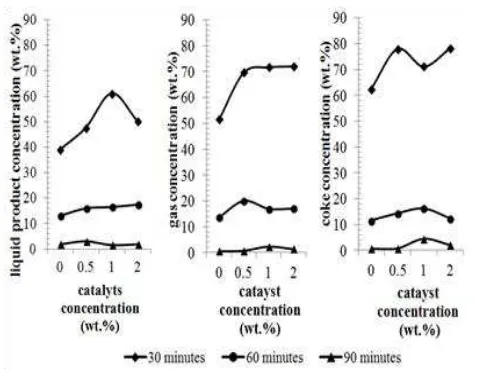
(1) Conversion of RSO with the addition of sul-furic acid catalyst into gaseous organics, liquid products (LP) and solid coke products was ex-pressed respectively in units of wt.%. Product concentration (wt.%) for liquid products divided into gasoline, kerosene and diesel is shown in Equation (2).
(2) Bulletin of Chemical Reaction Engineering & Catalysis, 10 (1), 2015, 52
Table 1. Properties of Rubber Seed Oil
Property Rubber Seed Oil
[3] [11] [17] This research
Fatty acid composition (%) - Palmitic acid (C16:0) - Stearic Acid (C18:0) - Oleic Acid (C18:1) - Linoleic acid (C18:2) - Linolenic acid (C18:3) Specific gravity
10.2
8.7 24.6 39.6 16.3 0.91
8.8 7.7 24 36.1 20.2 0.93
8.8 6.2 39.0 42.1 2.4 0.93
10.4
8.3 24.8 40.0 16.5 0.92
Table 2. Operating conditions for catalytic cracking
Parameter Value
Reaction temperature (oC) 350-450
GC-MS analyses providing data for quantifi-cation of compounds were divided into three classes: gasoline (C4-C9), kerosene (C10-C15),
and diesel (C16-C24) based on the percentage of
peak area on GC chromatogram. The weight of the gas products was estimated by weight of RSO subtracted by weight of the residual oil, the liquid product, and the coke formed. Solid product obtained after decanting the liquid products was assumed as coke.
The constants (k) are reaction rate constants of products such as: diesel, kerosene, gasoline, gas, and coke. They are temperature-dependent, calculated in accordance with the Arrhenius expression. Determination of the ac-tivation energy was performed using the Ar-rhenius Equation (Equation (3)) and calculat-ing the activation energies (E) and frequency factor for (A) each reaction by plotting logarith-mic reaction rate constant against reciprocal temperature. The activation energy was ob-tained from the slope of the plot, whereas the intercept was used to determine the pre-exponential factor.
(3) 2.4. Prediction of the 6-lump Kinetic Model
To validate the kinetic modeling, scatter diagram predicted and other new experimental data was utilized. R-squared (R2) is a statistical
measure of how close the experimental data are to the fitted regression line. root-mean-square error (RMSE) is a frequently used measure of the differences between values predicted by a model or an estimator and the values actually observed. The sum of squares of error (SSE) and the total of sum of squares (SST) were used to define the R2 and RMSE as equation
(4-7), where Yexp is yield from experimental data and Ymodel is yield from model.
(4)
(5)
(6)
(7)
Bulletin of Chemical Reaction Engineering & Catalysis, 10 (1), 2015, 53
3. Results and Discussion
Oil product from the cracking of RSO by sul-furic acid was mainly composed of n-paraffin, branched-chain and cyclic-chain paraffin, and aromatics (derivatives of benzene). Some pro-ducts of rubber seed oils including gas, gaso-line, kerosene, diesel, and coke.
3.1. Lumped Catalytic Cracking Reaction Model
The reaction network employed for the ki-netic modeling of the liquid fuel of RSO is pre-sented in scheme of Figure 2. The lumps of cracking products were calculated based on the weight fraction.
This model requires 6 parameters to facili-tate the data processing obtained from experi-ments. Using this model some simultaneously reaction occurrences in a set of experiments based on a 6-lump derivative model can be shown [6]. This model consists of a series of liq-uid products divided into three series, namely gasoline, kerosene, and diesel fraction. In each lump, it is assumed that the larger bons will be cut down into smaller hydrocar-bons. The parameter of kinetic reaction of 6-lump model was estimated in Equation (14-21).
(14)
(15)
(16)
(17)
(18) (19) (20)
(21)
Bulletin of Chemical Reaction Engineering & Catalysis, 10 (1), 2015, 54
3.2. Effect of Temperature
In some cases, RSO was converted to gas phase, liquid phase, and coke at various tem-peratures and various times of catalytic crack-ing reaction at concentrations of catalyst 0.5 wt.%. Effect of reaction temperatures on the conversion of RSO with sulfuric acid catalyst was examined. The effect of temperature on the yield was studied by varying the temperature of 350-450 oC. Figure 3 shows the yield of
pro-duct catalytic cracking with reaction time for 90 minutes by varying temperature. It has been observed that the yield of liquid and gase-ous product is highly influenced by the increase in temperature. The optimum yield of cracking
reaction of RSO to liquid product is 78 % at 450
oC (Table 3) using 0.5 wt.% sulfuric acid
cata-lyst from total yield product 97 wt.%. The higher temperature (450 oC) accelerates the
thermal decomposition and changes long-chain hydrocarbon molecules into middle/light hydro-carbon molecules by catalytic cracking. In other case, catalytic cracking using palm oil had an optimum yield as well with the same fraction product [6].
The concentration of each cracking reaction product at temperatures of 350-450 oC
in-creased with increasing temperature. At cata-lyst concentration of 0.5 wt.% and reaction time of 30 minutes, the concentration of each reac-tion product decreased except the gas product. This might be caused by the amount of catalyst added to the reaction conditions which was not sufficient to catalyze the cracking reaction re-sulting in decrease in the conversion of each product. The gas product increased with in-creasing temperature due to the increase in free radical formation at elevated temperature as a consequence of the fragmentation reaction without hydrogen due to the high molecular energy levels of the reactants. Cracking activity increased, occurred randomly and less con-trolled so that the generated gas product (light fractions) increased as well.
The results of catalytic cracking from RSO with sulfuric acid are the gasoline and kero-sene fractions which increased with increasing reaction time. The coke formation seemed have a close relationship with the gasoline fraction, but not with the kerosene fraction. The secon-dary/continued cracking reactions occurred. It was observed that the most of the kerosene fraction from diesel fraction cracked. Deviation of reaction kinetics for diesel and gas fraction in fitting method were probably due to both are the products that are kinetically not stable, so that when equilibrium is reached, the fractions are not found in large numbers because of con-sumed and converted into more dominant prod-ucts. The dominant products which are stable kinetically and thermodynamically were gaso-line fractions with conversion of 48.3%. The similar result was obtained from palm oil with conversion of gasoline of 35% by using nanocrystalline zeolite[16].
The increase in gas product with increasing temperature may be due to the high cracking activity confirmed to the coke produced. The in-creasing temperature, the potential for coke be-came lower. The high cracking activity as a re-sult of the high molecular energy was the domi-nant factor. The catalyst played fewer roles in declining the potential for coke formation. The Figure 3. Variation temperature of reaction
for 90 minutes using 0.5 wt.% catalyst
Bulletin of Chemical Reaction Engineering & Catalysis, 10 (1), 2015, 55
increasing concentration of the catalyst was not followed by a significant decrease in the amount of coke.
3.3. Effect of Reaction Time
Reaction time reflects the interaction be-tween reactants and reactant-catalyst in the reaction system. The reaction time contributed mainly to the liquid yield was increased at 450
oC until 78%. Figure 4 shows the
concentra-tions of RSO, diesel, kerosene, gasoline, gas and coke against the reaction time. Generally, it can be observed that the increase in reaction time resulted in the increasing concentrations of liquid products at catalyst concentration 0.5 wt.% and reaction temperature 450 oC with the
highest gasoline concentration. This is because the longer the reaction time, the longer the in-teraction, and the greater probability for reac-tion. In these conditions, gasoline provided a high selectivity towards liquid product.
Gas product of lighter fractions as the conse-quences of advanced reaction seems occur. It can be observed from the decrease in the con-centration of the gas product of light fractions with increasing reaction time, the possible re-action is the polymerization reaction (incorporation of light fractions to heavier frac-tions) and isomerization [16]. The effect of reac-tion time on the product distribureac-tion indicates that temperature was also a main factor affect-ing the conversion of long-chain hydrocarbon to middle-chain hydrocarbon, and continued cracking led to middle hydrocarbon goes to gas fraction [19], low-chain hydrocarbon and coke by increasing the reaction time.
3.4. Effect of Catalyst
The catalyst can accelerate the rate of reac-tion that leads to more dominant products in the equilibrium by lowering the activation energy. But the decline in activation energy should be significant enough to accommodate an increase in the rate of reaction, or be accom-panied by a very significant increase in fre-quency factor. If the decrease in activation energy is not significant without a significant increase in frequency factor, the reaction rate will decrease. If the research of liquid fuel de-velopment based on natural oil is seriously engaged, the process with high efficiency and does not require a big expense need to be con-sidered.
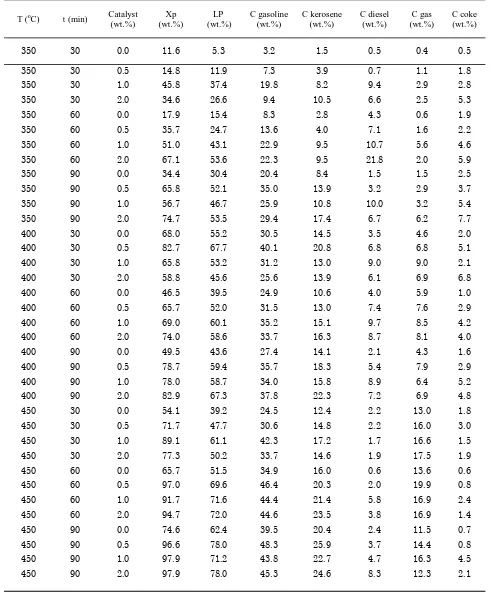
Figure 5 shows that the yield of the catalytic cracking at temperatures of 450 oC for
varia-tion of catalyst concentravaria-tions and reacvaria-tion times. The catalytic cracking products can be found in the form of liquid fuel, gas, and coke products. The catalytic process for differences in reaction time of 30, 60, and 90 minutes can be seen clearly that the longer the product of liquid fuel, the reaction process of the higher product yields, especially a reaction time of 90 minutes to reach 78% yield. The use of a cata-lytic amount ranges from without catalyst up to 2.0 wt.% of liquid fuel is seen that the optimum concentration of catalyst1.0 wt.% that the reac-tion time of 30 minutes with a yield of 61%. This is in contrast that liquid fuel products with the reaction time of 60 minutes and 90 minutes using 0.5 wt.% catalyst can achieve the highest yield of 72% and 78%, respectively. The highest yield of liquid fuels in the catalytic
Figure 4. Variation of reaction time of catalytic cracking at 450 oC using 0.5% catalyst
Figure 5. Concentrations of catalytic cracking products at reaction temperature 450 oC for
Bulletin of Chemical Reaction Engineering & Catalysis, 10 (1), 2015, 56
Table 3. Gaseous, liquid, and solid product of catalytic cracking of rubber seed oil
Bulletin of Chemical Reaction Engineering & Catalysis, 10 (1), 2015, 57
cracking reaction temperature at 450 oC for 90
minutes using a catalyst of 0.5 wt.%.
Coke formation rate is a measure of the suc-cess of the prosuc-cess of production of liquid fuels. In Figure 3 as well, it can be shown that the coke produced were very low (0.8 wt.%) al-though with increasing catalyst concentration. At 450 oC and with a fairly low concentration of
catalyst of 0.5%, coke produced reached its low-est point with a reaction time of 90 minutes. In these conditions gasoline fuel fractions also was produced at highest level. Thus, these condi-tions provide a high selectivity towards gaso-line fraction. Effect of usage of catalyst is shown in Figure 6. Gasoline, a dominant product of liquid fuel has the same behavior with liquid fuels. The concentration of gasoline clearly higher for reaction time of 90 minutes than 60 minutes happened at reaction tem-perature of 450 oC. The use of catalysts 0.5
wt.% shows an increase of yield product of 20-25 % than reaction without catalyst. However, the use of 1.0 wt.% catalyst on catalytic crack-ing for 90 minutes shows a decrease yield after peak of yield on 0.5 wt.% catalyst usage.
Some fraction of liquid fuel produced, gaso-line fraction always provided the greatest con-version compared to other fractions such as die-sel, and kerosene products. In general it can notice that the concentration of gasoline pro-duced as selective product is a function of tem-perature, catalyst concentration, and reaction time. However, for a reaction time of 90 minutes and a catalyst concentration of 0.5 wt.%, the trend of gasoline fraction increased with increasing temperature and time is the case. It was due to the limited amount of cata-lyst in the reaction system was not supported with adequate contact time between reactants.
3.5. Kinetics Parameter Estimation
The reaction rate constants calculated by as-suming that each of the single reaction is fol-lowing the pseudo-first order kinetics. This pa-per presents the kinetic study of catalytic cracking of RSO catalyzed by homogeneous acid catalyst including the kinetic parameters for each of fuel products as well as activation energy for the reactions undergone. A better understanding about the mechanism of cata-lytic cracking of RSO will be reported sepa-rately.
Kinetic parameters are firstly estimated to detect the fitting capability of lumping models. The reaction rate constants (k) were estimated by solving the system of differential equations (9-21) from model. It was determined by quasi-fitting method using fmin search program. The model equation is used to predict the yield of products. It is important to include the tem-perature effect on the kinetic parameters using the Arrhenius law. The k value each product is shown rate formation product. The formation of gasoline, kerosene, and gas is getting higher, while the formation of the diesel and coke de-creases for long reaction times and high reac-tion temperatures. As seen in the Table 5, the
Figure 6. Gasoline concentration at reaction temperature of 450 oC
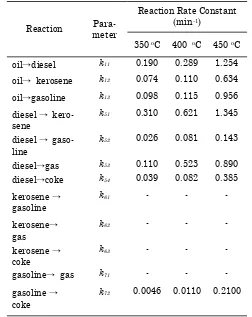
Tabel 4. Reaction rate constant of the 6-lump model
Reaction Para-meter
Reaction Rate Constant (min-1)
350 oC 400 oC 450 oC
oil→diesel k11 0.190 0.289 1.254
oil→ kerosene k12 0.074 0.110 0.634
oil→gasoline k13 0.098 0.115 0.956
diesel → kero-sene
k51 0.310 0.621 1.345
diesel → gaso-line
k52 0.026 0.081 0.143
diesel→gas k53 0.110 0.523 0.890 diesel→coke k54 0.039 0.082 0.385
kerosene →
gasoline
k61 - - -
kerosene→
gas
k62 - - -
kerosene →
coke
k63 - - -
gasoline→ gas k71 - - -
gasoline →
coke
k72 0.0046 0.0110 0.2100
Bulletin of Chemical Reaction Engineering & Catalysis, 10 (1), 2015, 58
values of k gasoline are much higher than the other product. Therefore, the gasoline is pro-duced more in the catalytic cracking than kero-sene, gas, coke, and, diesel as obtained in the experimental results.
Determination of the activation energy was performed using the Arrhenius Law and calcu-lating the pre-exponential factors and activa-tion energies. Table 5 shows the activaactiva-tion en-ergies and pre-exponential factors calculated for the reaction parameters. The activation en-ergy is associated with the thermodynamic fac-tors that require an adequate energy, while ki-netically the measurement of the accuracy of orientation is reflected by the pre-exponential factor.
Over the temperature range, the average values of energy activation were estimated 100 kJ/moles for liquid fuels. The activation energy determined in this paper are close to those re-ported for catalytic cracking of waste lubricat-ing oil and palm oil was 103.68 kJ/moles [19] and 132 kJ/moles [6]. Shortly, the catalytic cracking of RSO using sulfuric acid as catalyst is preferred thermodynamically due to the lower activation energy.
3.6. Prediction of Kinetic Model
In order to validate the kinetic modeling, diagram of predicted and new experimental data was utilized. R2 can take any value
be-tween 0 and 1, with a value closer to 1 indi-cates a good fitness. The obtained results
demonstrate that kinetic model is in good agreement with experimental data. A signifi-cant test indicates that the observed R2 is
reli-able, and is not a spurious result of oddities in the data set. The R2 and RMSE of the test for
components such as diesel, kerosene and gaso-line are reported closer the value of R2 to 1, the
better agreement of experimental data and model prediction is implied.
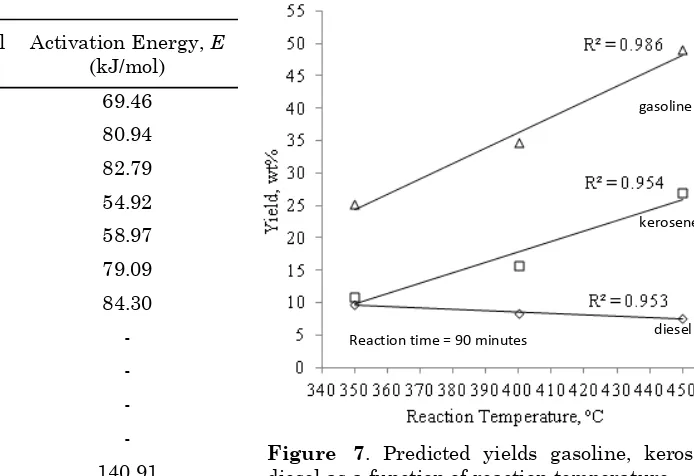
Figure 7 shows predicted yield of variation in diesel, kerosene, and gasoline with reaction temperatures of 350-450, keeping the reaction time of 90 minutes and ratio catalyst/oil at 1. The yields increased monotonously with in-creasing temperature, and that of diesel, kero-sene and gasoline showed a maximum of 8.9 wt.%, 26.9 wt.%, and 49.0 wt%, respectively. Maximum error as compared to experimental data for products used in the objective function is 9.4%. The model fits reasonably well with the experimental data were indicated to R2 and
RMSE. The observed R2 is reliable with closer
value of R2 to 1, while RMSE are 1.001, 0.666,
and 0.330 for gasoline, kerosene, and diesel, re-spectively. These results have better agreement of experimental data and model prediction.
The higher the reaction temperature, de-creasing yield of diesel, followed with increas-ing yield of the kerosene and diesel. The kinetic rate constants showed that gasoline and kero-sene fractions did not undergo secondary crack-ing reactions compared with the diesel fraction. The diesel tends to take part in secondary reac-tions.
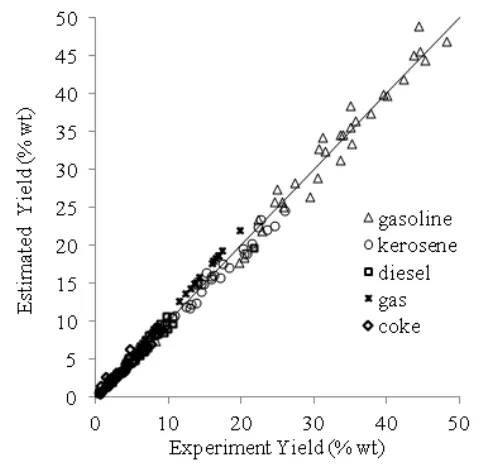
Figure 8 shows the graph of experimental data versus estimated data of yield. The corre-lation of values between experimental data and Table 5. Pre-exponential factors and
Activa-tion energies
Para-meter
Pre-exponential Factor, A
Activation Energy, E (kJ/mol)
k11 1.06x10⁵ 69.46
k12 3.42x10⁵ 80.94
k13 6.36x10⁵ 82.79
k51 1.21x10⁴ 54.92
k52 2.28x10³ 58.97
k53 5.38x10⁵ 79.09
k54 3.97x10⁵ 84.30
k61 1 -
k62 1 -
k63 1 -
k71 1 -
k72 2.09x10⁹ 140.91
Figure 7. Predicted yields gasoline, kerosene, diesel as a function of reaction temperature
gasoline
kerosene
Bulletin of Chemical Reaction Engineering & Catalysis, 10 (1), 2015, 59
model were more suitable. Results indicate no meaningful difference in the predicted values though it is obvious that using 6-lumps will provide more details of the catalytic cracking reactions. Maximum error as compared to ex-perimental data for products used in the objec-tive function is 9.4%. In spite of limitation of experimental data for model, the model predic-tions for product yield describes very well the kinetic phenomena occurring on sulfuric acid catalyst in catalytic cracking of RSO.
4. Conclusions
Cracking reaction of RSO catalyzed by sul-furic acid achieved condition at temperature range of 350-450 oC with the concentration of
sulfuric acid 0-2 wt.% and reactions time of 30-90 minutes This reaction was in accordance to the pseudo-order kinetics with the assumption the cracking reaction was the rate limiting step and used 6-lumps models. The advantage of this model was able to predict the main products of liquid fuel. The estimated kinetic parameters, as well as good agreement between model and experimental data were obtained. Concentration expressions of lumping species at the outlet of the reactor have been obtained. Reaction rate constants and model parameters have been estimated with the method and ex-perimental data. Secondary reactions occurred in diesel products compared to gasoline and kerosene. The simulated results have shown that reaction time for 90 minutes, 450 oC and
catalyst concentration 0.5 wt.% favored the
pro-duction of liquid fuels with a high selectivity for gasoline fraction and the lowest number of coke.
Acknowledgments
This work was financially supported by the Directorate General of Higher Education of the Republic of Indonesia for financial support un-der grant (Fundamental Research No. DIPA-023.04.2.189822/2013 and No. 2.14.5/PPK.3.1/ 2013. The authors would like to thank to Uni-versitas Negeri Semarang have supported in this research.
References
[1] Puhan, S., Vedaraman, N., Rambrahaman, B.V., Nagarajan, G. (2005). Mahua (Madhuca indica), Seed Oil: A Source of Renewable Energy in India. Journal of Scientific and In-dustrial Research, 64: 890-896.
[2] Demirbas, A. (2007). Progress and Recent Trends in Bio-fuels. Progress in Energy and Combustion Science, 33(1):1-18.
[3] Ramadhas, A.S., Muraleedharan, C., Jayaraj, S. (2005). Performance and Emission Evalua-tion of A Diesel Engine Fueled with Methyl Esters of Rubber Seed Oil. Renewable Energy, 30: 1789-1800.
[4] Morshed, M., Ferdous, K., Khan, M.R., Ma-zumder, M.S.I., Islam, M.A., Uddin, M.D.T. (2011). Rubber Seed Oil as A Potential Source for Biodiesel Production in Bangladesh. Fuel, 90: 2981-2986.
[5] Ikhuoria, E. Ui, Aigbodion, A. I., Okieimen F. E. (2004). Enhancing the Quality of Alkyd Resins using Methyl Esters of Rubber Seed Oil. Tropical Journal of Pharmaceutical Re-search, 3(1): 311-317.
[6] Twaiq, F., Mohamed, A. R., Bhatia, S. (2004). Catalytic Cracking of Palm Oil into Liquid Fuels: Kinetic Study. In Proceedings of The Seventh Asia-Pacific International Sympo-sium on Combustion and Energy Utilization, 1-8.
[7] Taufiqurrahmi, N., Mohamed, A. R., Bhatia, S. (2011). Nanocrystalline Zeolite Beta and Zeolite Y as Catalysts in Used Palm Oil Cracking for The Production of Bio-fuel. Jour-nal of Nanoparticle Research, 13: 3177-3189.
[8] Charusiri, W., Yongchareon, W., Vitidsant, T. (2006). Conversion of Used Vegetable Oils to Liquid Fuels and Chemicals Over HZSM-5, Sulphated Zirconia, and Hybrid Catalysts,
Korean Journal of Chemical Engineering, 23: 349-355.
Bulletin of Chemical Reaction Engineering & Catalysis, 10 (1), 2015, 60
[9] Ramya, G., Sudhakar, R., Amala I.J.J, Rama-krishnan, R., Sivakumar, T., (2012). Liquid Hydrocarbon Fuels from Jatropha Oil through Catalytic Cracking Technology using AlMCM-41/ZSM-5 Composite Catalysts. Applied Ca-talysis A: General 433-434: 170-178.
[10] Li, H., Shen, B., Kabalu, J.C., Nchare, M. (2009). Enhancing The Production of Bio-fuels from Cottonseed Oil by Fixed-Fluidised Bed Catalytic Cracking. Renewable Energy, 34: 1033-1039.
[11] Li, L., Quan, K., Xu, J., Liu, F., Liu, S., Yu, S., Xie, C., Zhang, B., Ge, X. (2014). Liquid Hy-drocarbon Fuels from Catalytic Cracking of Rubber Seed oil using USY as Catalyst. Fuel, 123: 189-193.
[12] Cole-Hamilton, D.J. (2003). Homogeneous Ca-talysis--New Approaches to Catalyst Separa-tion, Recovery, and Recycling. Science, 14(299): 1702-1706.
[13] Sedighi, M., Keyvanloo, K., Towfighi, J. (2004). Kinetic Study of Steam Catalytic Cracking of Naphtha on A Fe/ZSM-5 Catalyst.
Energy & Fuel, 18: 1555-1561.
[14] Leng, Y.T., Mohamed, A.R, Bhatia, S. (1999). Catalytic Conversion of Palm Oil to Fuels and Chemicals. The Canadian Journal of Chemi-cal Engineering, 77: 156-162.
[15] Ooi, Y.S., Yakaria, R., Mohamed, A.R., Bhatia, S. (2004). Catalytic Conversion of Palm Oil-based Fatty Acid Mixture of Liquid Fuel, Biomass and Energy, 27: 477-484.
[16] Ancheyta-JuaÂrez, J., LoÂpez-Isunza, F., Aguilar-RodrõÂguez, E.. (1999). 5-Lump ki-netic model for gas oil catalytic cracking.
Applied Catalysis A: General, 177: 227-235.
[17] Kittigowittana, K., Wongsakul, S., Kris-daphong, P., Jimtaisong, A, Saewan, N. (2013). Fatty Acid Composition and Biological Activities of Seed Oil from Rubber (Hevea brasiliensis) Cultivar RRIM 600. Interna-tional Journal of Applied Research in Natural Products. 6(2): 1-7.
[18] de Klerk, A. (2007). Thermal Cracking of Fischer-Tropsch Waxes. Industrial &
Engi-neering Chemical Research, 46: 5516-5521.