STRATEGY SELECTION TO REDUCE WORK ORDER ACTIVE IN
MAINTENANCE TEAM USING SMART METHOD
Boby Marjaya Hariandja1, Utomo Sarjono Putro1
1School of Business and Management, Institut Teknologi Bandung, Indonesia Email: [email protected]
Abstract
Electrical department team in PT.NYZ had main responsibility to maintain continuity of electric power supply in Sumatera operation. Electrical department provide supply electricity to producer wells, office and housing. To support its daily operation the team consist of two department, operation and maintenance team. Maintenance team is responsible for preventive maintenance (PM), predictive maintenance (PdM) and corrective job. Maintenance activities of transmission and distribution lines without shutdown the energize line called Hot Line Work. With hotline work activities could prevent production loss during maintenance job. Based on Computerized Maintenance Management System data in 2015 there were 432 work order active in electrical maintenance team. Work orders active are number of active work orders in open status at the end of the month and not shutdown classification, 278 of 432 work order active are under maintenance power line team. In this study we propose alternatives to reduce work order active in power line team.
In this study fish bone diagram and pareto chart is applied to analyze the problem and find the root of problem. Simple Multi Attribute Rating Technique (SMART) used in decision making process. SMART is used in this study because with this method allow complex problem to be decomposed into sets of simpler judgment. This simplicity influences directly on the understanding of the decision maker about the process used in the solution of the problem since the decision making process involving many decision makers from various background. The TOWS matrix is used in alternative generation. Brainstorming tool is used in attribute identification. Interval scale form is used in measuring the weight of attribute and attribute value to each alternative.
From TOWS matrix there were four (4) alternatives generated. Alternative 1: Purchase new bucket truck by PT.NYZ and operator of bucket truck from PT.NYZ employee. Alternative 2: Purchase new bucket truck by PT.NYZ and the operator of bucket truck provided by labor contract. Alternative 3: Contract out bucket truck using lump sum type contract and the operator of bucket truck from PT.NYZ employee. Alternative 4: Contract out bucket truck and operator using work unit rate type contract.
From the study result alternative 3 was chosen as the selected alternative. The consideration from decision makers are: safety aspect, with alternative 3 operator for bucket truck will provided from PT.NYZ employee and this work categorized on high risk job; from sensitivity analysis the alternative 3 is the robust; availability in market and permit administration that currently as the main issue, with contractor provide the bucket truck including maintenance and permitting with lump sum type contract it could improve availability of bucket truck and reduce number of work order active in power line maintenance team.
ISSN: 2528-617X
INTRODUCTION
To maintain a reliable and safety in operation for providing electricity maintenance activities should be do regularly based on time schedule. There are two approaches in maintenance strategies: corrective maintenance and preventive maintenance (Nakagawa, 2005), (Hilber et al., 2007:1675-1682). Corrective maintenance is conduct based on equipment failure in field.
Different from corrective maintenance, preventive maintenance is maintenance activities to prevent the equipment run to failure. Preventive maintenance can be divided into time based maintenance and condition based maintenance (Lehtonen, 2006). Time based maintenance use regular and scheduled intervals based on service history of equipment (Li, Brown, 2004:439), while condition based maintenance is refer to the condition and state of equipment when fall below acceptable standard.
Electricity has been playing an important role in all industry sectors, from small home industry until large scale manufacture industry. Electricity is also included as one of the vital role in oil and gas industry. In PT.NYZ, has electrical department that accountable in generating power and steam, also delivering electricity to more than 7,000 producer wells with 350,000 BOPD (barrel oil per day) throughout 3,000 km long of overhead lines with various voltage levels. The lines are divided into transmission (44 kV, 115 kV & 230 kV) and distribution (4.16 kV & 13.8 kV). All of production facilities are connected to distribution lines that have dynamic change based on requirement of customer and maintenance team.
In transmission and distribution line point of view, corrective and preventive activities require resources to conduct maintenances. Maintenance activities could be performed during offline or energized condition that is named Hot Line Work (HLW). The easiest and safest way to conduct maintenance in distribution line is by opening the feeder breaker to disconnect power, but it will cause production loss from hundreds of tied-in wells.
Uhats why power line maintenance team conducts Hot Line Work for maintenance in transmission and distribution line system.
First Hot Line Work was conducted on 1977 and many improvements on safety have been implemented ever since. The main hazard in this work is arc-flash: electrical explosion that is resulted from a low impedance connection to ground or another voltage phase in an electrical system. And for activity above ground the additional hazard is falling due to gravity. Since this activities need high skill and competency, safety is the highest priority in executing the job safely in order to eliminate minor and major injuries even fatality for the worker. As pioneer in hotline work in PT.NYZ as well as in Indonesia, electrical department has been continuously evaluating and improving Hot Line Work which currently adopted as industrial practice by managing expertise through personnel qualification evaluation and certification.
measured in operating matrix scorecard. In 2015 the production loss is higher than original plan or target.
Based on Computerized Management Maintenance System (CMSS) data on
Eecember 3126 XP active in power line team were 389 work orders its about 75& from
total active work order in maintenance team. Work orders active are number of active work orders in open status at the end of the month and not shutdown classification. Key performance indicator for maintenance metric in electrical department was to reduce WO active 20% from baseline in the January 2016. With this condition trending of WO active is increasing 83 WO from 349 WO in January to 432 WO in December 2015 (increase about 24%). In this study will analyze high number of WO active in power line maintenance team on 2015 and find alternative solution for this problem. High number of work order active also contributes for high production loss in 2015
In this study fish bone diagram and pareto chart is applied to analyze the problem and find the root of problem. Simple Multi Attribute Rating Technique (SMART) used in decision making process. SMART is used in this study because with this method allow complex problem to be decomposed into sets of simpler judgment. This simplicity influences directly on the understanding of the decision maker about the process used in the solution of the problem since the decision making process involving many decision makers from various background. The TOWS matrix is used in alternative generation. Brainstorming tool is used in attribute identification. Interval scale form is used in measuring the weight of attribute and attribute value to each alternative.
REVIEW OF LITERATURE
Fish Bone Diagram
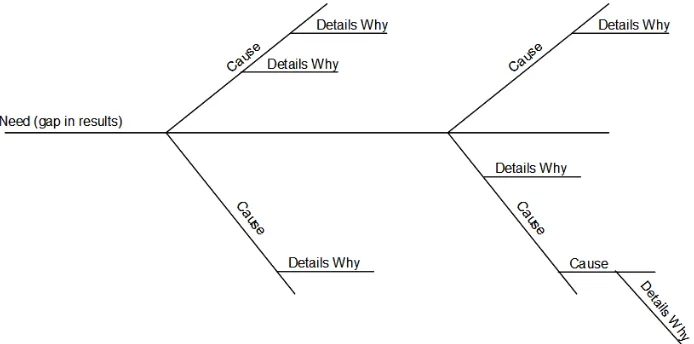
Fishbone or Ishikawa diagram has purpose tto help teams push beyond symptoms to uncover potential root causes, to provide structure to cause identification effort and to ensure that a balanced list of ideas has been generated during brainstorming or that major possible causes are not overlooked. (Michael L George, 2005 : 146)
ISSN: 2528-617X
Cause and effect diagram will identify a variety of potential causes of the effects or problems, and analyze the problem through brainstorming sessions. The problem will be split into a number of categories related, including human, material, environment, measurement, method, and machine. Each category has causes that need to be elaborated through brainstorming sessions
Pareto chart
A Pareto diagram is a simple bar chart that ranks related measures in decreasing order of occurrence. The principle was developed by Vilfredo Pareto, an Italian economist and sociologist who conducted a study in Europe in the early 1900s on wealth and poverty. He found that wealth was concentrated in the hands of the few and poverty in the hands of the many. The principle is based on the unequal distribution of things in the universe. It is the law of the "significant few versus the trivial many." The significant few things will generally make up 80% of the whole, while the trivial many will make up about 20% (PQ system, 2016).
Simple Multi Attribute Rating Technique (SMART)
SMART has been widely applied because of its relative simplicity and transparency, which means that decision makers from many different backgrounds can easily apply the method and understand its recommendations. Although SMART may not always capture all the detail and complexities of a decision, it can be an excellent method for illuminating the important aspects of the problem and how they relate to each other (Goodwin et. al., 2010 : 33-34).
Using SMART method, the performance of each alternative is expressed in grades on a numerical scale, which is evaluated through a direct-rating procedure. In practical applications the grades are typically interpreted as category labels (such as cheap, somewhat more expensive, more expensive, etc, or excellent, good, fair, unsatisfactory) (Makowski, 2001).
Simplicity of the questions done to the decision maker and the easiness of the analysis that it is done on the answers are the great advantage of SMART. This simplicity influences directly on the understanding of the decision maker about the process used in the solution of the problem. However, this simplicity presents a cost that consists in the simplifications done for the problem, through the hypotheses of linearity of the one-dimensional utility functions and of independence addictivity (Filho, et. al., 2005).
Guidance for using SMART based on Goodwin and Wright as below : 1. Stage 1: identify the decision maker (or decision makers)
2. Stage 2: identify the alternative course of action
3. Stage 3: identify the attributes that are relevant to the decision problem
5. Stage 5: determine a weight for each attribute. This may reflect how important the attribute is to the decision maker
6. Stage 6: for each alternative, take a weighted average of the values assigned to that alternative.
7. Stage 7: make a provisional decision
8. Stage 8: perform sensitivity analysis to see how robust the decision is to change in the figures supplied by the decision maker (Goodwin et. al., 2010: 34).
Based on literature book of Paul Goodwin, There are essentially two approaches to the problem: mathematical and behavioral aggregation (although the approaches can be combined). Mathematical aggregation, which we will discuss first, involves techniques such as the calculation of a simple average of the judgments of the individual group members. In behavioral aggregation a group judgment is reached by members of the group communicating with each other either in open discussion or via a more structured communication process. There are a number of advantages to be gained by using mathematical aggregation to combine the judgments of the individual members of a group. In particular, the methods involved are relatively straightforward. This means that the more complex and time-consuming procedures of behavioral aggregation are avoided. Moreover, the group members do not have to meet. Their judgments can be elicited by telephone, post or computer and therefore the influence of dominant group members is avoided (Paul Goodwin, 2004: 309-310).
Table 1 Expert Focus Group Discussion (Number = 5)
Years of Experience Number
IS
ISSN: 2528-617X
Data collection methods in this study are using interview, field observation and Focus Group Discussion. People involve were representative from cross functional department. From Electrical department involve Team Manager Maintenance South, Team Manager Maintenance North, Team Leader Power line Maintenance South, Manager Maintenance and Team Leader Planning & Support. The expert parties involved on the FGD session is shown on Table 1.
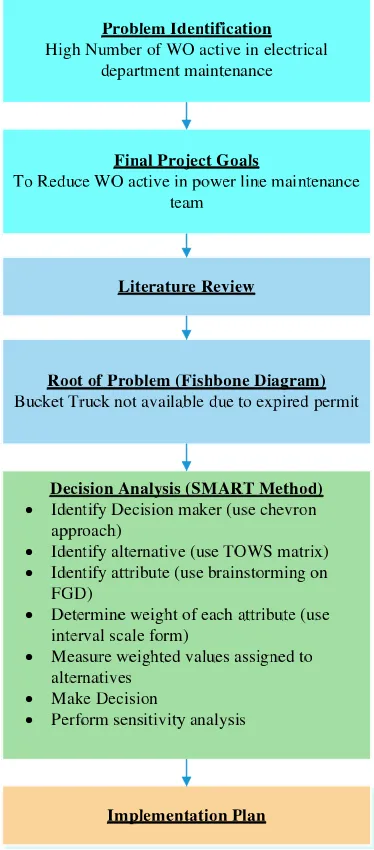
Problem Identification
High Number of WO active in electrical department maintenance
Final Project Goals
To Reduce WO active in power line maintenance team
Root of Problem (Fishbone Diagram)
Bucket Truck not available due to expired permit
Decision Analysis (SMART Method)
+ Identify Decision maker (use chevron
approach)
+ Identify alternative (use TOWS matrix) + Identify attribute (use brainstorming on
FGD)
+ Determine weight of each attribute (use
interval scale form)
+ Measure weighted values assigned to
alternatives
+ Make Decision
+ Perform sensitivity analysis
Implementation Plan Literature Review
Figure 2. Methodology Flow Chart
FINDINGS AND DISCUSSION
The SO strategy (maxi-maxi) is strategies that use the internal strengths to take advantage of external opportunities. Electrical department strength as the expertise to use
bucket truck for hotline work method and the opportunity is power load forecast its still
same for next 5 years. To maximize the strength and opportunity Electrical department should keep the number of bucket truck by purchase new bucket truck and operator using PT.NYZ employee to maintain competency people that had expertise for operate bucket truck.
The ST strategy (maxi-mini) is utilization of the strengths in order to avoid or reduce the effects of external threats. To fulfill this strategy Electrical department could purchase new bucket truck and the operator of bucket truck provided by labor contract, that training and development for operator under responsibility Electrical Department.
The WO strategy (mini-maxi) aim at reducing internal weaknesses by taking advantage of external opportunities. To fulfill this strategy Electrical department could create new contract based on lump sum contract for bucket truck. The operator of bucket truck still PT.NYZ employee. The advantage of lump sum contract the payment to contractor is same every month not depend on number of job, permit administration and bucket truck maintenance under contractor responsibility
The WT strategy (mini-mini) is strategy to minimize weakness and threat. To fulfill this strategy electrical department could create new contract based on work unit rate contract for bucket truck and operator. With this strategy if PT.NYZ permits expired in 2021 to operate Rokan block, all bucket truck asset and severance of bucket truck operator become contractor responsibility.
Attribute used on this study is generated from Focus Group Discussion using brainstorming. For benefits group, the attributes are safety, service quality, availability and market attractive. For cost group, the attributes are operating cost and severance cost. After attribute identified, the next step is assigns value to measure the performance of the alternatives on that attribute. Cost attributes are counted based on the cost required for each alternative from 2017 until end of Production Sharing Contract Expiration in 2021. For benefit attributes, since this decision involve groups of individuals, interval scale form is used and mathematical aggregation is used to calculate it.
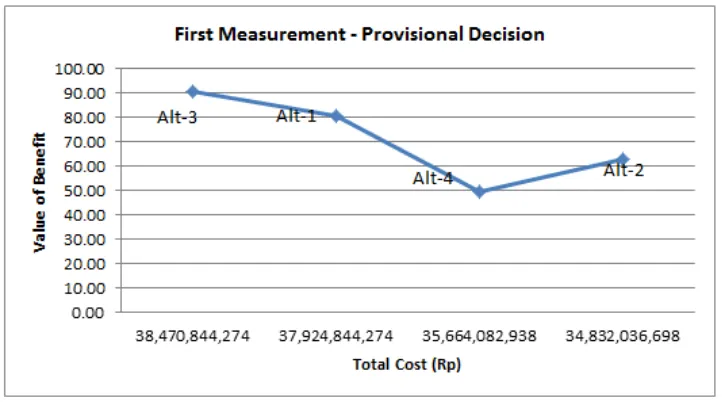
Total benefit value and total cost of each alternative is compared to make provisional decision. Decision Makers agreed to conduct two times comparison. First is comparing all alternatives using total benefit of 3 attributes (safety, service quality and availability) with total cost. Chart comparison of 1st measurement is shown in Figure 3.
ISSN: 2528-617X
Figure 3. First Measurement•Provisional Decision
Alternative 2 - purchase new bucket truck and adding the operator of bucket truck provided by labor contract •based on the figure 3.5 as the third with total benefit point is 62.75 with total cost about Rp. 34.8 billion. The total operating cost is the lower between alternative 1, 3 and 4. Attribute safety and service quality got the highest point because the two attributes still could control by Electrical department since the operator training and people development for employee contractor still under control Electrical department.
Alternative 3 - create new contract for bucket truck based on lump sum contract and operator using PT.NYZ employee • based on the figure 3.5 as the first with total benefit point is 90.69.The point is almost same with alternative 1 with difference about 10 point. Total cost required about Rp. 38.4 billion. Attribute safety and availability got the highest point for alternative. With this alternative strategy bucket truck administration for permit
and maintenance under contractor responsibility its should increase availability of bucket
truck and maintain safety aspect since using PT.NYZ employee.
Alternative 4 - Contract out bucket truck and operator using work unit rate type contract•based on the figure 3.5 as the fourth with total benefit point is 49.16. Total cost required about Rp. 35.6 billion. Attribute availability got the highest point. With this alternative strategy bucket truck administration for permit and maintenance under contractor responsibility but Electrical department need to ensure skill and competency for operator
since its provided by contractor/
On figure 3 blue lines is efficient frontier. The choices for the alternatives depend on relative weight the decision maker attached to the cost and benefit. If the decision maker concern about benefit should choose alternative 3. If decision maker concerned about cost should choose alternative 2. Alternative 1 should be the intermediate choice, the cost lower than alternative 3 but only different 10 point for value of benefit.
Based on above condition decision makers agreed to decide alternative 3 as the decision with consideration as below:
2. Alternative 3 has highest benefit value compare with alternative 1,2 and 4
3. With alternative 3 availability of bucket truck could improve, since maintenance and permit administration handled by contractor.
4. Electrical department could maintain safety and service quality aspect since using PT.NYZ employee as operator
Figure 4. Second Measurement•Provisional Decision
The different with first measurement it considers market attractive. Adding attribute market attractive and exclude alternative 1.Based on figure 3.6 alternative 3 got the highest point for value benefit with 88.95 its different 32.75 point compare with alternative 2 as the lowest. Total operating cost needed is about Rp.38.4 billion.
Alternative 2 - purchase new bucket truck and adding the operator of bucket truck provided by labor contract • based on the figure 3.6 as the third with total benefit point is 56.2 with total cost about Rp. 34.8 billion. The total operating cost is the lower between alternative 3 and 4. Attribute market attractive as the lowest point compare with other alternatives since contractor only got handling fee.
Alternative 3 - create new contract for bucket truck based on lump sum contract and operator using PT.NYZ employee • based on the figure 3.6 as the first with total benefit point is 88.95. Total cost required about Rp. 38.4 billion. Attribute safety, service quality, availability and market attractive as the highest point compare with other alternatives. Since this contract using lump sum type there were clarity to contractor for provided bucket truck,
QU/OZ[ will paid contractor fixed every month to contractor remember its very rare in
market for bucket truck.
ISSN: 2528-617X
The decision makers agree to choose alternative 3 as decision. With consideration alternatives 3 got the highest point for attribute availability, safety, service quality and market attractive. The different cost between alternative 3 and alternative 2 as the lowest operating cost was not significant about Rp.2.5 billion for 5 years contract.
CONCLUSION
Based on business issue that already described in this paper there were high numbers of work order active in Power Line maintenance team. By using fish bone diagram and pareto chart, the root of problem was bucket truck was not available due to expired permit.
In this final project SMART method used to find the alternative and solution to face this problem. This decision analysis process involves many decision makers that are group in focus group discussion. From TOWS matrix there were four (4) alternatives generated. Alternative 1: Purchase new bucket truck by PT.NYZ and operator of bucket truck from PT.NYZ employee. Alternative 2: Purchase new bucket truck by PT.NYZ and the operator of bucket truck provided by labor contract. Alternative 3: Contract out bucket truck using lump sum type contract and the operator of bucket truck from PT.NYZ employee. Alternative 4: Contract out bucket truck and operator using work unit rate type contract.
Alternative 1 was in third place for operating cost about Rp 37,9 billion and in second place for total benefit with 80.44 point. Alternative 2 was in first place with operating cost about Rp 34.8 billion (the lowest cost) and in third for total benefit with 62.75 point. Alternative 3 was in place fourth for operating cost about Rp 38.4 billion (the highest cost) and in first place for total benefit with 90.69 point. Alternative 4 was in second place for operating cost about Rp 35.6 billion and in fourth place for total benefit with 49.16 point.
From the study result alternative 3 was chosen as the selected alternative. The consideration from decision makers are: safety aspect, with alternative 3 operator for bucket truck will provided from PT.NYZ employee and this work categorized on high risk job; from sensitivity analysis the alternative 3 is the robust; availability in market and permit administration that currently as the main issue, with contractor provide the bucket truck including maintenance and permitting with lump sum type contract it could improve availability of bucket truck and reduce number of work order active in Electrical department.
REFERENCES
Filho, A.T.D., Cavalcante, C.A.V., Costa. A.P.C.S., 2005, Multi Criteria Decision Making on Selection of Decision Analysis Software, Journal of Academy of Business and Economics, 5:n.pag.
Goodwin, Paul, Wright, George, 2009, Decision Analysis for Management Judgement, A John Wiley and Sons, Ltd., Publication.
http://www.mindtools.com/brainstm.html [Accessed on 8 March 2016]
Lehtonen, M., 2006, On Optimal Strategies of Condition Monitoring and Maintenance Allocation in Distribution Systems, Proceedings of 9thInternational Conference on Probabilistic Methods Applied to Power Systems KTH.
Makowski, M., 2001, Multi Objective Decision Support Including Sensitivity Analysis,
Encyclopedia of Life Support Systems, 3:n.pag.
Michael L. George et al, 2005, The Lean Six Sigma Pocket Toolbook: A Quick Reference Guide to Nearly 100 Tools for Improving Process Quality, Speed, and Complexity, New York : McGraw-Hill.
Nakagawa, T., 2005, Maintenance Theory of Reliability, Springer-Verlag London Limited.
PQ system.com, 2015, pareto diagram aceesed on 2 March 2016 from
http://www.pqsystems.com/qualityadvisor/DataAnalysisTools/pareto_diagram.php