System Dynamic Approach to Support Decision in Maintaining
Water Availability (Case Study in Aek Silang Sub-Watershed, the
Lake of Toba)
Irwan Valentinus Sihotang*,1, Sudarmadji2, Ig.L.Setyawan Purnama2 and M. Baiquni2 1Doctoral Program of Environmental Sciences, UGM,
Jl. Teknika Utara, Bulaksumur, Yogyakarta 55281.
2Faculty of Geography UGM, Jl. Kaliurang, Bulaksumur, Yogyakarta 55281 *) Corresponding author (e-mail: [email protected])
Abstract. :DWHUDYDLODELOLW\LVLPPHQVHO\DIIHFWHGE\WKHFRUUHODWLRQDPRQJODQGXVHFKDQJH
UDLQIDOOFKDQJHDQGSRSXODWLRQJURZWK2QHRIDQDO\VLVWRROVWRGLVFRYHUKRZWKHFRUUHODWLRQ JRHVRQLQDK\GURORJLFDOSURFHVVLVE\G\QDPLFPRGHOOLQJDSSURDFKLQJ7KHG\QDPLFPRGHOOLQJ UHVXOW FDQ EH XVHG IRU D VXEVWUXFWXUH LQ GHFLVLRQV PDNLQJ DV VXSSRUWV WR PDLQWDLQ ZDWHU DYDLODELOLW\IRUIXOÀOOLQJGRPHVWLFQHHGVDJULFXOWXUHDQG0LFUR+\GUR3RZHU0+37KHDLPV RIWKLVVWXG\DUHWRHYDOXDWHZDWHUDYDLODELOLW\DVDORQJWHUPLPSDFWRQODQGXVHFKDQJHUDLQIDOO FKDQJHDQGSRSXODWLRQJURZWKZLWKG\QDPLFPRGHOOLQJDQGDVDVFHQDULRZKLFKLVUHTXLUHG DV EDVLF LQIRUPDWLRQ WR PDNH GHFLVLRQV LQ PDLQWDLQLQJ ZDWHU DYDLODELOLW\ $QDO\VLV PHWKRG ZKLFKLVDSSOLHGLQWKLVVWXG\LVG\QDPLFPRGHOOLQJWRORQJWHUPHYDOXDWHZDWHUDYDLODELOLW\DQG YDOLGDWHXVLQJ0HDQ$YHUDJH3HUFHQWDJH(UURUPHWKRG0$3(7KHDQDO\VLVVKRZHGWKDWWKH FRPELQDWLRQRIUDLQIDOORIPP\UUDLQIDOOLQWHQVLW\RIPPKSRSXODWLRQJURZWK
UDWHRIGHFOLQHGIRUHVWDUHDRIKD\UGHFOLQHGVKUXEXQSURGXFWLYHODQGRI
KD\ULQFUHDVHGDJULFXOWXUDOODQGRIKD\UDQGLQFUHDVHGVHWWOHPHQWDUHDRIKD\U \LHOGHGWKHHVWLPDWLRQRIWKHIDLOLQVXVWDLQLQJZDWHUVRXUFHVLQRUWKHQH[W\HDUVIURP VLQFHWKHZDWHUGHÀFLWKDVUHDFKHGDSSUR[LPDWHO\P7KHYDOXHRIYDOLGDWLRQ PRGHOOLQJZLWK0$3(PHWKRGLVLWLVDG\QDPLFPRGHOOLQJZKLFKLVPDQDJHGQHDUO\WKH VDPHZLWKDFWXDOFRQGLWLRQ
Keywords: ODQG XVH SRSXODWLRQ JURZWK ZDWHU FRQVXPSWLRQ ZDWHU DYDLODELOLW\ G\QDPLFV PRGHOOLQJ
Abstrak. Hubungan antara perubahan penggunaan lahan, perubahan curah hujan dan pertumbuhan penduduk sangat mempengaruhi ketersediaan air. Salah satu alat analisis untuk mengetahui bagaimana hubungan tersebut terjadi dalam suatu proses hidrologi adalah dengan pendekatan pemodelan dinamis. Sehingga, hasil pemodelan dinamis tersebut dapat digunakan sebagai dasar pengambilan kebijakan sebagai upaya mempertahankan ketersediaan air untuk memenuhi kebutuhan domestik, persawahan dan micro-hydro power (MHP). Tujuan pemodelan adalah untuk mengevaluasi ketersediaan air sebagai dampak perubahan penggunaan lahan, perubahan curah hujan dan pertumbuhan penduduk dalam jangka panjang dengan pemodelan dinamis dan skenario yang dibutuhkan sebagai dasar untuk mempertahankan ketersediaan air. Hasil penelitian menunjukkan bahwa dengan curah hujan 2.312,09 mm/tahun dan intensitas curah hujan 0,340 mm/jam, laju pertumbuhan penduduk 7,23%, penurunan luas lahan hutan 1,513 ha per tahun, penurunan semak belukar/lahan tidak produktif 318,113 ha per tahun, peningkatan lahan pertanian 7,627 ha per tahun dan peningkatan kawasan pemukiman 0,473 ha per tahun, maka keberlanjutan air tidak tercapai pada tahun 2090 atau 79 tahun yang akan
GDWDQJ GDUL WDKXQ NDUHQD NHEHUODQMXWDQ DLU VXGDK GH¿VLW VHEDQ\DN 881,02 m3.
Validasi model sebesar 8,90 artinya model yang disusun hampir menyerupai kondisi aktual.
1. Introduction
Land use design which is less attention to land condition will guide damage to water system, it interferes water resource availability and not be able to ful l water need of humans, animals, plants, agricultures, and industry electricity (Muta’ali, 2011). According to The Indonesia National Board for Disaster Management (2015) that the disruption of water availability in several regions of Indonesia, including Magelang, Gresik, and East Nusa ow (Liu, 2005; Hartono, et al., 2006; Asdak, 2010; Indra, 2013).
Land use changes, in fact, are closely associated with the precipitation changes. However, land use for forest vegetation was evidenced to possess high evapotranspiration and humidity level in compared with other covers, which led to higher rainfall level in the region. The higher the rate of forest land conversion, the higher the rate of rainfall disruption (Zeppel, et al., 2014; Asner, et al., 2010; Igbawua, etal., 2016; Asdak, 2010).
The water availability becomes a serious problem when the demand constantly increases, while the water supply is declining. The hydrological phenomenon is very complex and it is very di cult to understand it entirely (Indarto, 2010). Thus, models to simplify and facilitate the phenomenon is required, one of the models is the dynamics model. ome positive points of dynamic modelling are increasing the understanding about phenomenon easier, forecast, and decision making easier (Purnama, et al., 2006; Chung, et al., 2008, Hartrisari 2007, Purnomo, 2012).
iang, et al., 2012; Mirchi, et al., 2012; otir, et al., 2016 explained that the impact of changes in
factors, a ect to water availability, such as land use change, rainfall change, and type of water use can be known by applying dynamic modelling system. Besides, the function of dynamic modelling is to inform the long term condition of water availability, whether it can ful l water need in the future or not.
The result of dynamic modelling from scenario result which was conducted towards water availability factors_rainfall change, land use change, and population growth_ can be used as substructure consideration in decision making to support the maintaining of water availability (Xi and Poh, 2013;
otir, et al., 2016).
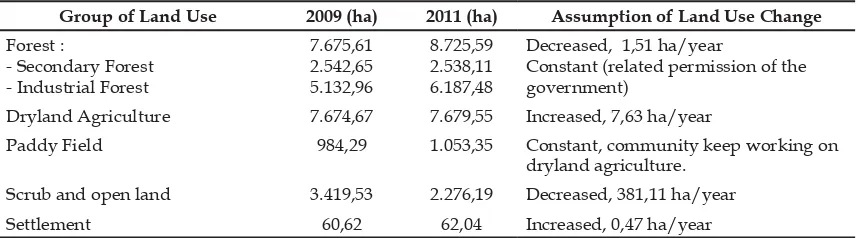
Toba lake is the largest lake in Indonesia (r 116.002,06 ha), has one of sub watershed which remains running its function as permanently water supplier (a whole year) to Toba Lake named Aek ilang ub atershed (19.814,72 ha). Not only running for ful lling domestic needs but also for agriculture and Micro Hydro Power (MHP). In the other hand, the rate of land use change in Aek ilang ub atershed is high, it a ects to water availability in the area. According to Ministry of Forestry in the results of the reviews of critical land preparation, 2014 stated that Toba Lake watershed is in the priority list to be rehabilitated. By applying dynamic modelling, this study will generate some activities to rehabilitate Toba Lake watershed e ciently and e ectively.
The aims of this study are to evaluate water availability as the long term impact of land use change, rainfall change, and population with dynamic modelling and as a scenario which is required as basic information to make decisions in maintaining water availability.
2. Research Methods a. Time and Study Area
This study was carried out in uly 2014 to October 2014. Precisely, the study area was Aek ilang sub watershed located in Lake Toba Catchment Area (LTCA), North umatera Province (02° 15’ 00” N - 02° 30› 00» N and 98°
b. Research Design
Figure 1. Research Design
c. Type of Datum and Assumptions in Dynamic Modelling
Dynamics modelling is commenced by identifying the problem, making assumptions, constructing the model, determining a suitable analysis, interpreting analysis results, and performing the process of validation and implementation (Hartrisari, 2007; Sitompul, 2009; Wiyono, 2012). Development of a system dynamic modelling (SDM) that captures that the interactions and feedbacks between the population sector, water resource sub-sector and agricultural production sub-sub-sector
.RWLU HW DO '\QDPLF PRGHOOLQJ ZDV
applied by using Software Power Sim 2.5 c. The data since 2011 (based on the collected data) was the input of the modelling that was projected to the next 89 years (2010) to foresee the water availability.
(TXDWLRQVDQGDVVXPSWLRQRIHDFKIDFWRU
which is used in dynamic modelling to calculate water resource availability are mentioned below:
1) Rainfall (Climate Change)
Estimation of the mean rainfall for undulating or hilly areas is conducted by using
Isohyet method as it is highly accurate with relatively small error level, which is 0.1% - 4.7% (Purnama 2008; Narulita, 2007). Analysis of rainfall in Aek Silang sub-watershed was carried out in 2003 – 2012 as obtained from
ÀYH UDLQIDOO VWDWLRQV LQFOXGLQJ 3DUDSDW
station, Lae Hole station, Sidikalang station, Gabehutaraja station, and Onan Runggu station. The mean rainfall was used as input to the dynamics modelling that depicted the potential of water sources in Aek Silang sub-watershed.
2) Land Use Changes
Land-use activities that change the
ODQGVFDSHRIDZDWHUVKHGIUHTXHQWO\DIIHFWWKH ZDWHU\LHOGWLPHDQGGLVSHUVLRQRIZDWHUÁRZ LQÀOWUDWLRQDQGZDWHUKROGLQJFDSDFLW\RIWKH
ground (Asdak 2010; Indra, 2013). The value or trend of the rate of each land use change should be minimised with several basic assumptions to maintain the conversed area remains even to the area of Aek Silang sub-watershed.
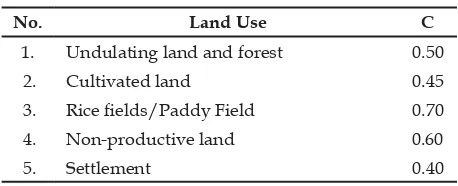
Basic assumptions related to the changes of land use as the input in dynamics modelling included data of land use/cover changes in 2009 –2011, can be found in Tabel 1.
Tabel 1.
Group of Land Use 2009 (ha) 2011 (ha) Assumption of Land Use Change
Forest :
Decreased, 1,51 ha/year
Constant (related permission of the government)
Dryland Agriculture ,QFUHDVHGKD\HDU
Paddy Field 984,29 1.053,35 Constant, community keep working on
dryland agriculture.
Scrub and open land 3.419,53 Decreased, 381,11 ha/year
Settlement Increased, 0,47 ha/year
S : I 2009 20
In case there was difference between total area of conversed land andtotal area of Aek Silang sub-watershed, the difference was used to increase or decrease total area of dry-land agriculture.
3) Water Demand ul llment
The water utilisation in the area of Aek Silang sub-watershed consisted into 3 (three) main types, namely domestic needs, agriculture, and Micro-Hydro Power (MHP) plant. The standard value of water demand of each sector enclosed in the dynamics modelling is represented in Appendix 3.
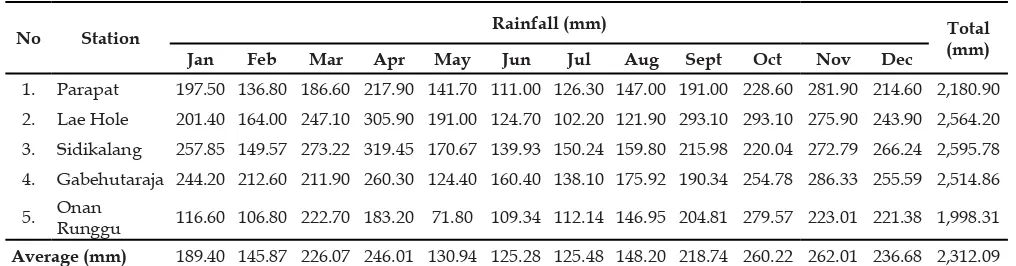
4) Calculation Method of Potential Water Utility (V)
Volume of water utility which can be used
LQD\HDULVFDOFXODWHGXVLQJWKHHTXDWLRQEHORZ
V = Q * t (1)
Nb :
V = Volume of using water (m3)
4 ZDWHUÁRZP3/second)
t = time of measurement 1 year
7KH YDOXH RI ZDWHU ÁRZ LV FDOFXODWHG E\
by 866RLO&RQVHUYDWLRQ6HUYLFH in 1973 (Asdak,
6WDQGDUG UXQRII FRHIÀFLHQWV & YDOXH RI
each land use that were included in the rational
HTXDWLRQDUHGHPRQVWUDWHGLQ7DEOH
Table 2.
No. Land Use C
1. Undulating land and forest 0.50
2. Cultivated land 0.45
3. 5LFHÀHOGV3DGG\)LHOG 0.70
4. Non-productive land
5. Settlement 0.40
S : 993 S S 980 in
20 0
Daily mean rainfall intensity (I) was
FDOFXODWHGE\XVLQJDQHTXDWLRQGHYHORSHGE\
Takeda (1993), as follows:
(3)
Where:
I = Rainfall intensity (mm/hr) R24 = Daily mean rainfall (mm/hr)
tc = Time of concentration or period from the upstream to the observed outlet (hr)
The value of rainfall intensity used in the dynamics modelling was the value that generated the peak runoff rate to supply the demand for agricultural irrigation and power plant. According to Hirijanto, et al. (2013), the peak runoff rate for irrigation and power plant is in the range of 80% - 95%.
d. Validation Modelling
Validation in this modelling is conducted
E\TXDQWLWDWLYHEHKDYLRXUSDWWHUQFRPSDULVRQ
(MAPE- Mean Absolute Percentage Error).
MAPE testing can be used to gain information about accuration between data assumption and
DFWXDOGDWD6RPDQWULGDQ0DFKIXG according to actual condition
- MAPE between 5% - 10% : modelling is arranged close actual condition
- MAPE > 10% : modelling is arranged different to actual condition
3. Results And Discussion
System dynamics modelling was employed to project the water availability. The
FRQFHSWLVGHULYHGIURPDGLIIHUHQWLDOHTXDWLRQ WKDWLVUHSUHVHQWHGE\WKHVWRFNDQGWKHÁRZ
thus, it is capable to illustrate the feedback
RU FDXVDOLW\ 6RHPDQWUL DQG 0DFKIXG
Purnomo, 2012).
The water sources utilisation in the Aek Silang sub-watershed, Lake Toba Catchment Area, was investigated to determine the status and to reveal the effect of dynamic factors such as population growth and land use changes.
a. Implementation Modelling
1) Rainfall
According to rainfall data in 2003 to 2012 in Aek Silang sub-watershed of 5 rainfall station, there are Parapat station, Lae Hole station, Sidikalan station, Gabehutaraja, and Ona Runggu station is resulted the average of rainfall with Isohiet method is listed in table 3.
Table 3. S S - 2003-20 2
No Station Rainfall (mm) Total
(mm)
Jan Feb Mar Apr May Jun Jul Aug Sept Oct Nov Dec
1. Parapat 197.50 217.90 141.70 111.00 147.00 191.00 281.90 2,180.90
2. Lae Hole 201.40 247.10 305.90 191.00 124.70 102.20 121.90 293.10 293.10 275.90 243.90 3. Sidikalang 257.85 149.57 273.22 319.45 139.93 150.24 159.80 215.98 220.04 272.79 2,595.78 4. Gabehutaraja 244.20 211.90 124.40 138.10 175.92 190.34 254.78 255.59
5. Onan
Runggu 222.70 183.20 71.80 109.34 112.14 204.81 279.57 223.01 221.38 1,998.31
Average (mm) 189.40 145.87 130.94 125.28 125.48 148.20 218.74 2,312.09
S : , 20 6
2) Volume of Potential Utilized Water Resources (V)
In accordance to previous rational calculation method, the C value was determined based on the trend of land use as explicated in Table 3 and the A value was total area of Aek Silang sub-watershed (19,814.72
KD 5DLQIDOO LQWHQVLW\ IURP HTXDWLRQ DQDO\VLV
(3) generated the peak runoff rate of 80 % - 95% was 0.340 mm/hr. Volume of potential utilized water resource analyzed by using dynamics modelling yielded the potential utilized water sources in 2011 – 2100 as demonstrated in Figure 3.
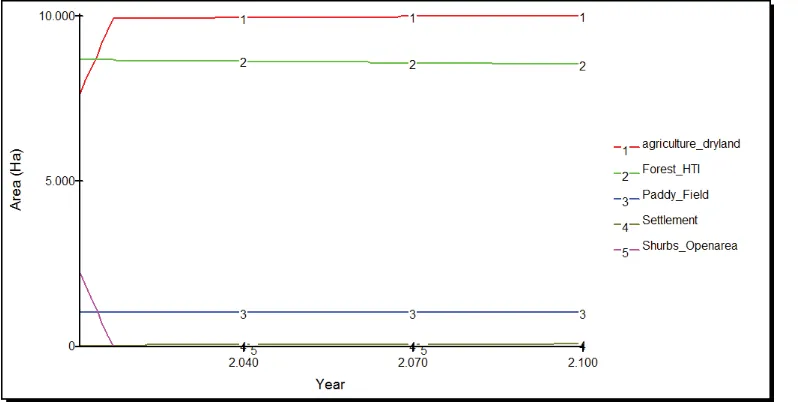
Figure 3. Graphic of The Using of Water Availability
Potentialwater assessedin this dynamics
modelling was derived from rainfall. Rainfall in the area of Aek Silang sub-watershed was the annual mean rainfall, which was 2,312.09 mm/year with a decreasing trend of rainfall 0.42 mm/year, so the water potential in Aek Silang sub-watershed was decreasing to be 83.222 m3/year.
The availability of potentially utilised water (discharge) showed a declining trend from 2011 to 2100. From the projection, the highest water depletion would be in 2011 to
ZKLFKLVP3 or approximately
1,711,391 m3 per year. It was allegedly due to
the land use change of shrubs/non-productive area that declines as much as 381.113 ha per year and was converted into agricultural land, which caused the leeway of rainfall into a runoff
ZDVORZHU,WZDVFRQÀUPHGE\6RHGDUMDQWRet
al. (2011); Asdak (2010); and Rachmat (2007),
who suggested the activities of land use that change a landscape of a catchment area at a large scale and permanently will affect the
TXDQWLW\RIZDWHU\LHOGUHODWHGZLWKWKHSURFHVV
of evapotranspiration and the water holding capacity of vegetation. The trend of rate of each
Figure 4. Graphic of The Change of Each Land Use
Evapotranspiration rate as depicted in Table 4 showed an increasing trend throughout
WKH\HDUZKLFKZDVP3 in 2011
and enhanced into 157,247,505.15 m3 in 2100.
Evapotranspiration in 2011 to 2017 augmented approximately 1,711.391 m3 per year, while in
DQGWKHVXEVHTXHQW\HDUVLWZDVSURMHFWHG
to enhance for 2,981 m3 per year. This condition
demonstrated the obvious association between land use type and evapotranspiration rate.
The link between land cover and evapotranspiration is directly proportional, the higher the vegetation growth rate, the higher the evapotranspiration rate. The studies carried out by Zeppel, etal. (2014), Soedarjanto, et al. (2011) and Asner, etal. (2010) concluded that the higher the density of canopy cover, the higher the evapotranspiration rate. It is due to the role of vegetation as a pump in the transformation of ground-water into vapour through the process of transpiration as well as the land use change from vacant land or forest into the agricultural land that affects the albedo, which reduces the soil surface roughness and eventually augments the evapotranspiration rate.
Water holding capacity (WHC) is the ability of soil to hold water which is affected by land use in each soil type. The value of WHC is derived by overlaying land use map and soil type, so WHC in Aek Silang sub-watershed
ZDVPPRUP3. Half of WHC
ZLOOÁRZDVEDVHÁRZVRWKHZDWHUUHPDLQLQ
the soil was 12.538.755 m3. WHC was assumed
to remain because the type of the soil did not change.
3) Water Demand Volume
Total water demand volume for domestic needs, agriculture, and power plant was estimated by using the dynamics modelling (with the values in Table 1 as the inputs), the results is presented in appendix 2. The rate of water demand in Aek Silang sub-watershed demonstrated at appendix 2 the increasing trend from year to year, which is in linear the rate of population growth (7.23%) and the rate of death 0,4%, meanwhile the estimated
ZDWHU GHPDQG IRU LUULJDWHG ÀHOG DQG 0+3
plant are stable. In 2011, total water demand
LQ $HN 6LODQJ VXEZDWHUVKHG ZDV
m3 DQG LW EHFRPHV P3 in 2100
or the next 89 years, on the other words, the water consumption increases approximately 145,087,120 m3 RU RU SHU \HDU
%DVHG RQ /LX DQG <DQLQJ LW ZDV
projected that in during the next 50 years, the water consumption rate in the western part of China will increase as much as 20%, while in the area of Aek Silang sub-watershed, the rate
ZLOOLQFUHDVHGXULQJWKHQH[W\HDUV
4) Reserve Water Availability Resource
contrary, if the water supply is lower than total water demand, there will be a water
GHÀFLW 7KH VWDWXV RI ZDWHU DYDLODELOLW\ FDQ
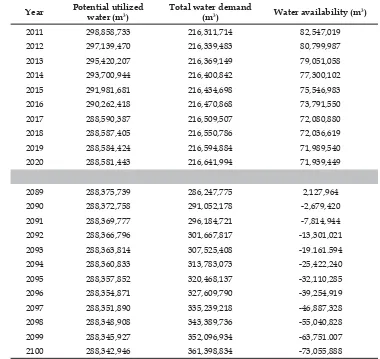
be determined as presented in Table 4.
Table 4. 20 2 00
Year Potential utilized water (m3)
Total water demand
(m3) Water availability (m3)
2011 298,858,733 82,547,019
2012 297,139,470 80,799,987
2013 295,420,207 79,051,058
2014 293,700,944 77,300,102
2015
73,791,550
2017 288,590,387 72,080,880
2018 288,587,405
2019 288,584,424 71,989,540
2020 288,581,443 71,939,449
2089 288,375,739
2090 288,372,758 291,052,178
2091 -7,814,944
2092 -13,301,021
2093 307,525,408
2094 313,783,073 -25,422,240
2095 288,357,852 -32,110,285
288,354,871 -39,254,919
2097 288,351,890 335,239,218
2098 288,348,908 -55,040,828
2099 288,345,927
2100 -73,055,888
S : , 20 6
Based on the analysis, it was estimated that the water availability in Aek Silang sub-watershed will meet the demand until 2089 or the next 78 years, where the water surplus
ZLOO EH P3. However, in 2090 the
ZDWHU GHÀFLW ZLOO RFFXU ZLWK HVWLPDWHG ZDWHU
GHPDQG LV P3. It was predicted
that in 2090, as many as 122,348 people will
HQGXUH ZDWHU GHÀFLW WR IXOÀO GRPHVWLF QHHGV
or 258,43 ha of farmland cannot be cultivated for 114,51 hours (4 days 19 hours) and MHP plant cannot generate electricity. It foresees the water availability sources fails due to at
FHUWDLQSHULRGZDWHUVXSSO\LVDGHÀFLWWRIXOÀO
domestic needs, agriculture, and MHP plant. Furthermore, the increased water shortage is mainly caused by the factor of high rate population growth, hence, water demand for domestic needs enhances while the water availability is lessened. The rate of water
availability is not proportional with the rate of domestic needs, in which the mean potential water volume is reduced arithmetically, which is approximately 2,981 m3 per year, meanwhile,
the population growth exponentially increases, which is 7.23% per year, even though there is death rate 0,004 or 0,4% per year.
The water availability is secure if a watershed/catchment area has the capacity to meet the water needs in the present time without disrupting the water supply for the future. Table 5 showed the environmental conditions of Aek Silang sub-watershed indicated the provision of sustainable water in 2089, with the rainfall intensity of 2,279.33 mm/year, forest
FRYHU RI KD DJULFXOWXUHFXOWLYDWHG ODQGRIKDVKUXEVYDFDQWODQGRI KDVHWWOHPHQWRIKDULFHÀHOGVRI
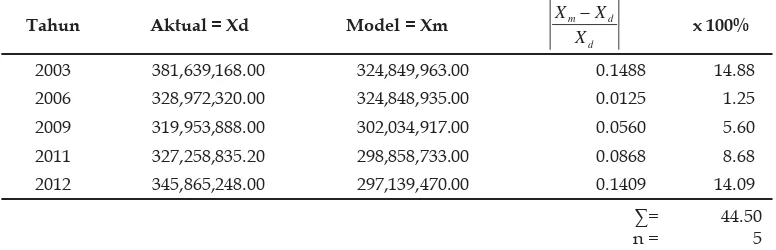
5) Validation modelling
The result of dynamic modelling of water availability which can be validated is in the year of modelling started, 2011-2012, and before the
\HDURIPRGHOOLQJVWDUWHG,W
is concluded that the number of the data is 5 data. Validation modelling in those years can be conducted because supporting data is
completely available to run dynamic modelling, for example wide of each land using, the number of human population, and actual water availability data which was collected from River Management on Board North Sumatera Province as comparison standard of simulation data. Dynamic modelling validation of water availability which can be used is performed in table 5.
The result of modelling validation is 8.90%, it is stated that condition of dynamic modelling which was conducted close to the actual condition.
b. Model Simulation
Dynamic modelling construction of potentially utilised water resource which
FDQ EH SURÀWHG LV SHUIRUPHG LQ $SSHQGL[
while dynamic model construction of water availability is performed in Appendix 5.
The condition of water volume which can be utilised from year to year as the impact of land use change (table 1) can be obtained from dynamic modelling construction (Appendix 4).
(DFK ODQG XVH KDV GLIIHUHQW UXQRII FRHIÀFLHQW
(C), so that every change of wide of land use
JHQHUDWHV WR WKH FKDQJH RI UXQRII FRHIÀFLHQW
in Aek Silang Sub-Watershed Lake Toba. That case will change the volume of water which can be used (V). The simulation of land use change can be done to gain information related the volume of water which can be utilised in
RUGHUWRIXOÀOZDWHUQHHG
Dynamic modelling construction (Appendix 5) results in the condition of water availability, whether the water can be utilised to meet water need or not. The simulation to
DFKLHYHORQJWHUPZDWHUDYDLODELOLW\LQIXOÀOOLQJ
water need can be done on some controllable factors such as the rate of land use change and the rate of population growth.
c. Design of Scenario to Reserve Water Resource
1) Decreasing Population Growth Rate
The decline of population growth rate is a factor which might become a solution to preserve the water availability. The expected population
JURZWKUDWHLVHTXDOWRWKHQDWLRQDOSRSXODWLRQ
growth rate, which is 1.4%. The population growth rate in 2100 with a growth rate of 1.4% is 33,757 people. With an assumption, the water consumption for domestic needs is 80 litres/individual/day, the volume of water demand is 985,710 m3 and the total water
consumption (domestic + agriculture + MHP
SODQWLVP3. It is projected that in
WKHYROXPHRIZDWHUXWLOLW\LV
m3 and the water availability is 71,452,103 m3.
It means that with a population growth rate of 1.4%, water availability can be attained.
The reduction of population growth
UDWH IURP WR UHTXLUHV WKH UROH RI
to preserve the environmental conditions of a watershed for achieving sustainable water sources.
2) The Combination of Population Growth Control and Land Use Plan
The rate of land use in dynamics modelling might be interfered since in the reality, the land use change is primarily performed by human factors instead of natural ones. Therefore, the expected rate of land use change can be strived in order to attain sustainable water availability. Based on Law No. 41/1999 on Forestry and Law
1RRQ6SDWLDO3ODQQLQJWKHSURWHFWHG
area is at least 30% of the total watershed area. In accordance with the laws, with a total area of 19,814.72 ha, Aek Silang sub-watershed should have 5,944.42 ha of forest cover area. Total forest cover and HTI is 2,781,170 ha, which makes the total protected area should be at least 8,725.49 ha. The changes of other types of land use were determined with the same assumption as mentioned above. It was
FRQÀUPHGE\.RWLUetalZKRVXJJHVWHG
the alternative policy scenarios (ie., Law No.
RQ)RUHVWU\DQG/DZ1RIRU
sustainable water resource management and land use management.
The results of dynamics modelling to predict the water availability by examining the combination of population growth rate by 1.4% and land use simultaneously yielded the water
VXUSOXVRIP3 in 2010. The simulation
of dynamics modelling by decreasing the population growth rate by 1.4% and land use, simultaneously, resulted a surplus of potential
ZDWHU VRXUFHV DPRXQWHG WR P3 in
compared with the result of mainly reducing the population growth, which was 71,452,103 m3.
4. Conclusion
Condition of environment which results the sustainable water resources utilization is
ZKHQWKHDUHDRIIRUHVWFRYHULVKDWKH DUHDRIDJULFXOWXUHFXOWLYDWLRQLVKD
the area of shrubs/open land is 0 ha, settlement
DUHDKDWKHDUHDRIULFHÀHOGLVKD
and total population is 2,408,995 persons. The change of land use affected to water resource availability which can be used because related to evapotranspiration and the ability of plant in holding water inside the soil. The water availability used was affected by people growth rate, so the control of people growth
UDWHLVUHTXLUHGWRPDLQWDLQZDWHUDYDLODELOLW\
The management of land use and people growth in the same time is an effective way to prevent water availability.
This study presents feasibility of system dynamics simulation as an assessment tool to support the decision for maintaining water availability. It presents the ability of system dynamics to support the decision by generating future water availability data with different scenarios.
5. References
Asdak, C., 2010. +LGURORJLGDQ3HQJHORODDQ'$6, Gadjah Mada University Press, Yogyakarta. Asner, G.P., Loarie, S.R., Heyder, U., 2010, Combined Effects of Climate and Land-use Change on
the Future of Humid Tropical Forests, &RQVHUYDWLRQ/HWWHUV, 3: 395–403.
Chung, G., Joong, H.K., Kim, T.W., 2008, System Dinamics Modelling Approach to Water Supply System, .6&(-RXUQDORI&LYLO(QJLQHHULQJ, Vol. 12, No. 4: 275-280.
+DUWRQR0HWHUD\7%6)DUGD10.DPDO0.DMLDQ(NRVLVWHP$LU3HUPXNDDQ5DZD
Biru – Torasi Merauke Papua Menggunakan Citra Penginderaan Jauh dan SIG, )RUXP
*HRJUDÀ, Vol. 20 (1) : 1 - 12
Hartrisari, 2007, 6LVWHP 'LQDPLN .RQVHS 6LVWHP GDQ 3HPRGHODQ XQWXN ,QGXVWUL GDQ /LQJNXQJDQ, Seameo Biotrop Institut Pertanian Bogor, Bogor.
Hirijanto, Subandiyah A., Edi H.D.P., Ibnu H.P.J., 2013, 0HWRGH *OREDO 3ODQWDVLRQ 6LVWHP XQWXN
$QWLVLSDVL'DPSDN3HUXEDKDQ,NOLP.DMLDQ'DHUDK,ULJDVL0ROHN.DEXSDWHQ0DODQJ, Konferensi Nasional Teknik Sipil 7 (KoNTekS 7) Universitas Sebelas Maret (UNS), Surakarta.
,JEDZXD7=KDQJ-&KDQJ4<DR)9HJHWDWLRQ'\QDPLFVLQ5HODWLRQZLWK&OLPDWH
Indarto, 2010, +LGURORJL'DVDU7HRULGDQ&RQWRK$SOLNDVL0RGHO+LGURORJL, PT.Bumi Aksara, Jakarta. Indra, T.L., 2013, Dampak Penggunaan Lahan Terhadap Tingkat Kekritisan Air Sub DAS Citarum
Hulu, 0DMDODK*HRJUDÀ,QGRQHVLD9R1R
Jiang, Q., Wang, Z., and Fu, Q., 2012, Dynamic Simulation of Water Resources Sustainable Utilization of Kiamusze Based on System Dynamics, &RPSXWHUDQG&RPSXWLQJ7HFKQRORJLHV
LQ$JULFXOWXUH9,²
.RWLU-+6PLWK&%URZQ*0DUVKDOO1-RKQVWRQH5$V\VWHPG\QDPLFVVLPXODWLRQ
model for sustainable water resources management and agricultural development in the Volta River Basin, Ghana, 6FLHQFHRIWKH7RWDO(QYLURQPHQWVol. 573 : 444 – 457.
Liu, Y., 2005, Land Use/Cover Changes, the Environment and Water sources in Northeast China,
(QYLURQPHQWDO0DQDJHPHQW9RO1R
/LX<<DQLQJ&,PSDFWRI3RSXODWLRQ*URZWKDQG/DQGXVH&KDQJHRQ:DWHUVRXUFHV
and Ecosystems of the Arid Tarim River Basin in Western China, ,QWHUQDWLRQDO-RXUQDORI
6XVWDLQDEOH'HYHORSPHQWDQG:RUOG(FRORJ\ Vol. 13: 295-305.
Mirchi, A., Madani, K., Watkins, D.Jr., Ahmad, S, 2012, Synthesis of System Dynamics Tools for Holistic Conceptualization of Water Resources Problema, :DWHU5HVRXU0DQDJH9RO 2421 – 2442.
Muta’ali, L., 2011. Environmental Carrying Capacity Based on Spatial Planning, ,QGRQHVLDQ-RXUQDO
RI*HRJUDSK\, Vo. 43 (2): 142-155.
Narulita, I, 2007, 'LVWULEXVL 6SDVLDO GDQ 7HPSRUDO &XUDK +XMDQ 5DWDUDWD 7DKXQDQ 7LSH 2URJUDÀN
XQWXN0HQGXJD$QJND.RHÀVLHQ$OLUDQGL&HNXQJDQ%DQGXQJ, dalam Sumber Daya Air dan Lingkungan Potensi, Degradasi dan Masa Depan, Diedit oleh Delinom, R.M., Dyah M, Jakarta: LIPI Press, p. 197.
Purnama, S., 2008, The Potential of Rainfall and Its Impact to Groundwater Storage in Java Island,
,QGRQHVLD-RXUQDORI*HRJUDSK\9RO1R²
3XUQDPD6.XUQLDZDQ$6XGDU\DQWR0RGHO.RQVHUYDVL$LU7DQDKGL'DWDUDQ3DQWDL
Kota Semarang, )RUXP*HRJUDÀ9RO²
Purnomo, H., 2012, 3HPRGHODQ GDQ 6LPXODVL XQWXN 3HQJHORODDQ $GDSWLI 6XPEHU 'D\D $ODP GDQ
/LQJNXQJDQ, IPB Press, Bogor.
Rachmat, A., 2007, 'DPSDN3HUXEDKDQ7DWD*XQD/DKDQ7HUKDGDS.HWHUVHGLDDQ$LU7DQDKGL'$6
&LWDQGX\%HUGDVDUNDQ.RHÀVLHQ,QÀOWUDVL,dalam Sumber Daya Air dan Lingkungan Potensi, Degradasi dan Masa Depan, Diedit oleh Delinom, R.M., Dyah M, Jakarta: LIPI Press, p. 21. Sitompul, R.F., 2009, 0HUDQFDQJ 0RGHO 3HQJHPEDQJDQ 0DV\DUDNDW 3HGHVDDQ GHQJDQ 3HQGHNDWDQ
6\VWHP'LQDPLFV, Penerbit LIPI, Jakarta.
6RPDQWUL$6DQG0DFKIXG$QDOLVLV6LVWHP'LQDPLNDXQWXN.HELMDNDQ3HQ\HGLDDQ8EL
Kayu : (Studi Kasus di Kabupaten Bogor), %XOHWLQ7HNQRORJL3DVFDSDQHQ3HUWDQLDQ, Vol. 2:
Soedarjanto, S., Sartohadi, J., Hadi, M.P., Danoedoro, P., 2011. The Role of Vegetation Cover and
&DWFKPHQW&KDUDFWHULVWLFVRQ%DVHÁRZLQ%DOL,VODQG,QGRQHVLD-RXUQDORI*HRJUDSK\43 (2): 97 – 110.
Takeda, K., 1993, +LGURORJLXQWXN3HQJDLUDQ, PT. Pradnya Paramita, Jakarta.
Wiyono, S., 2012, Penggunaan Sistem Dinamik Dalam Manajemen Transportasi untuk Mengatasi Kemacetan di Daerah Perkotaan, -XUQDO7UDQVSRWDVL, Vol. 12, No. 1: 1-10.
Yulianto, K., 2007, Menciptakan Generasi yang Arif Lingkungan: Sebuah Sumbangan Pemikiran Melalui Model Pendidikan Lingkungan Hidup, -XUQDO8QLYHUVLWDV3DUDPDGLQD, Vol. 05 No. 1: 15-23.
Zeppel, M.J.B., Wilks, J.V., Lewis, J.D., 2014, Impacts of Extreme Precipitation and Seasonal Change In Precipitation on Plants, %LRJHRVLFLHQFHV, Vol.11: 3083-3093.
6. Appendix
Appendix 1. S
Year Potential Water (m3)
Potential Utilized Water (m3)
Evapo-transpiration (m3)
Soil Moisture Vol-ume (m3)
2011 298.858.733 12.538.755
2012 458.050.938 297.139.470 12.538.755
2013 295.420.207 150.003.800 12.538.755
2014 457.884.494 293.700.944 12.538.755
2015 457.801.272 153.275.882 12.538.755
457.718.051 154.911.924 12.538.755
2017 288.590.387 12.538.755
2018 288.587.405 12.538.755
2019 288.584.424 12.538.755
2020 288.581.443 12.538.755
2089 288.375.739 150.723.410 12.538.755
2090 288.372.758 12.538.755
2091 12.538.755
2092 451.393.192 150.402.447 12.538.755
2093 451.309.970 150.402.447 12.538.755
2094 12.538.755
2095 288.357.852 12.538.755
288.354.871 12.538.755
2097 450.977.083 288.351.890 150.081.485 12.538.755
2098 288.348.908 150.001.244 12.538.755
2099 288.345.927 149.921.003 12.538.755
2100 450.727.417 12.538.755
S : , 20 6
2 20 2 00
Year Total Population (person) Domestic (m3) Paddy Field (m3)
MHP Plant (m3)
Total water demand (m3)
2011 13,924 10,921,133 204,984,000
2012 14,875 434,350 10,921,133 204,984,000
2013 15,891 10,921,133 204,984,000
2014 495,709 10,921,133 204,984,000
2015 10,921,133 204,984,000
19,374 10,921,133 204,984,000
2017 10,921,133 204,984,000
2018 22,111 10,921,133 204,984,000
Year Total Population (person)
Domestic
(m3) Paddy Field (m3)
MHP Plant (m3)
Total water demand (m3)
2020 25,235 10,921,133 204,984,000
2089 2,408,995 10,921,133 204,984,000
2090 2,573,529 75,147,045 10,921,133 204,984,000 291,052,178
2091 2,749,301 80,279,588 10,921,133 204,984,000
2092 2.937,078 10,921,133 204,984,000
2093 10,921,133 204,984,000 307,525,408
2094 3,351,984 97,877,940 10,921,133 204,984,000 313,783,073
2095 3,580,925 10,921,133 204,984,000
3,825,502 10,921,133 204,984,000
2097 119,334,085 10,921,133 204,984,000 335,239,218
2098 10,921,133 204,984,000
2099 10,921,133 204,984,000
2100 145,493,701 10,921,133 204,984,000
S : , 20 6
Appendix 3.
No. Sector Value Source
1. Domestic needs
a. Total population in 2011 b. Population growth rate c. Population death rate d. Water demand
13,924 people 7.23% (0.0723) 0.004 80 liter/individual/day
Central Bureau of Statistic Central Bureau of Statistic Central Bureau of Statistic
Indonesia National Standard number :
2. Agriculture a. 3DGG\ÀHOG b. Water demand c. Crop intensity
1,053.35 ha 1 liter/s/ha 120 days
Interpretation Citra Landsat
Indonesia National Standard number :
3. Micro-Hydro Power Plant a. Electric energy capacity b. Water demand
750 kWh P3/s
Appendix 4. Construction of Potential Utilized Water Resources in Dynamics Modelling