ONTOLOGY MAPPING FOR ERP BUSINESS PROCESS
VARIATIONS
Anang Kunaefi 1) , Riyanarto Sarno 2)
Faculty of Information Technology
Sepuluh Nopember Institute of Technology
Keputih, Sukolilo Surabaya 60111
email : [email protected]),[email protected])
Abstract
Ontology represent shared knowledge about certain domain. One important feature of ontology is its ability to grow or extend to express some new business changes. In a multi-tenancy architecture, like service-based ERP (Enterprise Resource Planning), both tenant and provider have their own ontology. Tenant’s small ontology must be matched or comply with provider’s big ontology before transaction take place. Similarity computation for ontology will fail to address this problem, because both ontologies are different in size. Therefore, we use ontology mapping technique to measure whether tenant’s ontology is comply with provider’s ontology. We employ lexical and semantic similarity algorithm to do the mapping. The results indicated that this method can be used to check the compliance of tenant’s ontology with provider’s ontology.
Keywords :
Ontology, Semantic Web Service, ERP, Business Process.
1. Introduction
The use of ontology in the area of web service application has been widely accepted lately, both for academics and industry. One of the important aspects of ontology is its ability to extend and communicate with other ontology. Moreover, ontology has been use as a standard language to represent knowledge in the semantic area.
In a multi-tenancy architecture like service-based ERP (Enterprise Resource Planning), both tenant and provider have their own ontology. Each tenant might have different ontology representing their business process [8]. On the other hand, service-based ERP provider has one big ontology contains many available business processes. Tenant’s small ontology must be matched or comply with provider’s big ontology before transaction can be performed. Therefore, a mechanism to measure whether tenant’s ontology matched or comply with provider’s ontology is vital.
Ontology similarity computation will fail to address this problem, because both ontologies are different in
size. Different size of ontology will lead to small similarity result [3,9]. Semantic similarity computation to measure between two ontologies were explained by Sarno et al. in [1,6,12,13]. In this paper, we use ontology mapping technique to measure whether tenant’s ontology comply with provider’s ontology. We apply this method to the case of web service-based ERP business process variations.
Ontology mapping is a process of combining two ontologies, where there are a lot of overlap as well as synonyms between them [16]. The term “Ontology Mapping” itself often mixes with the term “Ontology Merging” [4].
Related works about combining two ontologies have been conducted by scientists in the last decades. At least there are three terminologies of ontology combining process, those are Ontology Alignment, Ontology Mapping and Ontology Merging. Cross et al. use ontology alignment to describe the process of combining two different ontologies [2].
Stumme et al. in [15] use ontology merging to build new ontology from two different documents. Taylor et al. also use ontology merging process to build new ontology from many unrelated sources [16]. Therefore in ontology merging, there are very little overlap betwen the two ontologies.
2. Backgrounds
2.1. Domain Ontology
24-2 In this research, we define domain ontology in the case of service-based ERP (Enterprise Resource Planning). We build our domain ontology by combining terminologies and concepts used by major ERP vendors like SAP, Oracle, JDEdwards and more.
Fig. 1. Example of ERP Domain Ontology
2.2. Concept Similarity
Concept similarity is used to measure the degree of similarity between two OWL concepts. Two concepts considered more similar if they are more related. According to [7] Concept Similarity (C,C) →[0,1] is defined as a function from a pair of concepts to a real number between zero and one, expressing the degree of similarity between two concept such that:
1. x C, (x,x) = 1 2. x,yC,(x,y) = (y,x)
From the definition above, we can see that the degree of similarity between two concepts is transitive and symmetric.
One technique to measure the similarity between two concepts is by measuring the distance between the two concepts [7]. Basically, this algorithm pay attention on the structure of the ontology [10,17]. Two concepts considered more similar, if their distance in ontology is smaller or closer. The formula is expressed below:
(x,y) = 1 - (x,y)
Where, δ(x,y) is distance between concept x and concept y. While the formula to compute distance of two concepts is expressed below:
δ(x,y) = [w(ccp(x,y) ) - w(x)] + [w(ccp(x,y) ) - w(y)]
Where, ccp(x,y) is a common parent between concept x and y, and w(ccp(x,y)) is the weight of common parent of concept x and y. w(x) is the weight of concept x, and w(y) is the weight of concept y.
3. Methodology
In our system, tenants must provide ontology of their business process before they can use web service from provider. On the other hand, service-based ERP provider has one big ontology contains many available business processes that can be performed by the provider to serve tenants.
To address this problem, we proposed ontology mapping technique to measure whether tenant’s ontology comply with provider’s ontology. This method involve some steps described by Fig. 2 below.
Fig. 2. Proposed Method
In our method, we combine lexical similarity checking and semantic similarity checking. For lexical similarity, we use Wordnet Similarity and Cosine Similarity. For semantic similarity, we use concept similarity algorithm by [7]. Then, aggregate similarity is computed. The last step we employ mapping rules to check whether every concept children of tenant’s ontology are mapped in the provider’s ontology.
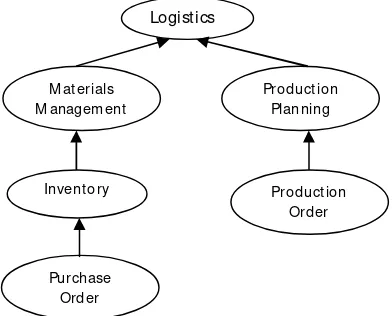
Fig. 2 below shows a small part of provider ontology describing two variations of Procure to pay business process of ERP. Small ontology of the tenant (Fig. 3) must be measured to check whether it can comply with ontology from provider.
Logist ics
M at erials M anagem ent
Product ion Planning
Invent ory Product ion
Order
Purchase Order
Lexical Similarity (S1)
(Wordnet Sim + Cosine Sim)
Semantic Similarity (S2)
(Concept Similarity)
Aggregate Similarity
(S1 + S2)
Mapping Rules
Fig. 3. A Part of Provider’s Ontology
Fig. 3 below shows an example of a tenant’s ontology that describes business process of their business. Tenant’s ontology may vary depends on their policy and business process.
Fig. 4. Example of Tenant’s Ontology
3.1. Lexical Similarity
Lexical similarity identifies similar concepts based on their names [14]. For this purpose, we use Wordnet Similarity and Cosine Similarity. Wordnet used to compute the relatedness between two words. While cosine similarity used to measure similarity between two vectors consist of collection of words.
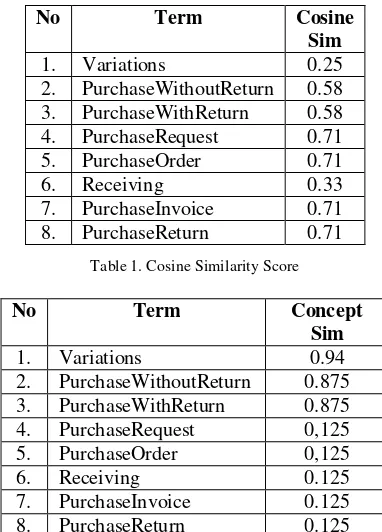
In our example, the term Purchasing from tenant’s ontology is compared with every term in provider’s ontology. Each term needs to be preprocessed using camel-case method in order to get the basic term. For example, processing PurchaseRequest gives result the term Purchase and Request. Table 1 shows complete similarity score for each term.
3.2. Concept Similarity
We use formula from section 2.2 to compute the distance between two concept using our domain ontology.
provider’s ontology using domain ontology as a reference. Table 2 shows the complete concept similarity score for each concept.
No Term Cosine Sim
1. Variations 0.25
2. PurchaseWithoutReturn 0.58 3. PurchaseWithReturn 0.58 4. PurchaseRequest 0.71
5. PurchaseOrder 0.71
6. Receiving 0.33
7. PurchaseInvoice 0.71
8. PurchaseReturn 0.71
Table 1. Cosine Similarity Score
No Term Concept Sim
1. Variations 0.94
2. PurchaseWithoutReturn 0.875 3. PurchaseWithReturn 0.875
4. PurchaseRequest 0,125
5. PurchaseOrder 0,125
6. Receiving 0.125
7. PurchaseInvoice 0.125
8. PurchaseReturn 0.125
Table 2. Concept Similarity Score
3.3 Aggregate Similarity
To gives better and valid similarity score, we combine our result in table 1 and table 2 using the following formula.
Sim = (0.5*CosineSim) + (0.5*ConceptSim) Business
Processes
PurchaseW it hout Ret urn
Purchase Request
Purchase Order
Receiving Purchase Invoice
Purchase Request
PurchaseW it h Ret urn
Purchase Order
Receiving Purchase Ret urn
Purchase Invoice
Purchasing
Request
24-4 equal, that is 0.5. In some condition, we can assign different weight to express our preference of similarity instead of the other. For example, we can assign weight of 0.4 for CosineSim and 0.6 for ConceptSim if we think that ConceptSim is more important and will give better result.
For equal weight of 0.5, resulting the following total similarity score.
Table 3. Aggregate Score
Using threshold value of 0.7, we got two concept candidates that are similar with concept Purchasing from tenant’s ontology. Those concepts are PurchaseWithoutReturn and PurchaseWithReturn. Those two concepts are candidates for concept integration.
3.3. Mapping Rules
After getting concept candidates for mapping, the next step would be applying rules to select the best concept among the concept candidates.
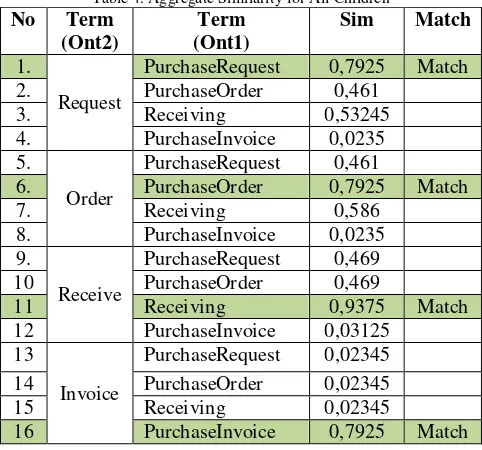
According to [16], two concepts can be merged if all their children match. Therefore, we measure the similarity (combination of cosine similarity and concept similarity) for each children of concept Purchasing (tenant’s ontology) with every children of those two concept candidates in provider’s ontology.
Because each children will have more than one threshold value of 0.7 each child of concept Purchasing (Ontology2) have a match concept in the opposite ontology. This indicates that the tenant ontology is perfectly mapped, and therefore, no concept addition needs to be done in provider’s ontology.
Table 4. Aggregate Similarity for All Children
No Term
PurchaseRequest 0,7925 Match
2. PurchaseOrder 0,461
3. Receiving 0,53245
4. PurchaseInvoice 0,0235
5.
Order
PurchaseRequest 0,461
6. PurchaseOrder 0,7925 Match
7. Receiving 0,586
8. PurchaseInvoice 0,0235
9.
Receive
PurchaseRequest 0,469
10 PurchaseOrder 0,469
11 Receiving 0,9375 Match
12 PurchaseInvoice 0,03125
13
Invoice
PurchaseRequest 0,02345
14 PurchaseOrder 0,02345
15 Receiving 0,02345
16 PurchaseInvoice 0,7925 Match
4. Result and Analysis
The result of our system indicates that this method can be used to measure the degree of compliance between two ontologies. In our experiment there are at least three possibilities of ontology mapping result.
1. Mapped Perfectly (no new concept is added in the provider’s ontology)
Fig. 4. Tenant’s Ontology Mapped Perfectly
Straight lines indicate concepts of provider’s ontology, and dotted lines indicate concepts from tenant’s ontology that is mapped to provider’s ontology. We can see in Fig. 3, that concept A and all of its children (A1, A2, A3) are mapped perfectly because there are already similar concepts exist in provider’s ontology for all concepts in tenant’s ontology.
Fig. 5a. Mapped Partially Type 1
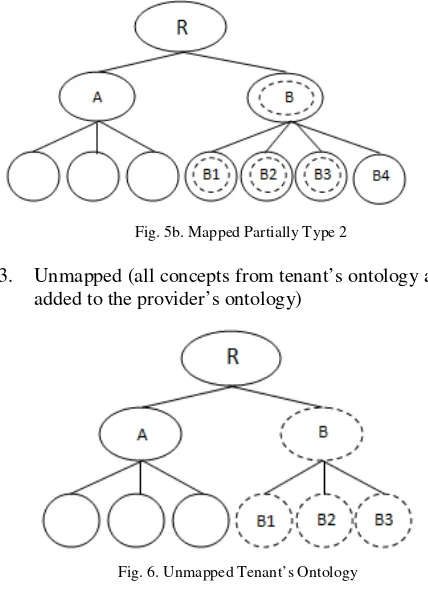
In Fig 5a, all concepts are mapped in provider’s ontology except for concept B4. There is no similar concept in provider’s ontology for concept B4, therefore concept B4 must be added to the ontology. Another type of partially mapped scenario is like the one showed in Fig. 4b, where tenant’s ontology is smaller than the concept in provider’s ontology.
Fig. 5b. Mapped Partially Type 2
3. Unmapped (all concepts from tenant’s ontology are added to the provider’s ontology)
Fig. 6. Unmapped Tenant’s Ontology
In Fig. 6, concept B has no similar concept in provider’s ontology, therefore concept B and all of its children must be added to the ontology under the root (R).
The degree of compliance between tenant’s ontology and provider’s ontology depends on the provider’s policy. For example, one might define the compliance only if tenant’s ontology are perfectly mapped. Another provider might accept partially mapped scenario with certain condition, for example if the majority of concepts are mapped and only one or two concepts didn’t
mapped. Either way, this method can be used to measure the degree of similarity of compliance between tenant’s ontology and provider’s ontology.
5. Conclusions and Suggestions
In service-based application, there is a need, where tenants are able to construct their own business process according to their needs dynamically and semantically. This will make a new way for business to gain win-win solution between service provider and tenants.
In this paper, we propose a method to check whether ontology of a tenant comply with ontology of provider using ontology mapping technique. We believe that this method can become an answer for compliance problem using ontology in a buyer and seller schema.
Our suggestions, methods to combine ontology is very important to develop. Because we believe in the future, as more people use ontology for their semantic technology, people will start to think how their ontology can communicate or interact with other ontology for interoperability.
Reference
[1] Anistyasari, Y; Sarno, R, 2011, Weighted Ontology for Subject Search in Learning Content Management System, ICEEI, Bandung, Indonesia.
[2] Cross, V and Hu, X, 2011, Using Semantic Similarity in Ontology Alignment, Proceedings of the 6th International Workshop on Ontology Matching, Germany.
[3] Ehrig, M.; Haase, P.; Hefke, M.; Stojanovic, N., 2004, Similarity for Ontologies - A Comprehensive Framework, Workshop Enterprise Modelling and Ontology.
[4] Ehrig, M.; Staab, S., 2004, Quick Ontology Mapping, Proceedings of Third International Semantic Web Conference (ISWC), Japan.
[5] Farooq, A., Arshad, M.J.; Shah, A., 2010, A Layered Approach for Similarity Measurement Between Ontologies, Journal of American Science.
[6] Fitri, R; Sarno, R, 2011, Pencocokan Ontologi Berbobot untuk Model Perhitungan Kematangan COBIT Berdasarkan Kemiripan Dokumen, Seminar MMT Pasca Sarjana, ITS Surabaya.
[7] Ganjisaffar, Y; Abolhassani, H; Neshati, M; Jamali, M, A, 2006, Similarity Measure for OWL-S Annotated Web Service, Proceedings of 2006 IEEE/WIC/ACM International Conference on Web Intelligence.
[8] Kunaefi, A; Sarno, R; Sanjoyo, B.A; Mukhlas, I.; Astuti, H.M., 2012, Orchestration of Semantic Web Service Using OWL-S for Variations of ERP Business Process, International Conference on Mathematics, Statistics and its application (ICMSA), Bali, Indonesia.
[9] Maedche, A. and Staab, S., 2002, Measuring Similarity Between Ontologies, Proceedings of the European Conference on Knowledge Acquisition and Management, Springer.
24-6 OWL-S, IEEE Transaction on Knowledge and Data Engineering, Vol. 22, No. 2.
[11]Malucelli, A.; Palzer, D.; Oliveira, E., Ontology-based Services to Help Solving The Heterogeneity Problem in e-Commerce Negotiations, Electronic e-Commerce Research and Applications, Vol 5, pp. 29-43, 2006.
[12]Sarno, R; Anistyasari, Y; Fitri, R, 2012, Semantic Search Pencarian Berdasarkan Konten, Andi, Jogjakarta. [13]Sarno, R; Ghozali, K; Nugroho, B.A.; Hijriani, A, 2011,
Semantic Matchmaking Using Weighted Directed Acyclic Graph, In Proceedings of the third International Seminar on Applied Technology, Science and Arts (APTECS). [14]Sen, S.; Somavarapu, S.;Sarda, N.L., 2005, Class
Structures and Lexical Similarities of Class Names for Ontology Matching, Proceedings of The First and Second Conference on Ontologies-based Databases and Information System, Springer-verlag, Berlin.
[15]Stumme, G. and Maedche, A., 2001, Ontology Merging for Federated Ontologies on the Semantic Web, Proceedings of International Workshop for Foundations of Models for Information Integration.
[16]Taylor, J.M; Poliakov, D; Mazlack, L.J, 2005, Domain-Specific Ontology Merging for the Semantic Web, Annual Meeting of the North American Fuzzy Information Processing Society.
[17]Wang, Y.; Liu, W.; Bell, D.A., 2010, A Structure-based Similarity Spreading Approach for Ontology Matching, Proceedings of the 4th International Conference on Scalable Uncertainty Management, Springer-Verlag, Berlin.
Authors Bio
Anang Kunaefi, is an IT Consultant at an IT company based
in Surabaya. He got his bachelor degree from Informatics, ITS Surabaya in 2004. He conduct a research in Kumamoto University Japan in 2011 in the field of semantic web service. Now, he study master of informatics at ITS Surabaya. His research mainly focus on business process, web service and semantic web service.
Riyanarto Sarno, is a lecturer and researcher at ITS Surabaya.