Background
Launched in 2014, the government of Indonesia’s national health insurance scheme, Jaminan Kesehatan Nasional, or JKN, aims to ensure access to healthcare, especially for the poor and the near-poor (defined as the bottom 40%). The growing private healthcare sector in Indonesia is well-positioned to respond to the increased demand that will ensue from the government’s ambitious plans to achieve universal coverage by 2019. The private hospital industry has grown significantly over the last seven years, increasing from 52 to 63 percent as a proportion of total hospitals in Indonesia (MOH, 2017). The Indonesian government, through the national health insurance agency Badan Penyelenggara Jaminan Sosial-Kesehatan, or BPJS-K, has contracted with private clinics and hospitals. As of September 2017, over 60 percent of BPJS-K-contracted clinics and hospitals were part of the private sector (Idris, 2017). BPJS-K, a single-payer agency, pays private hospitals per admission, outpatient visit, and/or procedure through Indonesia Case-Based Groups (INA-CBGs). INA-CBGs, a diagnosis-related group (DRG) reimbursement, determine payment rates by type of illness, severity of a patient’s condition(s), and hospital class. With the exception of diseases such as HIV and tuberculosis that are traditionally funded by donors, few national treatment guidelines exist, and private providers must hire staff and procure drugs, reagents, and equipment in advance of reimbursement. As such, healthcare providers have some flexibility in optimizing facility resources for treatment procedures, interventions, and drug administration. With less control, some suggest that there are increased instances of overtreatment, financial strain on hospitals due to tariffs set lower than cost of care, and possible compromises in quality of care (Ambarriani, 2014; Harmadi and Irwandy, 2018; Malonda, 2015). Quality assurance and quality control practices of the payer BPJS-K, or the Ministry of Health as the ultimate steward of the health sector, have a role to play. Though accreditation is required of all JKN-affiliated hospitals through a primary accreditation body, KARS (Komisi Akreditasi Rumah Sakit), only 57 percent of hospitals had achieved accreditation as of April 2018 (Dutta, 2018). Further, a recent assessment concluded that JKN has improved hospital record keeping and documentation, though cautioned that increasing coverage and utilization under existing reimbursement rates may have perverse effects on quality of care (Broughton et al., 2018).
August 2018
Is Indonesia’s National Health
Insurance Associated with Greater
Hospital Efficiency?
Evidence from a Survey of Private Hospitals
Authors: Rebecca Ross and Arin Dutta
Table 1. Indonesia’s Hospital Sector: Overview
Ownership
Costs covered by
Proportion of total hospitals Wages Capital expenditure All other recurrent costs
Public (federally- or locally-owned and operated)
Government through national or local budgetary transfers
Mixed: JKN, national or local transfers, user fees
*Federal: 10% **Local: 26%
Private non-profit (faith-based and other)
Mixed: JKN, transfers from philanthropic or faith-based
organizations, user fees, private health insurance 22%
Private for-profit (single owner or network)
Mixed: JKN, transfers from corporate reserves (for network
hospitals only), user fees, private health insurance 42%
* Federal includes Ministry of Health, other ministries, army, police department, and state-owned enterprises ** Local includes provincial, district, and municipal governments
Given that hospital expenditures account for 80 percent of JKN healthcare expenditure (HP+ and TNP2K, 2018), this analysis aims to discern whether hospital use of resources has improved since JKN initiation—that is, whether technical efficiency has changed. Technical efficiency is defined as the state in which every resource is optimally allocated, such that waste and misuse are minimized. Few studies have assessed hospital technical efficiency in Indonesia since JKN initiation; those that have considered only public hospitals and did not assess whether changed efficiency was a response to JKN initiation (Hafidz et al., 2018; Harmadi and Irwandy, 2018; Iswanto, 2015). The situation of private hospitals contracted by BPJS-K is very different from public hospitals, which makes analysis of efficiency changes critical (Table 1). Unlike public hospitals, for which the government continues to fund personnel costs and capital expenditures, private facilities must fund most costs from direct revenue. Private providers can sometimes be cross-subsidized within corporate or faith-based networks of facilities. Private facilities must also procure their medicine and commodity needs from the market. In contrast, public-owned hospitals can access the procurement system implemented by the government of Indonesia (Lembaga Kebijakan Pengadaan Barang Jasa Pemerintah, or LKPP), which, through single-winner price competition tenders, can lead to lower input prices (Britton et al., 2018).
This analysis, conducted by the U.S. Agency for International Development (USAID)-funded Health Policy Plus (HP+) project and Indonesia’s National Team for the Acceleration of Poverty Reduction (TNP2K), employed statistical models to assess efficiency of private sector hospitals’ inpatient and outpatient departments before and after JKN initiation using Data Envelopment Analysis (DEA). DEA, a linear technique that measures proportional change of multiple inputs and outputs, is often used to quantify efficiency (Banker et al., 1984; Charnes et al., 1978; Harmadi and Irwandy, 2018). In DEA, efficiency is scored for each facility relative to the “best,” rather than average, facility. Difference-in-difference models were then used to assess whether changes in efficiency were associated with BPJS-K contracting and, thereby, the initiation of JKN.
Methods and Data
Data Sources
The data used in this analysis were collected by HP+ and TNP2K for the broader assessment of JKN’s effect on the private healthcare sector in Indonesia. Operational data, including data on outpatient load, inpatient capacity and occupancy, services available, and human resources, were collected from December 2017 through January 2018 by HP+ and TNP2K from 73 private hospitals in 11 provinces, representing five percent of registered private hospitals in Indonesia. Hospitals were stratified by province, classification, BPJS-K contracting status, and facility ownership (nonprofit, faith-based, for-profit independently owned, or for-profit networked). The survey was administered to 61 BPJS-K-contracted hospitals and 12 hospitals not contracted with BPJS-K, representing 13 Class B hospitals, 38 Class C hospitals, and 21 Class D hospitals. Survey instruments collected quantitative and qualitative data from 2013 (before JKN initiation) and 2016 (after JKN initiation) on number and types of services provided, human resources, bed capacity, and length of stay. Further detail on sampling and data collection can be found in Results of a Survey of Private
Hospitals in the Era of Indonesia’s Jaminan Kesehatan Nasional (Ross et al., 2018).
Data Envelopment Analysis
In this analysis, technical efficiency (efficiency) is assessed by examining the relationship between physical inputs and outputs used at private hospitals in 2013 and 2016. A hospital is defined as technically efficient if an increase in an output requires a decrease in at least one other output or input (Farrel, 1957; Magnusson, 1996; Moshiri et al., 2010). In other words, the maximum possible number of outputs are produced for a given quantity of inputs. As inputs used and outputs produced in inpatient and outpatient departments within private hospitals are distinct, this analysis creates different DEA models for each department and year. In total, four DEA models are created: inpatient department 2013, inpatient department 2016, outpatient department 2013, and outpatient department 2016. DEA models are oriented to minimize outputs (input-oriented) or to maximize outputs (output-oriented), depending on whether the hospital has
Box 1: Variables included in DEA
Input variables:
• Number of wards/clinics • Number of beds (inpatient)
• Human resources: general doctors, nurses, medical specialists, support staff
Output variables:
• Inpatient days*
• Number of inpatient surgical services provided
• Number of outpatient services provided
greater control of inputs used or outputs produced. Operating on the assumption that hospitals plan budgets in advance and do not have the ability to quickly adjust investment in infrastructure, equipment, or labor, DEA models were set to maximize hospital outputs (output-oriented). Box 1 lists the inputs and intermediate outputs used in the DEA models, sourced from the operational data provided by the 73 private hospitals that were surveyed.
All inpatient and outpatient variables were collected separately in the survey instruments, with the exception of human resources, which were reported as aggregate at each hospital. Human resource variables are disaggregated as inpatient or outpatient based on assumptions of time spent by general doctors and medical specialists, with the remaining staff proportionally distributed.1 Human resources in inpatient and outpatient departments are then categorized and
aggregated as general doctors or dentists; nurses; medical specialists; and support and administrative staff. Next, descriptive statistics and statistical tests of change are used to demonstrate whether a shift occurred in the efficiency scores produced by DEAs between years; an increasing score indicates improved efficiency. Difference-in-difference (DiD) models are constructed to understand whether BPJS-K contract status influenced efficiency, conducting this test separately for each department type (Lindlbauer et al., 2016). DiD models use inverse truncated regressions (Simar and Wilson, 2005; Tauchmann, 2015).2 All analyses are performed in STATA SE, version 15.
Limitations
Due to limited sample size and refusal of sampled facilities to participate in the study, no Class A hospitals are included in this analysis. Additionally, this analysis does not aim to generalize findings across the entire private sector given that our sample includes only 12 non-BPJS-K-contracted hospitals. Due to data limitations, we cannot directly attribute efficiency changes to JKN or contracting with BPJS-K, as we do not quantify impact with causal inference analysis. Finally, without data on costs or prices of service provision at the hospitals or health outcomes we are unable to assess allocative efficiency or total efficiency of private hospitals. With these limitations, we aim to assess relative technical efficiency of private
hospitals and determine whether BPJS-K contracting status was associated with these measured changes in efficiency.
Results
How have variables used to measure efficiency
changed over time?
In general, both input and output variables increased between 2013 and 2016 in inpatient and outpatient departments among both BPJS-K- and non-BPJS-K-contracted hospitals (Table 2). Qualitatively, we found that providers perceived that patient utilization and facility investments have increased since JKN initiation. Eighty-one percent of all surveyed hospitals reported increases in patient volume and bed capacity since JKN initiation (54% of BPJS-K-contracted hospitals and 25% of hospitals not contracted with BPJS-K). The majority of hospitals also reported hiring more nurses and specialists since JKN initiation (85% of BPJS-K-contracted hospitals and 58% of hospitals not contracted with BPJS-K).
Changes to inputs included small increases in the average number of outpatient clinics and inpatient wards and decreases in the average number of clinics in BPJS-K-contracted hospitals. The average number of wards also increased in hospitals not contracted with BPJS-K, while the average number of beds increased in both contracting-type hospitals. Changes to human resource inputs were more significant among BPJS-K-contracted hospitals compared to hospitals not contracted with BPJS-K.
1 Assumptions of proportion of time spent are available from authors upon request.
2 Truncated regressions follow the general model: efficiencyT = β0 + β1BPJSK_affiliation + β2TimeT + β3BPJSK_affiliation*TimeT + β4Geo_groupT + β5UrbanT +
β6Pop_densityT + β7Hospital_classifiationT + β8Hospital_ownershipT +u + εT
Table 2: Descriptive Statistics of Inputs
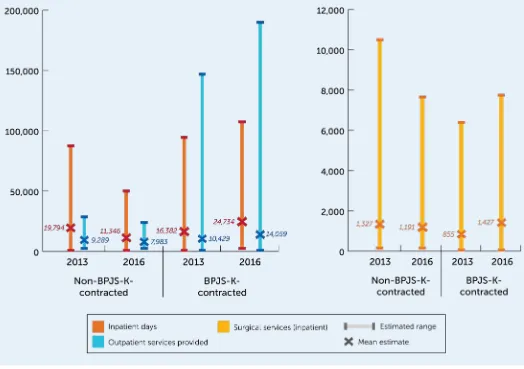
Outputs used in the DEA model include average number of inpatient days, average volume of outpatient services, and surgical services. In general, all outputs increased in BPJS-K-contracted hospitals between 2013 to 2016 and decreased in hospitals not contracted with BPJS-K (Figures 1a and 1b). Inpatient days increased 51 percent among BPJS-K-contracted hospitals and decreased 43 percent
in hospitals not contracted with BPJS-K between 2013 and 2016. Outpatient (OPD) services increased 35 percent among BPJS-K-contracted hospitals and decreased 14 percent among hospitals not contracted with BPJS-K between 2013 and 2016. Finally, surgical services
increased 67 percent among BPJS-K-contracted hospitals and decreased 14 percent among hospitals not contracted with BPJS-K. Additional analyses on these hospitals’ changes in capacity, utilization, and finances are detailed elsewhere (Ross et al., 2018).
Has private hospital efficiency changed since JKN
initiation?
Overall, efficiency of private hospitals increased between 2013 and 2016. The average efficiency score of inpatient departments increased eight percent and the average efficiency score of outpatient departments increased 23 percent between 2013 and 2016 (Figure 2).
Among BPJS-K-contracted hospitals, average efficiency increased in both inpatient (12%) and outpatient (27%)
Figure 1a: Average annual inpatient days and
outpatient services (2013, 2016)
Figure 1b: Average annual surgical
services (2013, 2016)
departments. These increases may be explained by the slight increases in installed capacity and human resources relative to large increases in inpatient and outpatient outputs.
Among hospitals not contracted with BPJS-K, average inpatient department efficiency decreased 4.7 percent between 2013 and 2016. In these hospitals, we found that increases in human resources were not matched by increases in services provided, which, as shown in Figures 1a and 1b, decreased between years. Outpatient department efficiency among hospitals not contracted with BPJS-K increased 14 percent between 2013 and 2016.
Does BPJS-K contract status affect changes in
efficiency?
This analysis suggests that contracting with BPJS-K is significantly associated with increased efficiency in inpatient departments. Holding constant all other factors, there is a statistically significant positive effect of contracting with BPJS-K on efficiency. Accordingly, the impact of BPJS-K contracting on mean change in efficiency (the difference-in-difference) is 3.46 percent.
However, BPJS-K contract status did not significantly affect efficiency changes in outpatient departments. In contrast, no evidence is found of an influence of BPJS-K contract status on efficiency of outpatient departments. DiD results are further detailed in Table 3.
Additionally, year, geographic group, population density, hospital classification type, and hospital ownership also influenced efficiency (Table 3). Interestingly, results indicate that increased efficiency was also associated with increasing specialization of hospital type—that is, private hospitals with greater specialization (hospital classification type B) than the general hospitals (hospital classification type D) in our sample. Additionally, results suggest an association between increased efficiency and not-for-profit hospital ownership, relative to for-profit hospitals. These findings suggest that hospitals that are not operating for profit are functioning more efficiently.
Qualitatively, survey results suggest that most facility providers did not anticipate that increased efficiency would be a primary benefit of joining the JKN network, instead reporting expectations of increased patient load and ability to offer better quality services. Only 38 percent of contracted hospitals thought that joining the JKN network would improve resource use. However, 89 percent of these hospitals have reported realization of the expectation of improved efficiency use since contracting with BPJS-K. Further, a majority of financial officers reported the hospitals having financial ability to make both capital and infrastructure investments since JKN initiation. Among hospitals not contracted with BPJS-K, 83 percent of financial officers reported that the facility was financially able to make capital investments and 58 percent reported infrastructure investments since JKN initiation. Among BPJS-K-contracted hospitals, 95 percent of finance officers reported that the facility had the financial capacity to invest in infrastructure and 79 percent reported that infrastructure investment had occurred since JKN initiation.
Qualitative data from hospital directors and providers indicate that these increases in capacity and infrastructure may not come at the expense of quality of care. Sixty-four percent of BPJS-K-contracted hospitals report increased frequency of staff trainings on service delivery for labor and delivery complications, tuberculosis diagnosis, heart attack, and dialysis, compared to 42 percent among hospitals not contracted with BPJS-K. Nearly all sampled hospitals reported using patient satisfaction tracking mechanisms and having quality assurance or quality improvement teams, though many were established before 2014.
Table 3: DiD of DEA efficiency scores
Covariate
Inpatient Department
Efficiency
Outpatient Department
Efficiency
BPJS-K-contracted -1.002 -0.042
Year: 2016 -2.434* 0.503
Interaction:
BPJS-K-contracted and year 3.455** -0.096
Geographic group: Java
(reference = Sumatra) 3.512*** -0.010
Geographic group: others
(reference = Sumatra) -0.094 -0.274
Residence: urban 0.837 -0.758**
Population density 0.000*** 0.000
Hospital classification
type: C 1.732** -0.397**
Hospital classification
type: D -2.153* -1.185***
Hospital ownership:
for-profit -2.920*** -0.734***
Discussion and Recommendations
Our analysis found that, while contracting with BPJS-K improved efficiency in inpatient departments of private hospitals, there is no clear evidence that changes in outpatient department efficiency are related to JKN. Mechanisms to ensure quality of care seem to have improved—but no evidence links these to JKN policies or BPJS-K contracting. At the same time, the government of Indonesia has piloted mechanisms such as global budget ceilings to curb and contain rising expenditures on hospital care. Improved efficiency can lead to better use of scarce hospital resources, allow providers to adapt and prosper under JKN, and drive greater financial sustainability of the health system. However, reduced use of critical inputs with plateaued or declining quality of care is not a desired outcome. Therefore, it is important that the government of Indonesia consider implementing policies that both promote efficiency and ensure that quality of services is maintained. The following policy recommendations are suggested to continue to improve and promote efficiency without jeopardizing quality of care as JKN coverage continues to expand.
• Review the experience from the proposed global budget pilot for JKN and implement INA-CBG payments supplemented by such expenditure ceilings alongside mechanisms to enforce clinical guidelines and standards of care. The international experience suggests that, while DRG-based payment systems like INA-CBGs can
encourage efficiency gains, they may create incentives for higher case volumes and weaken incentives for quality control (Street et al., 2011). Provider behaviors, such as inappropriate (higher) admissions, early discharge and re-admissions, and unnecessary treatment, can cause case volume to increase inappropriately. Global budgets, as a ceiling for expenditures at the hospital level, can encourage better cost control but may not improve quality. Therefore, to ensure that sufficient level of quality of care is provided, rates should be strategically aligned with standards of care, perhaps by incentivizing achievement of metrics of hospital care quality, as implemented in other systems. If successful in terms of cost control and quality of care, the government should consider scale-up for the global budget pilot initiated in two hospitals in 2017. In the long term, moving towards “value-based healthcare” models of purchasing hospital care could accommodate quality of care alongside efficient reimbursement (Porter and Kaplan, 2016).
• Ensure that private providers are included in the mechanisms that public hospitals have to manage input costs. Currently, private hospitals contracted with BPJS-K do not have access to the electronic catalogue system for pharmaceutical and medical device procurement operated by LKPP, which enables public providers to procure inputs at competitive prices. Without such access, private providers struggle to secure negotiated low-priced drugs and devices directly from manufacturers and distributors. If granted access to this system, private providers will be better able to manage their hospital costs and improve efficiency across both outpatient and inpatient departments.
• Coordinate and standardize quality assurance standards and governance between BPJS-K and the Ministry of Health to ensure that contracted hospitals maintain and improve quality of care. As private hospitals aim to meet increasing demand and improve efficiencies with JKN reimbursement rates, quality of services and care needs to be monitored and quality assurance systems established. With better coordination between BPJS-K and the Ministry of Health, requirements can be standardized to incorporate patient safety, experience, and performance indicators to promote and ensure quality of care.
References
Ambarriani, A.S. 2014. “Hospital Financial Performance in the Indonesian National Health Insurance Era.” Review of Integrative Business & Economics Research Vol4(1): 367-379.
Banker, R.D., A. Charnes, and W.W. Cooper. 1984. “Some Models for Estimating Technical and Scale Inefficiencies in Data Envelopment Analysis.” Management Science 30: 1078-1092.
Britton, K., S. Koseki, and A. Dutta. 2018. Expanding Markets while Improving Health in Indonesia: Private Sector Market in the JKN Era.
Washington, DC: Palladium, Health Policy Plus; and Jakarta, Indonesia: TNP2K.
Broughton, E., A. Achadi, K. Latief, F. Nandiaty, T. Rianty, et al. 2018. Hospital Accreditation Process Impact Evaluation: Final Report. Chevy Chase, MD: USAID ASSIST Project, University Research Co., LLC (URC).
Charnes, A., W.W. Cooper, and E. Rhodes. 1978. “Measuring the Efficiency of Decision Making Units.” European Journal of Operational Research
2: 429-444.
Dutta, A. 2018. “Review of JKN Progress: Insights from the JKN Comprehensive Assessment.” Presentation at seminar “Achieving Universal Health Coverage: Escalate Quality, Minimize Inequity,” convened by the Ministry of Health, Indonesia at J.S. Luwansa Hotel, Jakarta, Indonesia on May 3, 2018.
Hafidz, F., T. Ensor, and S. Tubeuf. 2018. “Assessing Health Facility Performance in Indonesia Using the Pabon-Lasso Model and Unit Cost Analysis of Health Services.” International Health Planning and Management 33e: 541-556.
Harmadi, S.H.B. and Irwandy. 2018. “Technical Efficiency of Public Service Hospitals in Indonesia: A Data Envelopment Analysis (DEA).” Asian Social Science Vol. 14, No. 6: 81-90.
Health Policy Plus and National Team for the Acceleration of Poverty Reduction (HP+ and TNP2K). 2018. The Financial Sustainability of Indonesia’s National Health Insurance Scheme: 2017-2021. Washington, DC: Palladium, Health Policy Plus; and Jakarta, Indonesia: National Team for Accelerating Poverty Reduction (TNP2K).
Idris, F. 2017. “Rapat Tingkat Menteri: Pengendalian Defisit Data Jaminan Social Program JKN” (unpublished presentation).
Indonesia Ministry of Health. 2012-2017. Ministry of Health Annual Health Sector Profile 2011-2016. Jakarta, Indonesia: Ministry of Health.
Iswanto, A.H. 2015. “Hospital Efficiency and Data Envelopment Analysis (DEA): An Empirical Analysis of Kemang Medical Care (KMC).” Available at https://ssrn.com/abstract=2629898.
Lindlbauer, I., J. Schreyogg, and V. Winter. 2016. “Changes in Technical Efficiency after Quality Management Certification: a DEA Approach Using Difference-in-Difference Estimation with Genetic Matching in the Hospital Industry.” European Journal of Operational Research 250: 1026-1036.
Magnusson, J. 1996. “Efficiency Measurement and Operationalization of Hospital Production.” Health Service Research 31(1): 21-37.
Malonda, T.D., A.J.M. Rattu, and T. Soleman. 2015. “The Claim Filling Analysis of Health Badan Penyelenggara Jaminan Sosial (BPJS) Kesehatan in Dr. Sam Ratulangi Tondano Local Hospital.” Research article, Magisterial Program, Universitas Sam Ratulangi. Manado.
Moshiri, H., S.M. Aljunid, and R.M. Amin. 2010. “Hospital Efficiency: Concept, Measurement Techniques and Review of Hospital Efficiency Studies.” Malaysian Journal of Public Health Medicine Vol 10(2): 35-43.
Porter, M.E. and R.S. Kaplan. 2016. “How to Pay for Health Care: Bundled Payments Will Finally Unleash the Competition that Patients Want.”
Harvard Business Review. Boston: Harvard Business Publishing.
Ross, R., S. Koseki, A. Dutta, P. Soewondo, and Y. Nugrahani. 2018. Results of a Survey of Private Hospitals in the Era of Indonesia’s Jaminan Kesehatan Nasional: Impact of Contracting with National Health Insurance on Services, Capacity, Revenues, and Expenditure. Washington, DC: Palladium, Health Policy Plus; and Jakarta, Indonesia: National Team for Accelerating Poverty Reduction (TNP2K).
Simar, L. and P.W. Wilson. 2005. “Estimation and Inference in Two-Stage, Semi-Parametric Models of Production Processes.” Journal of Econometrics 136: 31-64.
Street, A., J. O’Reilly, P. Ward and A. Mason. 2011. “DRG-Based Hospital Payment and Efficiency: Theory, Evidence, and Challenges.” Diagnosis-Related Groups in Europe. Berkshire, England: McGraw Hill Open University Press.
Tauchmann, H. 2015. “Simarwilson: DEA Based Two-Step Efficiency Analysis.” Presented at the 2015 German Stat Users Group Meeting in Nuremberg, IAB, June 26, 2015.
Additional works consulted to develop models are available from authors upon request.
Health Policy Plus (HP+) is a five-year cooperative agreement funded by the U.S. Agency for International Development under Agreement No. AID-OAA-A-15-00051, beginning August 28, 2015. The project’s HIV activities are supported by the U.S. President’s Emergency Plan for AIDS Relief (PEPFAR). HP+ is implemented by Palladium, in collaboration with Avenir Health, Futures Group Global Outreach, Plan International USA, Population Reference Bureau, RTI International, ThinkWell, and the White Ribbon Alliance for Safe Motherhood. Funding for TNP2K was partially supported by the Australian Government.
This publication was produced for review by the U.S. Agency for International Development. It was prepared by HP+. The information provided in this document is not official U.S. Government information and does not necessarily reflect the views or positions of the U.S. Agency for International Development or the U.S. Government.
CONTACT US
Health Policy Plus
1331 Pennsylvania Ave NW, Suite 600 Washington, DC 20004