Company Update
1H13 operational results
United Tractors (UNTR) June sales heavy equipment sales volume came in at 326 units or 18.7% MoM lower from 401 units in May 2013. The decrease was largely due to 33% lower mining heavy equipment sales volume of 116 units from 172 units a month earlier. With less visible improvement in 2Q13 heavy equipment sales volume figure, the company needs to post a stable sales volume of 416 units per month if UNTR want to maintain its heavy equipment sales volume target of 5,000 units this year. In the mean time, we still maintain our operational data assumptions, hence, our target for UNTR. We believe UNTR’s healthy balance sheet and its proven experiences will be the company’s main advantage that will help UNTR to overcome current condition, Hold.
Heavy equipment sales volume dropped 18.7% MoM. UNTR June sales heavy equipment sales volume came in at 326 units or 18.7% MoM lower from 401 units in May 2013. The decrease was largely due to 33% lower mining heavy equipment sales volume of 116 units from 172 units a month earlier. Despite weak heavy equipment sales volume, UNTR’s coal mining contractor business posted an impressive coal production volume of 9.6mn tons, or the highest record in UNTR’s history. This was also come with overburden removal volume of 76.4mn bcm, a 8.4% MoM higher from 70.5mn bcm in May 2013. Meanwhile, UNTR’s coal mining business posted the lowest monthly sales volume since September 2011 at 311 ktons or 14.3% MoM lower from 363k tons. Declining coal prices appear to be the main hurdle for UNTR in accelerating its coal sales volume last month.
Expects soft 2Q13 performance. With such operational figures, the company’s 2Q13 HE sales volume was 1,180 units, 7.2% QoQ lower from 1,272 units in 1Q13, this would affect UNTR’s 2Q13 financial performance despite higher coal production volume during the period. Nevertheless, weak Rupiah exchange rate may help UNTR’s revenue figure albeit will be lower as compared to a year earlier. Furthermore, we also expect lower margin in 2Q13 on the back of increasing cost from coal mining contracting business amid slower margin contribution from heavy equipment business.
Needs more efforts to achieve target. With less visible improvement in 2Q13 heavy equipment sales volume figure, the company needs to post a stable sales volume of 416 units per month if UNTR want to maintain its heavy equipment sales volume target of 5,000 units this year. Therefore, the downside risk is imminent if the company’s
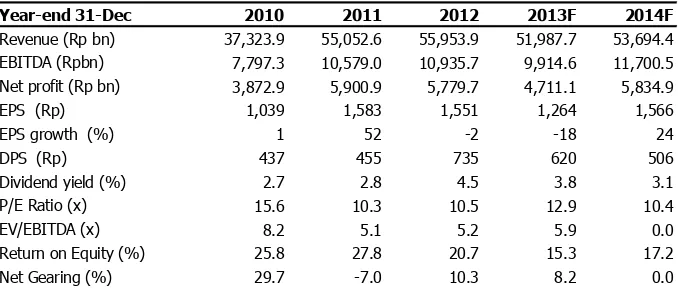
Year-end 31-Dec 2010 2011 2012 2013F 2014F
Revenue (Rp bn) 37,323.9 55,052.6 55,953.9 51,987.7 53,694.4 EBITDA (Rpbn) 7,797.3 10,579.0 10,935.7 9,914.6 11,700.5 Net profit (Rp bn) 3,872.9 5,900.9 5,779.7 4,711.1 5,834.9
EPS (Rp) 1,039 1,583 1,551 1,264 1,566
EPS growth (%) 1 52 -2 -18 24
DPS (Rp) 437 455 735 620 506
Dividend yield (%) 2.7 2.8 4.5 3.8 3.1
P/E Ratio (x) 15.6 10.3 10.5 12.9 10.4
EV/EBITDA (x) 8.2 5.1 5.2 5.9 0.0
Return on Equity (%) 25.8 27.8 20.7 15.3 17.2
United Tractors
2
Exh. 1. 1H13 volume
1H11 1H13 % YoY 3Q12 4Q12 1Q13 2Q13 % QoQ May-13 Jun-13 % MoM
Heavy Equipment (unit)
Agro 903 489 -45.8% 391 231 287 202 -29.7% 68 52 -40.9%
Construction 540 557 3.2% 257 200 228 329 44.0% 128 101 -22.4%
Forestry 241 196 -18.8% 74 26 111 85 -23.3% 32 26 -65.3%
Mining 2547 1,177 -53.8% 501 291 646 531 -17.7% 172 114 -42.0%
Total 4,231 2,419 -42.8% 1,224 747 1,272 1,180 -7.2% 401 326 -39.0%
Mining Contractor (mn ton)
Coal 44.4 50.0 12.6% 24.2 25.6 23.7 26.3 11.0% 8.5 9.6 5.8% Overburden 407.2 413.6 1.6% 226.7 221.1 200.2 213.4 6.6% 70.5 76.4 -2.5%
Coal Mining (th ton)
Coal PMM 1,491 1,465 -1.7% 734 501 680 785 15.4% 309 261 -31.7% Coal TTA 1,552 704 -54.6% 741 552 491 213 -56.6% 54 50 -25.5%
Total 3,043 2,169 -28.7% 1,475 1,053 1,171 998 -14.8% 363 311 -28.6%
United Tractors
3
Rpbn 2010 2011 2012 2013F 2014F Rpbn 2010 2011 2012 2013F 2014F
Revenue
37,324 55,053 55,954 51,988 53,694 Net Profit 3,873 5,901 5,780 4,711 5,835 COGS
30,528 44,859 45,433 43,090 43,583 Depr / Amort 2,635 2,964 3,369 3,769 4,169 Gross Profit
6,796 10,194 10,521 8,898 10,111 CF's from oprs 6,508 8,865 9,149 8,480 10,004 Opr Profit
5,163 7,615 7,566 6,146 7,532 Capex -4,060 -9,098 -9,793 -5,000 -5,000 EBITDA
7,797 10,579 10,936 9,915 11,700 Others -307 -512 -1,014 0 0 Net int inc/(exp)
(140) (39) (59) 25 94 CF's from investing -4,367 -9,610 -10,807 -5,000 -5,000 Gain/(loss) forex
22 120 0 0 0 Net change in debt 430 -443 1,622 -1,948 -1,195 Other inc/(exp)
17 88 (60) (60) (60) Others -1,700 6,270 62 -2,333 -1,905 Pre-tax Profit
5,061 7,785 7,447 6,110 7,565 CF's from financing -1,270 5,827 1,684 -4,281 -3,100 Tax
(1,187) (1,885) (1,693) (1,390) (1,720) Net cash flow 871 5,082 25 -801 1,903 Minority Int.
(2) 1 26 (10) (10) Cash at BoY 2,769 1,343 7,135 3,995 2,353 Net Profit
3,873 5,901 5,780 4,711 5,835 Cash at EoY 1,343 7,135 3,995 2,353 3,578
Rpbn 2010 2011 2012 2013F 2014F
Cash & Deposits
1,343 7,135 3,995 2,353 3,578 2010 2011 2012 2013F 2014F
Other curr assets
14,190 18,490 18,053 17,031 17,424 Profitability Net fixed assets
13,261 19,396 25,820 27,051 27,882 Gross Margins (%) 18.2% 18.5% 18.8% 17.1% 18.8% Other assets
907 1,419 2,433 2,433 2,433 Opr Margins (%) 13.8% 13.8% 13.5% 11.8% 14.0% Total assets
29,701 46,440 50,301 48,868 51,316 EBITDA Margins (%) 20.9% 19.2% 19.5% 19.1% 21.8% ST debts
191 4 15 148 163 Net Margins (%) 10.4% 10.7% 10.3% 9.1% 10.9% Other curr liab
9,728 14,926 11,312 9,316 9,015 ROE (%) 25.8% 27.8% 20.7% 15.3% 17.2% LT debts
3,160 2,717 4,339 2,391 1,195 ROA (%) 14.3% 15.5% 11.9% 9.5% 11.6% Other LT liabilities
456 1,289 2,334 2,334 2,334 Minority interest
29 1,183 2,665 2,665 2,665 2010 2011 2012 2013F 2014F
Total Liabilities
13,565 20,120 20,665 16,854 15,373 Current ratio (x) 1.6 1.7 1.9 2.0 2.3 Shareholders Equity
16,136 26,320 29,636 32,013 35,943 Net. Debt/Equity (x) 0.3 -0.1 0.1 0.1 0.0 Net debt/(cash)
4,798 -1,831 3,062 2,630 -264 Int. Coverage (x) 77.1 33.3 32.9 26.7 32.7
Valuation 2010 2011 2012 2013F 2014F
PER (x)
United Tractors
4
RESEARCH
Bagus Hananto [email protected] (62-21) 3190-1777 ext. 219
EQUITY SALES
Dick Hermanto [email protected] (62-21) 3162-063
Maria Fransisca [email protected] (62-21) 3162-062
Agi Susanti [email protected] (62-21) 3162-075
Siti Qobtiah [email protected] (62-21) 3162-065
Pandu Endra [email protected] (62-21) 3190-1777
Supardi [email protected] (62-21) 3162-025
PT ONIX Sekuritas
Deutsche Bank Building #15-04 Jl. Imam Bonjol No. 80 Jakarta 10310 Indonesia Phone. (62-21) 3190-1777 (hunting)
Fax. (62-21) 3190-1616
DISCLAIMER:
This report was produced by PT ONIX Sekuritas, a member of Indonesia Stock Exchange (IDX). The Information contained in this report has
been obtained from public sources believed to be reliable and the options, analysis, forecasts, projections and expectations contained in this
report are based on such information and are expressions of belief only. No representation or warranty, expressed or implied, is made that
such information or opinion is accurate, complete or verified and it should not be replied upon as such. This report is provided solely for the
information of clients of PT ONIX Sekuritas who has to make their own investment decisions without reliance on this report. Neither PT ONIX
Sekuritas nor any officer or employee of PT ONIX Sekuritas accept any liability whatsoever for any direct or consequential loss arising from
any use of this report or its contents. PT ONIX Sekuritas may be involved in transactions contrary to any opinions herein to make markets, or
have positions in the securities recommended herein. PT ONIX Sekuritas may seek or will seek investment banking or other business
relationships with the companies within this report. This report is a copyright of PT ONIX Sekuritas, for further information please contact us
![Studi Induksi Kalus Androgenik Pisang Batu [Musa balbisiana (Bb)] Pada Berbagai Media Dengan Penambahan Putresin](data:image/gif;base64,R0lGODlhAQABAIAAAP///wAAACH5BAEAAAAALAAAAAABAAEAAAICRAEAOw==)