219 Perception of English vowels
© 2018 Faculty of Humanities, Universitas Indonesia
Arum Perwitasari is a PhD candidate at the Leiden University Centre for Linguistics (LUCL), the Netherlands. She focuses her research on second language acquisition, bilingualism, second language production and perception. Her publications include "Quality of Javanese and Sundanese vowels", Journal of the Southeast Asian Linguistics Society JSEALS Vol. 10/2: 1-9 (2017); “Formant frequencies and vowel space area in Javanese and Sundanese English language learners”, 3L: Language, Linguistics, Literature; The Southeast Asian Journal of English Language Studies Vol. 22/3: 141-152 (2016) in collaboration with Niels O. Schiller, Marian Klamer, and Jurriaan Witteman. Arum Perwitasari can be contacted at: [email protected].
Arum Perwitasari | DOI: 10.17510/wacana.v19i1.607
Perception of English vowels
by Javanese and Sundanese speakers
A mouse-tracking study
Arum Perwitasari
AbstrAct
results confirmed that perceptual difficulties varied significantly according to the influence of L1 vowel inventories.
Keywords
L2 perception; L2 learners; vowel perception; consonantal context; mouse tracking.
1. I
ntroductIonPerception of foreign speech (L2) sounds by L2 learners is affected by the beginning age of L2 acquisition (Flege, Munro, and McKay 1995; Baker et al. 2002), the amount of exposure to the L2 (Flege 1987; Flege and Hillendbrand 1984), and the L1 vowel and consonant system (Bradlow 1995; Fox, Flege, and Munro 1995; Iverson and Evans 2009; Elvin, Escudero and Vasiliev 2014). Studies of English vowel perception have focused on western language backgrounds including Spanish (Flege, Munro, and MacKay 1995; Escudero 2000; Escudero and Chládková 2010; Morrison 2008, 2009) and Catalan (Cebrian 2006, 2007). Spanish-speaking learners of English struggled to
perceive English vowels which are not present in their first language (Escudero
and Chládkova 2010; Sisinni, Escudero, and Grimaldi 2013). Previous studies
have examined the cross-language perception pattern in specific L2 sounds
(Escudero and Boersma 2004; Morisson 2009). Unlike these previous studies, which tested L2 vowel sounds perceived by those with L1 western language backgrounds, the present study focuses on all of the English vowels perceived by those from two non-western languages—the Indonesian languages of Javanese and Sundanese.
Previous studies have reported that L2 learners who have a smaller number
of L1 vowels experience difficulty perceiving an L2 with a larger number of
vowels (for example, Flege, Bohn, and Jang 1997; Iverson and Evans 2007, 2009; Elvin et al. 2014). This is especially true of the L2 learners who do not have the
sound contrasts in their first language. Flege, Bohn, and Jang (1997) studied the
interaction of L1 and L2 vowel systems of native German, Spanish, Mandarin, and Korean speakers. The study found that the nature of the L1 vowel system and its perceived relation to vowels affect the L2 vowel production and perception. Likewise, Iverson and Evans (2007, 2009) found that German and
Norwegian speakers, who have larger L1 vowel systems, identified English
vowels with more accuracy than Spanish and French speakers, who have smaller vowel systems. Similarly, Elvin et al. (2014) compared the perception of Australian English and Iberian Spanish on six Brazilian Portuguese vowel contrasts /a/-/ɔ/, /a/-/ε/, /e/-/i/, /o/-/u/, /e/-/ε/, and /o/-/ɔ/ and found that Iberian Spanish speakers were more accurate in discriminating
the contrasts than the speakers of Australian English. Specifically, the study
demonstrated that, despite the differences in their vowel systems, learners’ perceptions are accurately predicted by detailed acoustic comparison between L1 and L2 sounds.
221
model (Escudero 2005, 2006, 2009), suggest that acoustic similarities between L1 and L2 sounds play a role in cross-language speech perception. However,
the specific predictions for L2 perception between the models are different.
Generally, the Speech Learning Model (SLM) attempts to explain that the success of second language learning is determined by the perceived phonetic similarities between the L1 and L2 sounds. Within the SLM, the perceived phonetic similarities are divided into identical, similar, and new sounds. An
identical sound is a sound represented by the identical IPA symbols and that
has no significant acoustic difference between the L1 and L2 sounds. An L2 sound is defined as a similar sound if it is represented by the same IPA symbol as a sound in the L1 and if the difference is in the diacritics only. A new sound
is defined as an L2 sound which is not used in the L1 differs auditorily from
the nearest L1 sound, and for which the IPA base symbol is different (Flege
1992). The SLM predicts that L2 learners will have no significant problem
producing and perceiving an identical sound, as they cannot detect the difference between the L1 and L2 sound. However, L2 learners will be less successful in perceiving similar sounds since the similarity between L1 and L2 sounds will block the formation of the phonetic category. They will be successful in the perception of new vowels as it motivates them to perceive uncategorizable speech sounds.
Unlike the SLM, the L2LP predicts that the L2 learners will face different kinds of perceptual problems depending on how the perception grammar in the L1 corresponds to the optimal L2 perception. In the L2LP, the perception of an L1 contrast is divided into three scenarios: new, sub-set, and similar. A new scenario occurs when the L1 perception grammar outputs fewer perceptual categories than the required perception of the L2. As a result, the L2 environment produces phonological differences that do not exist in the L1 (Escudero 2005). For example, Spanish learners of English map the two English sounds /i/-/ɪ/ onto a single native category /i/. The perception
of new sounds is considered the most difficult scenario as it involves not
only the creation of new categories and perceptual mappings, but also the integration of the newly categorized dimensions into the already categorized dimensions (Escudero 2005). The sub-set scenario occurs if L1 perception grammar outputs more categories than the required perception of the L2. Hence, the L2 categories constitute a sub-set of L1 categories. For example, Dutch learners of English map the Spanish /i/ into two native categories /i/ and /ɪ/. In the similar scenario, the L1 perception grammar outputs the same number of categories as the target of L2 grammar since the L1 and L2 categories are phonologically equivalent. For instance, L1 Canadian English speakers map the Canadian French sounds /ɛ/ and /æ/ onto /ɛ/ and /æ/ in the native categories.
learners of English. A lexical discrimination task was conducted to measure the accuracy rate of the learners. The results showed that the Indonesian learners of English fail to perceive a word correctly because of the similarity of the words. The Indonesian were less accurate on four English vowel contrasts, /ɪ/-/iː/, /ɔː/-/ɑː/, /ʌ/-/ɑː/, and /uː/-/ʊ/ than the English listeners. The confusion in the perception of English sounds occurred most often with the similar pairs of words which were not frequently heard. However, the study
did not clearly determine how the L1 vowel system influences the perceptual difficulties.
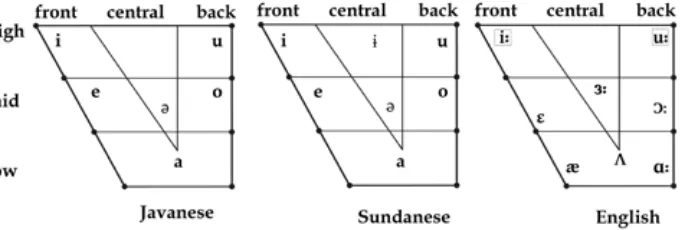
The present study examines how the acoustic similarity and differences between the Javanese and Sundanese L1 vowel systems and the English L2 vowel system is related to L2 sound perception. Javanese and Sundanese, two of the most widely spoken Indonesian local languages (Lauder and Ayatrohaedi 2006; Nothofer 2009), have different vowel systems to American English.
Javanese vowels are grouped into six phonemes, /i- ɪ /, /u- ʊ/, /e-ε/, /ə/, /a/, and /o-ɔ/ (Wedhawati et al. 2006) and that Sundanese has seven vowels /i/, /a/, /ə/, /ɨ/, /e/, /u/, and /o/ (Crothers 1978). Meanwhile, American English has a complex vowel system with ten monophthongs, /iː/, /ɪ/, /ɛ/, /æ/, /ɑː/, /ɔː/, /ʊ/, /uː/, /ʌ/, and /ɜː/ (Ladefoged 2001, 2006). Javanese and Sundanese do not distinguish vowels based on duration (Van Zanten and Van Heuven 1997), whereas American English distinguishes vowels based on durational cues (Peterson and Lehiste 1960; Hillenbrand, Clark, and Houde 2000). A comparison of the English, Javanese, and Sundanese vowel inventories is illustrated in Figure 1.
Using the principle of Flege’s Speech Learning Model (1987), English vowels /iː/ and /uː/ have an identifiable counterpart for Javanese /i/ and /u/ but make a difference in their length marking. Therefore, the vowels /iː/ and /uː/ are considered similar vowels by Javanese and Sundanese native speakers. The other English vowels /ɑː/, /ɜː/, /ɔː/, /ʌ/, /æ/, /ε/, /ɪ/, and /ʊ/ are represented by IPA symbols which are not used for any Javanese and Sundanese sounds, and are therefore considered new vowels. No identical
223
vowels were found in the contrastive sounds of the English, Javanese, and Sundanese L1 systems.
In this study, the speakers’ perception of English is not influenced by
the Indonesian vowel inventory of the Javanese/Sundanese inventories. The reason is that Standard Indonesian does not provide any learned vowel targets which the Javanese and Sundanese can use as substitutes in English. Even though Indonesian is an L2 for the Javanese and Sundanese speakers, the phonetics of the vowels in Standard Indonesian are identical with the Javanese and Sundanese vowel system. In terms of vowel inventory, Standard Indonesian vowels are available in the Javanese and Sundanese L1 vowel system.
To examine how the Javanese and Sundanese native speakers perceive English vowels, we used the MouseTracking software. MouseTracking (Freeman and Ambady 2010) measures participants’ confusion in responding to a forced binary decision, in this case, between two different vowels (Spivey, Grosjean, and Knoblich 2005; Dale, Kehoe, and Spivey 2007; Farmer, Anderson, and Spivey 2007). If respondents do not move straight to the target, it means
that there is confusion caused by conflicting information (Bruhn, Huette,
and Spivey 2013). Mouse-tracking data show real-time mental processing which appears as the result of a complex chain of thought (Freeman et al. 2011). Using MouseTracker, one can observe the online measures of hand movements, such as the Area Under the Curve (AUC). Area Under the Curve (AUC) is the area between the observed mouse trajectory and an idealized straight-line trajectory drawn from the beginning and end points (Freeman et al. 2011). Farmer et al. (2009) examine how Italian speakers perceive the pen-pan
and pin-pan English contrasts. The Italian speakers moved their trajectories closer to the competitor in the pen-pan condition than in the pin-pan condition, indicating that the perception of the pen-pan condition is more difficult than
the pin-pan condition.
The current study examines the following research questions:
1. Does the L1 vowel inventory affect the perception of English vowels by Javanese and Sundanese speakers?
2. To what extent are the most common errors made by the Javanese and Sundanese learners of English similar to or different from that of the native English speakers?
3. To what extent are the hand movement trajectories reflected in the Area
Under the Curve (AUC) of the Javanese and Sundanese learners of English similar to or different from that of the native English speakers?
To answer these questions, we present the perception accuracy and hand movement trajectories of the L2 learners using the MouseTracking method. We discuss the results of the perceptual tasks in terms of the L2 sound perception
models. On the basis of our finding,s the following hypotheses have been
formulated.
role of vowel inventory in L2 vowel perception (for instance, Flege, Bohn, and Jang 1997; Iverson and Evans 2007, 2009; Elvin et al. 2014), Javanese and
Sundanese speakers are predicted to have more difficulties in perceiving
English vowels than the native English speakers. To the best of our knowledge, the study by Perwitasari (2013) has fo far been the only research involving Javanese and Sundanese speakers. However, this study did not provide a
specific division of participants’ local language groups.
Turning to the second question, on the basis of the SLM (Flege 1995), it is predicted that Javanese and Sundanese speakers will have lower error rates with the “new” vowels /ɑː/, /ɜː/, /ɔː/, /ʌ/, /æ/, /ε/, /ɪ/, and /ʊ/ than the native English speakers and they will have higher error rates for the similar
vowels /iː/ and /uː/ than the native English speakers. The native speakers are predicted to have fewer error rates than the L2 learners. Conversely, on the basis of the L2LP model, Javanese and Sundanese speakers will have higher error rates for the new sounds /ɑː/, /ɜː/, /ɔː/, /ʌ/, /æ/, /ε/, /ɪ/, and /ʊ/ than the English speakers and have lower error rates for the similar sounds /iː/ and /uː/ than the English speakers.
Thirdly, since the hand movements which do not move straight to the
target show that there is confusion caused by conflicting information (Bruhn,
Huette, and Spivey 2013), we make two different predictions. Taking SLM, it is predicted that Javanese and Sundanese speakers will have a smaller AUC for new vowels /ɑː/, /ɜː/, /ɔː/, /ʌ/, /æ/, /ε/, /ɪ/, and /ʊ/ than the native English speakers. Moreover, they will have a bigger AUC for the similar vowels /iː/ and /uː/ compared to the native English speakers. On the basis of the L2LP model (Escudero 2005), it is predicted that Javanese and Sundanese speakers will have a bigger AUC for the new sounds /ɑː/, /ɜː/, /ɔː/, /ʌ/, /æ/, /ε/, /ɪ/, and /ʊ/ and a smaller AUC for the similar sounds /iː/ and /uː/ compared to the native English speakers.
2 M
ethod 2.1 PArtIcIPAntsThirty Javanese-speaking English learners (JEL) (15 female, 15 male, Mage = 22, SD = 1.4), thirty Sundanese-speaking English learners (SEL) (15 female, 15 male, Mage = 21, SD = 0.74), and twenty American English (AE) speakers (10 female, 10 male, Mage = 26.35, SD = 2.8) participated in the experiment. The Javanese and Sundanese participants spoke Javanese and Sundanese as
their first language. They also spoke Indonesian as L2 in formal situations.
The JEL, SEL, and AE participants were tested at Universitas Gadjah Mada and Universitas Padjajaran, both in Indonesia. The AE participants reported having little knowledge of foreign languages other than AE and considered themselves monolingual.
225
SD = 2.17) to English than the SEL (M = 10.1, SD = 2.21; t(28) = 2.04, p = .04).1 To provide estimates of language proficiency, the participants completed an
English vocabulary test. All participants signed written informed consent prior to taking part in the study so that they could make a rational and voluntary decision to participate.
2.2 stIMulI
Auditory stimuli comprised of ten American English vowels, /iː/, /ɜː/, /ɑː/,
/ɔː/, /uː/, /ɪ/, /ɛ/, /æ/, /ʌ/, and /ʊ/, in two consonantal contexts, /bVd/ such as bead and bid and /hVd/ such as heed and hid, were produced in the carrier sentence: Click bead, please or Click heed, please. Each stimulus was recorded using Praat (version 5.5.04) at 44.1 kHz. The target stimuli were composed
of fifty minimal pairs of ten English vowels × five possible combinations: twenty-five contrastive pairs in the /bVd/ context and twenty-five contrastive
pairs in the /hVd/ context. Pairs of stimuli were presented in a random order without repetitions. The visual target stimuli were letter strings presented using MouseTracker. One letter string appeared in the top left corner and the other in the top-right corner. The mouse movements were recorded at a sampling rate of 60 Hz. The display resolution was set to 1024 x 768 pixels.
2.3 Procedure
Participants were tested individually in a sound attenuated room. Prior to the
experiment, the participants filled in a demographic questionnaire and signed
a consent form. In the experimental session, participants sat 60 cm from the computer screen and placed their right hands over the computer mouse. To begin the trial, they clicked on a START button at the bottom centre of the screen. The letter strings appeared in the top left and top right corners of the screen. An auditory stimulus using MouseTracker was automatically played. Participants were instructed that, after hearing the auditory stimulus, they needed to select, as quickly as possible, a target word by clicking on one of the two letter strings presented on the computer screen. All participants were encouraged to move the mouse directly to the correct target within 2,000 ms. If a response was not made within 2,000 ms, a warning box appeared on the screen and the trial was considered an error trial. If an incorrect response was made, a message with a red X appeared at the centre of the screen.
2.4 AnAlysIs
Mouse-tracking data collection began with clicking the start button until
the final target selection. Error trials were excluded from the analysis. Error
rates and Area Under the Curve (AUC) data were inspected. Error rates were calculated for each participant. AUC values measure how much the hand
movements are attracted towards an incorrect response and index the degree of uncertainty when making a selection. The AUC was calculated using the mouse trajectory connecting the START button to the correct response.
Error rates and AUC were analysed using two repeated measures ANOVAs with GROUP (Javanese/Sundanese, English) as between-subjects factor, and VOWEL (/iː/, /ɜː/, /ɑː/, /ɔː/, /uː/, /ɪ/, /ɛ/, /æ/, /ʌ/, and /ʊ/) and CONTEXT (/bVd/, /hVd/) as within-subjects factor. Since this present article is concerned mainly with the vowel acquisition, not with the effect of consonantal context, main and interaction effects of consonants will not be presented in the results section. If the sphericity assumption is rejected (that
is, Mauchly’s test is significant), Greenhouse-Geisser corrected p-values are reported. If significant, ANOVAs were followed up with independent sample
Mann-Whitney U tests for testing differences between groups (instead of a paired t-test). To control for a Type I Error across the pair-wise comparisons, we used the Bonferroni Correction. A new adjusted alpha level of .005 per test
(.05/10 vowels) was considered statistically significant. Data were analysed
using SPSS version 22.0 (IBM, 2013).
3 r
esults 3.1 errorrAtesJavanese vs. English speakers
There was a main effect of VOWEL, [F(6.15, 295) = 6.31, p < .001], and VOWEL
× GROUP interaction, [F(6.15, 295) = 3.94, p < .001].2 There were no other
main effects or interactions. Pair-wise comparisons of Mann-Whitney tests are presented in Table 1.
English Vowel
Error Rate
English Javanese
U p
Mdn SD Mdn SD
New vowels
/ɑː/ 0 0.40 1 0.92 474 .000 **
/ɜː/ 0 0.00 0 0.12 320 .243
/ɔː/ 0 0.26 0 0.55 379 .051
/ʌ/ 0 0.12 1 0.79 545 .000 **
/æ/ 0 0.12 1 0.74 520 .000 **
/ε/ 0 0.15 1 0.66 541 .000 **
/ɪ/ 0 0.07 0.5 0.84 450 .001 **
/ʊ/ 0 0.15 1 0.83 516 .000 **
2 Main effect analysis showed that English vowels significantly affect the error rates performed by the Javanese and English listeners. The effect of vowels on the error rates differs across groups. By examining the mean (M) between Javanese and English listeners in Table 1, we can see that Javanese listeners had
227
English Vowel
Error Rate
English Javanese
U p
Mdn SD Mdn SD
Similar vowels
/iː/ 0 0.10 0.5 0.73 426 .005 *
/uː/ 0 0.17 0.5 0.72 466 .000 **
The differences in error rates between the Javanese and English speakers occur in new vowels /ɑː/, /ʌ/, /æ/, /ε/, /ɪ/, and /ʊ/ and similar vowels /iː/ and /uː/. New vowels /ɑː/, /ʌ/, /æ/, /ε/, /ɪ/, and /ʊ/ and the similar
vowel /uː/ survived the Bonferroni Correction.
Sundanese vs English speakers
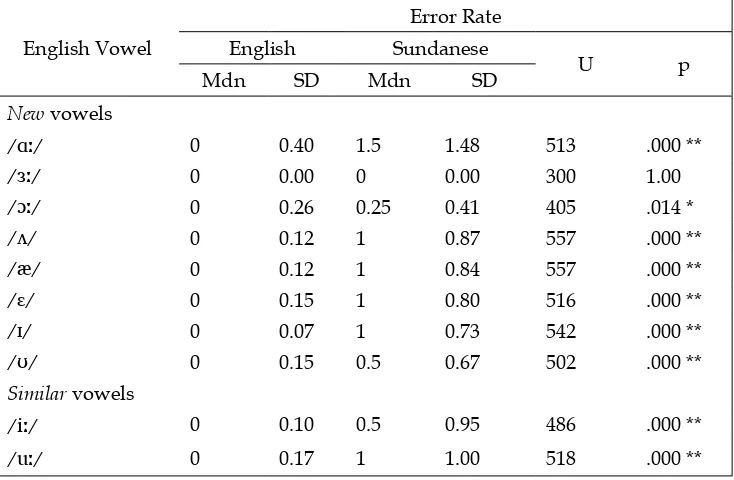
There was a main effect of VOWEL, [F(5.23, 295) = 9.5, p < .001], and VOWEL x GROUP interaction [F(5.23, 295) = 6.87, p < .001]. There were no other main effects or interactions. Pair-wise comparisons of Mann-Whitney tests are presented in Table 2.
English Vowel
Error Rate English Sundanese
U p
Mdn SD Mdn SD
New vowels
/ɑː/ 0 0.40 1.5 1.48 513 .000 **
/ɜː/ 0 0.00 0 0.00 300 1.00
/ɔː/ 0 0.26 0.25 0.41 405 .014 *
/ʌ/ 0 0.12 1 0.87 557 .000 **
/æ/ 0 0.12 1 0.84 557 .000 **
/ε/ 0 0.15 1 0.80 516 .000 **
/ɪ/ 0 0.07 1 0.73 542 .000 **
/ʊ/ 0 0.15 0.5 0.67 502 .000 **
Similar vowels
/iː/ 0 0.10 0.5 0.95 486 .000 **
/uː/ 0 0.17 1 1.00 518 .000 **
Table 2. Mann-Whitney U test comparisons for error rates of each English vowel in the Sundanese and English speakers. Mdn = median, SD = standard deviation, * = p < .05, ** = p < .005 (Bonferroni corrected significance threshold).
The error rates between the Sundanese and English speakers differed for the new vowels /ɑː/, /ɔː/, /ʌ/, /æ/, /ε/, /ɪ/, and /ʊ/ and the similar vowels /iː/ and /uː/. The new L2 vowels /ɑː/, /ʌ/, /æ/, /ε/, /ɪ/, and /ʊ/ and the
similar L2 vowels /iː/ and /uː/ survived the Bonferroni Correction.
3.2 AreA underthe curve (Auc)
Javanese vs English speakers
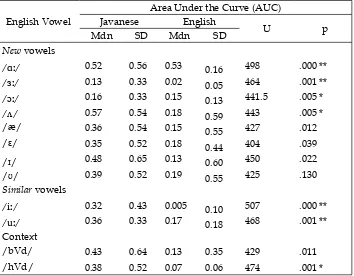
There was a main effect of VOWEL, [F(2.03, 97.6) = 12.47, p < .001], and CONTEXT and GROUP interaction, [F(1, 48) = 6.13, p < .05]. There were no other main effects or interactions. Pair-wise comparisons of Mann-Whitney tests are presented in Table 3.
English Vowel
Area Under the Curve (AUC) Javanese English
U p
Mdn SD Mdn SD
New vowels
/ɑː/ 0.52 0.56 0.53 0.16 498 .000 **
/ɜː/ 0.13 0.33 0.02 0.05 464 .001 **
/ɔː/ 0.16 0.33 0.15 0.13 441.5 .005 *
/ʌ/ 0.57 0.54 0.18 0.59 443 .005 *
/æ/ 0.36 0.54 0.15 0.55 427 .012
/ε/ 0.35 0.52 0.18 0.44 404 .039
/ɪ/ 0.48 0.65 0.13 0.60 450 .022
/ʊ/ 0.39 0.52 0.19 0.55 425 .130
Similar vowels
/iː/ 0.32 0.43 0.005 0.10 507 .000 **
/uː/ 0.36 0.33 0.17 0.18 468 .001 **
Context
/bVd/ 0.43 0.64 0.13 0.35 429 .011
/hVd/ 0.38 0.52 0.07 0.06 474 .001 *
There was a significant difference in the AUC between the Javanese and
English speakers for the new vowels /ɑː/, /ɜː/, /ɔː/, and /ʌ/ and the similar
vowels /iː/ and /uː/. Only the new vowels /ɑː/ and /ɜː/ and the similar
vowels /iː/ and /uː/ survived the Bonferroni Correction.
Sundanese vs English speakers
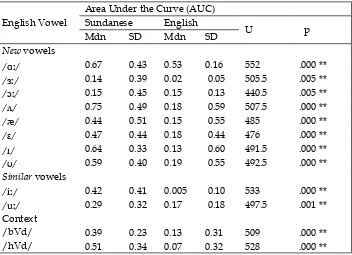
There was a main effect of VOWEL, F (2.63, 126.2) = 14.58, p < .001, and VOWEL x GROUP interaction, F (2.6, 126.2) = 1.7, p = .17. Pair-wise comparisons of
229
Mann-Whitney tests with Bonferroni adjusted alpha .005 (.05/10) are presented in Table 4.
English Vowel
Area Under the Curve (AUC) Sundanese English
U p
Mdn SD Mdn SD
New vowels
/ɑː/ 0.67 0.43 0.53 0.16 552 .000 **
/ɜː/ 0.14 0.39 0.02 0.05 505.5 .005 **
/ɔː/ 0.15 0.45 0.15 0.13 440.5 .005 **
/ʌ/ 0.75 0.49 0.18 0.59 507.5 .000 **
/æ/ 0.44 0.51 0.15 0.55 485 .000 **
/ε/ 0.47 0.44 0.18 0.44 476 .000 **
/ɪ/ 0.64 0.33 0.13 0.60 491.5 .000 **
/ʊ/ 0.59 0.40 0.19 0.55 492.5 .000 **
Similar vowels
/iː/ 0.42 0.41 0.005 0.10 533 .000 **
/uː/ 0.29 0.32 0.17 0.18 497.5 .001 **
Context
/bVd/ 0.39 0.23 0.13 0.31 509 .000 **
/hVd/ 0.51 0.34 0.07 0.32 528 .000 **
The differences in the AUC between Sundanese and English speakers are shown in the new vowels /ɑː/, /ɜː/, /ɔː/, /ʌ/, /æ/, /ε/, /ɪ/, and /ʊ/ and
similar vowels /iː/ and /uː/. The new vowels /ɑː/, /ɜː/, /ɔː/, /ʌ/, /æ/,
/ε/, /ɪ/, and /ʊ/ and the similar vowels /iː/, /uː/ survived the Bonferroni Correction.
4. d
IscussIonRegarding the first question, the repeated measures ANOVAs found a
significant effect of vowel on error rates [F (6.15, 295) = 6.31, p < .001] and on
AUC [F (2.03, 97.6) = 12.47, p < .001] for the Javanese speakers. Additionally,
the repeated measures ANOVAs also found a significant effect of vowel on
error rates [F (5.23, 295) = 9.5, p < .001] and on AUC [F (2.63, 126.2) = 14.58, p < .001] for the Sundanese speakers. The results suggest that the perceived L2 vowels are affected by the differences in the Javanese and Sundanese L1 vowel systems. The results do support the results of previous studies mentioning that L2 learners who have a smaller L1 vowel system than the target language
would experience difficulties in perceiving L2 vowels (for example, Flege,
Bohn, and Jang 1997; Iverson and Evans 2007, 2009; Elvin et al. 2014). Regarding the second question, the pair-wise comparisons of
Whitney tests with the Bonferroni Correction found that the Javanese speakers had higher error rates for new vowels, especially for /ɑː/, /ʌ/, /æ/, /ε/, /ɪ/, and /ʊ/, than the English speakers. The Sundanese showed higher error rates for the new vowels /ɑː/, /ʌ/, /æ/, /ε/, /ɪ/, and /ʊ/ than the English speakers.
From these results, it is apparent that the SLM was not confirmed. Interestingly,
Javanese showed higher error rates for the similar vowel /uː/ and Sundanese speakers showed higher error rates for the similar vowels /iː/ and /uː/ than the native English speakers. In all, the results of the error rates partly support the prediction made by L2LP (Escudero 2005) that Javanese and Sundanese listeners are likely to show high error rates for new vowels.
Regarding the third hypothesis, the pair-wise comparisons of Mann-Whitney tests found that the Javanese speakers had a larger AUC for the “new” vowels, such as /ɑː/, /ɜː/, /ɔː/, and /ʌ/, than the English speakers, while the Sundanese speakers had larger AUC for all the “new” vowels /ɑː/, /ɜː/, /ɔː/, /ʌ/, /æ/, /ε/, /ɪ/, and /ʊ/. Surprisingly, the Javanese and Sundanese speakers displayed a greater amount of uncertainty in making lexical decisions about the “similar” vowels /iː/ and /uː/, as they were drawn to the opposite alternatives and this resulted in a higher AUC than the English speakers. Overall, the AUC results of the Javanese Sundanese speakers support the L2LP prediction (Escudero 2005) indicating that new L2 vowels appear to create
greater confusion for the Javanese and Sundanese speakers as reflected in the
larger AUC for these groups.
5 c
onclusIonThe purpose of the current study was to examine the effect of vowel inventory in L2 perception between the Javanese, Sundanese, and English speakers by analysing their hand movements. We focused on the error rates and the Area Under the Curve (AUC) which indicates the degree of confusion
caused by conflicting information (Bruhn, Huette, and Spivey 2013). The
results have demonstrated that the perception of L2 sounds was affected by
the L2 perceived vowels. The perceptual difficulty differs strikingly between
the Javanese, Sundanese, and native English speakers. These differences
are reflected in the error rates and the hand movement trajectories gathered
from an online task. In conclusion, the Javanese speakers scored higher error rates on the new vowels /ɑː/, /ʌ/, /æ/, /ε/, /ɪ/, and /ʊ/ and the similar
vowel /uː/ than the native English speakers. The Sundanese speakers made inaccurate decisions about the new vowels /ɑː/, /ʌ/, /æ/, /ε/, /ɪ/, and /ʊ/ and the similar vowels /iː/ and /uː/. In addition, the Javanese speakers were more likely to show a greater attraction to the incorrect alternatives for the
231 have confirmed that perceptual difficulties are significantly influenced by L1
vowel inventories.
The clear effect of the number of vowels in L1 inventories on L2 perception provides useful information about the online processing of Javanese and Sundanese as L2 learners and the English speakers in responding to two
conflicting pieces of information. The Javanese and Sundanese speakers who have a small number of L1 vowels experience difficulty in perceiving an L2
with a large number of vowels.
r
eferencesBaker, W. et al. 2002. “The effect of perceived phonetic similarity on L2 sound learning by children and adults”, in: A. Do, L. Dominguez, and A. Johansen (eds), BUCLD 26: Proceedings of the Twenty-Sixth Annual Boston University Conference on Language Development,pp. 36-47. Somerville, MA: Cascadilla Press.
Bradlow, Ann. R. 1995. “A comparative acoustic study of English and Spanish vowels”, Journal of the Acoustical Society of America 97: 1916-1925.
Bruhn, Pernille, Stephanie Huette, and Michael J. Spivey. 2013. “Degree of certainty modulates anticipatory processes in real time”, Journal of Experimental Psychology; Human Perception and Performance 40: 525.
Cebrian, Juli. 2006. “Experience and the use of non‐L1 duration in L2 vowel categorization”, Journal of Phonetics 34: 372-387.
Cebrian, Juli. 2007. “Old sounds in new contrasts; L2 production of the English tense-tax vowel distinction”, in J. Trouvain and W. J. Barry (eds),
Proceedings of the Sixteenth International Congress of Phonetic Sciences, pp.1637-1640. Saarbrucken: University of Saarland.
Crothers, J. 1978. Typology and universals of vowel systems, in: J. H. Greenberg (ed.), Universals of human language, Vol. 2: Phonology, pp. 94-152. Stanford, CA: Stanford University Press.
Dale, Rick, Caitlin Kehoe, and Michael J. Spivey 2007. “Graded motor responses in the time course of categorizing exemplars”, Memory and Cognition 35: 15-28.
Elvin, Jaydene, Paola Escudero, and Polina Vasiliev. 2014. “Spanish is better than English for discriminating Portuguese vowels; Acoustic similarity versus vowel system”, Frontiers in Psychology (October). [Language Sciences 5.]
Escudero, Paola. 2000. “Developmental patterns in the adult L2 acquisition of new contrasts; The acoustic cue weighting in the perception of Scottish tense/lax vowels in Spanish speakers”. MSc thesis, University of Edinburgh.
Escudero, Paola. 2005. Linguistic Perception and Second language acquisition: Explaining the attainment of optimal phonological categorization. PhD thesis, Utrecht University. [LOT dissertation series 113.]
Escudero, Paola. 2006. “Second language phonology; The role of perception”,
Escudero, Paola. 2006. “The phonological and phonetic development of new vowel contrasts in Spanish learners of English”, in: B. O. Baptista and M. A. Watkins (eds), English with a Latin beat; Studies in Portuguese/Spanish-English interphonology, pp. 149-161. Amsterdam: John Benjamins. [Studies in Bilingualism 31].
Escudero, Paola. 2009. “Linguistic perception of ‘similar’ L2 sounds”, in: P. Boersma and S. Hamann (eds), Phonology in perception. Berlin: Mouton de Gruyter.
Escudero, Paola and Paul Boersma. 2004. “Bridging the gap between L2 speech perception research and phonological theory”, Studies in Second Language Acquisition 26: 551-585.
Escudero, Paola and Katerina Chládková. 2010. “Spanish listeners’ perception of American and Southern British English vowels”, Journal of the Acoustical Society of America, 128: EL254-EL260.
Farmer, Thomas A., Sarah E. Anderson, and Michael. J. Spivey. 2007. “Gradiency and visual context in syntactic garden-paths”, Journal of Memory and Language 57: 570-595.
Farmer, Thomas A. et al. 2009. “L1 language experience influences the
perceived similarity of second language vowel categories”, in: N. Taatgen and H. van Rijn (eds), Proceedings of the Thirty-first Annual Conference of
the Cognitive Science Society, pp. 2588-2593. Austin, TX: Cognitive Science Society.
Flege, James E. 1987. “The production of ‘new’ and ‘similar’ phones in a foreign
language; Evidence for the effect of equivalent classification”, Journal of Phonetics 15: 47-65.
Flege, James E. 1992.” The intelligibility of English vowels spoken by British and Dutch talkers”, in: R. Kent (ed.), Intelligibility in speech disorders; Theory, measurement, and management, pp. 157-232. Amsterdam: John Benjamins.
Flege, James E. 1995. “Second language speech theory, findings and problems”,
in: W. Strange (ed.), Speech perception and linguistic experience; Theoretical and methodological issues, pp. 233-277. Baltimore, MD: York Press.
Flege, James E., O. S. Bohn, and S. Jang. 1997. “The effect of experience on non-native subjects’ production and perception of English vowels”, Journal of Phonetics 25: 437-470.
Flege, James E and K. L. Fletcher. 1992. “Talker and listener effects on degree of perceived foreign accent”, Journal of the Acoustical Society of America 91: 370-389.
Flege, J. E. and J. Hillendbrand. 1984. “Limits on phonetic accuracy in foreign language speech production”, Journal of the Acoustical Society of America
76: 708-721.
Flege, James E., M. Munro, and I. MacKay. 1995. “Factors affecting degree of perceived foreign accent in a second language”, Journal of the Acoustical Society of America 97: 3125-3134.
233
multidimensional scaling analysis”, Journal of the Acoustical Society of America 97: 2540-2551.
Freeman, Jonathan B. and Nalini Ambady. 2010. “MouseTracker; software for studying real-time mental processing using a computer mouse-tracking method”, Behavior Research Methods 42: 226-241. [Retrieved from: DOI: 10.3758/BRM.42.1.226.]
Freeman, Jonathan B., Rick Dale, and Thomas A. Farmer. 2011. “Hand in motion reveals mind in motion”, Frontiers in Psychology 2, 59.
Hayward, Katrina. 1995. “/p/ vs. /b/ in Javanese; The role of the vocal folds”,
SOAS Working Papers in Linguistics and Phonetics 5: 1-11.
Hillenbrand, James M., Michael J. Clark, and Robert A. Houde. 2000. “Some effects of duration on vowel recognition”, Journal of the Acoustical Society
108: 3013-3022.
Incera, Sara and Conor T. McLennan. 2016. “Mouse tracking reveals that bilinguals behave like experts”, Bilingualism; Language and Cognition 19: 610-620. [Retrieved from: DOI: 10.1017/S1366728915000218.]
Iverson, Paul and Brownen G. Evans. 2007. “Learning English vowels with
different first-language vowel systems; Perception of formant targets,
formant movements and duration”, Journal of the Acoustical Society of America 122: 2842-2854. [Retreived from: DOI: 10.1121/1.2783198.]
Iverson, Paul and Brownen G. Evans. 2009. “Learning English vowels with
different first-language vowel systems II; Auditory training for L1 Spanish
and German speakers”, Journal of the Acoustical Society of America 126: 866-877. [Retreived from: DOI: 10.1121/ 1.3148196.]
Ladefoged, Peter. 2001. Vowels and Consonants; An introduction to the sounds of languages. Oxford: Blackwell.
Ladefoged, Peter. 2006. A course in phonetics. New York, NY: Hartcourt Brace Jovanovich.
Lauder, Multamia R. M. T. and Ayatrohaedi. 2006. “The distribution of Austronesian and non-Austronesian languages in Indonesia; Evidence and issues, in: T. Simanjuntak, I. H. E. Pojoh, and Hisyam (eds), Austronesian diaspora and the ethnogeneses of people in Indonesian archipelago. Jakarta: LIPI Press. [Proceedings of the International Symposium.]
Morrison, Geoffrey S. 2008. “Perception of synthetic vowels by monolingual Canadian-English, Mexican-Spanish, and Peninsular-Spanish listeners”,
Canadian Acoustics 36: 17-23.
Morrison, Geoffrey S. 2009. “L1-Spanish speakers’ acquisition of the English /i/ - /ɪ/ contrast II; Perception of vowel inherent spectral change”,
Language and Speech 52: 437-462.
Perwitasari, Arum. 2013. ”Slips of the ears: Study on vowel perception in Indonesian learners of English”, Humaniora; Journal of Culture, Literature, and Linguistics 25: 103-110.
Sisinni, Bianca, Paola Escudero, and Mirko Grimaldi. 2013. “Salento Italian listeners’ perception of American English vowels”. [Paper, the Annual Conference of the International Speech Communication Association, Interspeech, Lyon, 26‐30 August 2013.]
Spivey, Michael J., Marc Grosjen, and Günther Knoblich. 2005. “Continuous attraction toward phonological competitors”, Proceedings of the National Academy of Sciences of the USA, 102/29, pp. 10393-10398. Washington, DC: National Academy of Sciences.
Wedhawati, Erni W. et al. 2006. Tata bahasa Jawa mutakhir [Grammar of modern Javanese]. Yogyakarta: Penerbit Kanisius.